Recognition: unknown
People, Places & Things: Network topology & motifs of R&D missions
Pith reviewed 2026-05-07 12:43 UTC · model grok-4.3
The pith
R&D programs form typed networks of people, institutions, and outputs that can be reconstructed and compared directly.
A machine-rendered reading of the paper's core claim, the machinery that carries it, and where it could break.
Core claim
R&D programs have an analysable topology: a typed arrangement of people, institutions, funders, projects, publications, patents, and citations that can be reconstructed, compared, and monitored. Applied to ARPA-E project impact sheets from the agency's first decade, the framework reconstructs 23 program-induced networks and an agency-level composed network. Programs can be compared by their local structural patterns, cross-program overlap is concentrated more in recurring institutions than in individual researchers, and program fingerprints differ across thematic areas.
What carries the argument
The typed network framework that represents each R&D program as a network whose nodes are explicitly typed as researchers, program directors, institutions, funders, publications, patents, projects, or citations and whose edges capture the documented relations among them.
If this is right
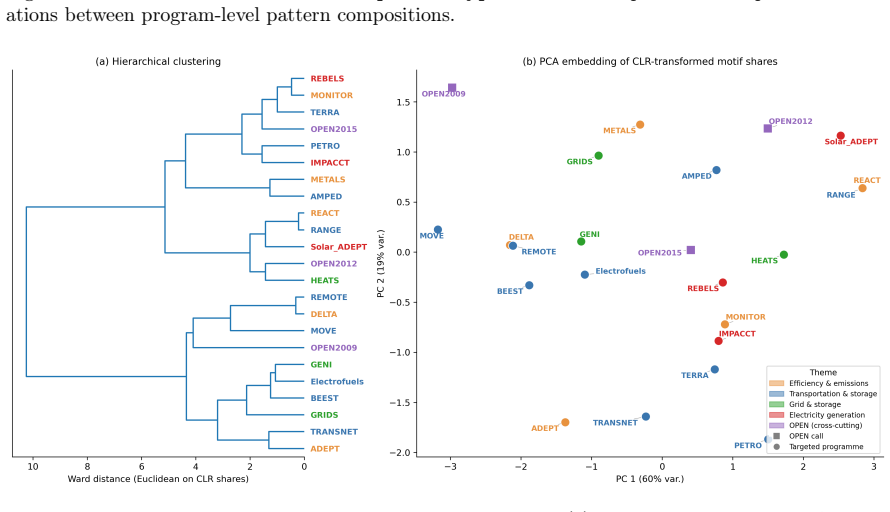
- Programs can be compared directly by their local structural patterns rather than by output counts alone.
- Cross-program overlap is concentrated more in recurring institutions than in individual researchers.
- Program network fingerprints differ across thematic areas.
- An agency-level network can be assembled by composing the separate program networks.
Where Pith is reading between the lines
- The same typed-network construction could be repeated at later dates to track how a program's architecture changes as new projects and outputs are added.
- Network patterns might reveal concentrations or gaps in how knowledge moves inside a single mission.
- Applying the framework to data from other funding agencies would test whether the observed institutional-versus-individual overlap pattern appears more generally.
Load-bearing premise
The ARPA-E project impact sheets contain complete, accurate, and consistently typed records of every person, institution, funder, project, publication, patent, and citation plus all their connections, with no systematic omissions or misclassifications.
What would settle it
Reconstructing the networks from the impact sheets and then comparing them against an independent record of the same programs to check whether a large fraction of known connections are missing or wrongly typed.
Figures


read the original abstract
Challenge-led R and D programs increasingly assemble heterogeneous people, organizations, funders, projects, and technical outputs around defined missions. Yet program evaluation often describes these systems through project lists, output counts, or retrospective case narratives. This article develops a typed network framework for representing R and D program architecture directly. We model programs as networks of people, places, and things: researchers, program directors, institutions, funders, publications, patents, projects, and citations. Applied to ARPA-E project impact sheets from the agency's first decade, the framework reconstructs 23 program-induced networks and an agency-level composed network. We show that R and D programs have an analysable topology: a typed arrangement of people, institutions, funders, projects, publications, patents, and citations that can be reconstructed, compared, and monitored. The analysis shows that programs can be compared by their local structural patterns, that cross-program overlap is concentrated more in recurring institutions than in individual researchers, and that program fingerprints differ across thematic areas. The article contributes to network science by extending topological analysis to R and D program systems, a class of governed, typed, and output-generating networks that has not been systematically represented in existing innovation-network work.
Editorial analysis
A structured set of objections, weighed in public.
Referee Report
Summary. The paper develops a typed network framework for R&D programs, modeling them as networks of researchers, program directors, institutions, funders, publications, patents, projects, and citations. Applied to ARPA-E project impact sheets from the agency's first decade, it reconstructs 23 program-induced networks plus an agency-level composed network. The central claims are that these networks possess an analysable topology allowing program comparison via local structural patterns, that cross-program overlap concentrates in recurring institutions rather than individual researchers, and that thematic fingerprints differ across areas.
Significance. If the reconstruction and pattern detection hold, the work offers a concrete extension of network science to governed, mission-oriented R&D systems that have previously been studied mainly through counts or case studies. It supplies a reproducible template for monitoring program architecture and overlap that could be adopted by other agencies.
major comments (3)
- [Data and Methods] Data and Methods: the rules for extracting nodes and typed edges from ARPA-E impact sheets (e.g., how co-authorship, institutional affiliation, or citation links are identified and deduplicated) are not specified, so the fidelity of the 23 reconstructed networks cannot be assessed.
- [Results] Results on local structure and motifs: no motif-detection algorithm, null model, or statistical significance test is described, leaving the reported local structural patterns and thematic fingerprints without controls for random expectation or reporting bias.
- [Discussion] Discussion of data completeness: the paper does not examine or bound the possibility of systematic missing edges (e.g., informal collaborations or external partners absent from administrative sheets), which directly affects the validity of overlap statistics and cross-program comparisons.
minor comments (2)
- [Abstract] The abstract and introduction could state the exact network metrics (degree distributions, clustering coefficients, etc.) used for the local-structure comparisons.
- [Figures] Figure captions should include the precise definition of the typed edges shown in the network diagrams.
Simulated Author's Rebuttal
We thank the referee for the constructive and detailed comments, which highlight important areas for improving the clarity and rigor of our manuscript. We address each major comment below and will incorporate revisions to strengthen the presentation of methods, results, and limitations.
read point-by-point responses
-
Referee: [Data and Methods] the rules for extracting nodes and typed edges from ARPA-E impact sheets (e.g., how co-authorship, institutional affiliation, or citation links are identified and deduplicated) are not specified, so the fidelity of the 23 reconstructed networks cannot be assessed.
Authors: We agree that the extraction procedures require more explicit documentation to allow assessment of network fidelity. The original manuscript outlines the overall framework but does not provide a step-by-step account of node/edge identification from the impact sheets. In the revised version we will add a dedicated Methods subsection that specifies: (i) the exact fields used to define each node type (researchers, institutions, publications, etc.); (ii) the rules for constructing typed edges (co-authorship from publication lists, affiliation from project metadata, citation links from reported outputs); and (iii) the deduplication protocol, including use of unique identifiers (e.g., ORCID, DOI, patent numbers) and manual review steps for ambiguous cases. This addition will make the reconstruction fully reproducible. revision: yes
-
Referee: [Results] no motif-detection algorithm, null model, or statistical significance test is described, leaving the reported local structural patterns and thematic fingerprints without controls for random expectation or reporting bias.
Authors: The manuscript reports local structural patterns and thematic fingerprints derived from motif analysis, but we acknowledge that the specific algorithmic implementation, null-model choice, and significance testing were not described in sufficient detail. We will expand the Methods section to include: the motif-detection algorithm employed, the null model (e.g., degree-preserving randomization), the number of randomizations performed, and the statistical criteria (z-scores or p-values) used to identify over-represented motifs. These additions will provide the necessary controls against random expectation and allow readers to evaluate the robustness of the reported patterns. revision: yes
-
Referee: [Discussion] the paper does not examine or bound the possibility of systematic missing edges (e.g., informal collaborations or external partners absent from administrative sheets), which directly affects the validity of overlap statistics and cross-program comparisons.
Authors: We agree that a discussion of data completeness is essential. The current manuscript does not explicitly address potential missing edges arising from informal collaborations or external partners not recorded in the official impact sheets. In the revised Discussion we will add a dedicated paragraph that (i) acknowledges the administrative nature of the data source and the consequent possibility of under-reporting informal ties, (ii) discusses how such missing edges could bias overlap statistics toward institutions (which are more consistently recorded) rather than individuals, and (iii) outlines the implications for cross-program comparisons. Where feasible, we will also report simple sensitivity checks (e.g., removal of low-degree nodes) to bound the effect. revision: yes
Circularity Check
No circularity: purely descriptive network reconstruction from external data
full rationale
The paper constructs typed networks of people, institutions, funders, projects, publications, patents and citations directly from ARPA-E project impact sheets, then reports observed local structural patterns, institutional overlap statistics and thematic fingerprints. No equations, fitted parameters, predictions, uniqueness theorems or ansatzes appear in the provided text. The central claim is that such networks are analysable and reconstructible; this is an empirical statement whose validity rests on data completeness rather than any self-referential derivation or self-citation chain. The work therefore contains no load-bearing steps that reduce to their own inputs by construction.
Axiom & Free-Parameter Ledger
axioms (1)
- domain assumption R&D programs can be represented as typed networks with nodes as people, places, and things and edges as relations extracted from project records.
Reference graph
Works this paper leans on
-
[1]
The ‘national system of innovation’in historical perspective,
C. Freeman, “The ‘national system of innovation’in historical perspective,”Cambridge Journal of economics, vol. 19, no. 1, pp. 5–24, 1995
1995
-
[2]
Lundvall,National systems of innovation: towards a theory of innovation and interactive learning, book section 4, pp
B.-A. Lundvall,National systems of innovation: towards a theory of innovation and interactive learning, book section 4, pp. 85–107. London: Pinter, 1992
1992
-
[3]
Systems of innovation approaches–their emergence and characteristics,
C. Edquist, “Systems of innovation approaches–their emergence and characteristics,”Systems of innovation: Technologies, institutions and organizations, vol. 1989, pp. 1–35, 1997
1989
-
[4]
R. R. Nelson,National innovation systems: a comparative analysis. Oxford University Press, 1993
1993
-
[5]
Chain-linked model of innovation,
S. Kline and N. Rosenberg, “Chain-linked model of innovation,”An Overview of Innovation: The Positive Sum Strategy. National Academy Press, Washington, DC, US, 1986
1986
-
[6]
The UK’s $1-billion bet to create technologies that change the world,
N. Gaind, “The UK’s $1-billion bet to create technologies that change the world,”Nature, no. 633, pp. 512–514, 2024
2024
-
[7]
J. Mervis, “Nsf held captive,”Science, vol. 389, no. 6767, pp. 1286–1290, 2025. 1095-9203 Mervis, Jeffrey News United States 2025/09/25 Science. 2025 Sep 25;389(6767):1286-1290. doi: 10.1126/science.aec5123. Epub 2025 Sep 25
-
[8]
Arpa-e and darpa: Applying the darpa model to energy innovation,
W. B. Bonvillian and R. Van Atta, “Arpa-e and darpa: Applying the darpa model to energy innovation,”The Journal of Technology Transfer, vol. 36, no. 5, p. 469, 2011
2011
-
[9]
The evolution of mission-oriented policies: Exploring chang- ing market creating policies in the us and european space sector,
D. K. Robinson and M. Mazzucato, “The evolution of mission-oriented policies: Exploring chang- ing market creating policies in the us and european space sector,”Research Policy, vol. 48, no. 4, pp. 936–948, 2019
2019
-
[10]
Thedesignandimplementationofmission-orientedinnovationpolicies: Anewsystemic policy approach to address societal challenges,
P.Larrue, “Thedesignandimplementationofmission-orientedinnovationpolicies: Anewsystemic policy approach to address societal challenges,”OECD Science, Technology and Industry Policy Papers, no. 100, 2021
2021
-
[11]
A vision of metascience: An engine of improvement for the social processes of science,
M. Nielsen and K. Qiu, “A vision of metascience: An engine of improvement for the social processes of science,” report, 2022
2022
-
[12]
Unblock research bottlenecks with non-profit start-ups,
A. Marblestone, A. Gamick, T. Kalil, C. Martin, M. Cvitkovic, and S. G. Rodriques, “Unblock research bottlenecks with non-profit start-ups,”Nature, vol. 601, no. 7892, pp. 188–190, 2022
2022
-
[13]
A new purpose for grand challenge frameworks in tumultuous times,
M. Ho, P. P. Khargonekar, and E. O’Sullivan, “A new purpose for grand challenge frameworks in tumultuous times,”Issues in Science and Technology, no. Spring 2026, 2025
2026
-
[14]
Funding breakthrough research: promises and challenges of the “arpa model
P. Azoulay, E. Fuchs, A. P. Goldstein, and M. Kearney, “Funding breakthrough research: promises and challenges of the “arpa model”,”Innovation policy and the economy, vol. 19, no. 1, pp. 69–96, 2019
2019
-
[15]
Technological paradigms and technological trajectories: a suggested interpretation of the determinants and directions of technical change,
G. Dosi, “Technological paradigms and technological trajectories: a suggested interpretation of the determinants and directions of technical change,”Research policy, vol. 11, no. 3, pp. 147–162, 1982
1982
-
[16]
Networks of scientific papers,
D. d. S. Price, “Networks of scientific papers,”Science, vol. 149, no. 3683, pp. 510–515, 1965
1965
-
[17]
Connectivity in a citation network: The development of dna theory,
N. P. Hummon and P. Dereian, “Connectivity in a citation network: The development of dna theory,”Social networks, vol. 11, no. 1, pp. 39–63, 1989
1989
-
[18]
Mapping technological trajectories as patent citation networks: A study on the history of fuel cell research,
B. Verspagen, “Mapping technological trajectories as patent citation networks: A study on the history of fuel cell research,”Advances in complex systems, vol. 10, no. 01, pp. 93–115, 2007
2007
-
[19]
Innovation network,
D. Acemoglu, U. Akcigit, and W. R. Kerr, “Innovation network,”Proceedings of the National Academy of Sciences, vol. 113, no. 41, pp. 11483–11488, 2016. 31
2016
-
[20]
The science of science: From the perspective of complex systems,
A. Zeng, Z. Shen, J. Zhou, J. Wu, Y. Fan, Y. Wang, and H. E. Stanley, “The science of science: From the perspective of complex systems,”Physics Reports, vol. 714-715, pp. 1–73, 2017
2017
-
[21]
Papers and patents are becoming less disruptive over time,
M. Park, E. Leahey, and R. J. Funk, “Papers and patents are becoming less disruptive over time,” Nature, vol. 613, no. 7942, pp. 138–144, 2023
2023
-
[22]
What is network science?,
U. Brandes, G. Robins, A. N. N. McCranie, and S. Wasserman, “What is network science?,” Network Science, vol. 1, no. 1, pp. 1–15, 2013
2013
-
[23]
Coauthorship patterns and trends in the sciences,
W. Glänzel, “Coauthorship patterns and trends in the sciences,”Scientometrics, vol. 61, no. 3, pp. 395–403, 2004
2004
-
[24]
Cross-firminventorsandsocialnetworks: Localisedknowledgespillovers revisited,
S.BreschiandF.Lissoni, “Cross-firminventorsandsocialnetworks: Localisedknowledgespillovers revisited,”Annals of Economics and Statistics, no. 97/98, pp. 189–217, 2010
2010
-
[25]
Mapping collaboration networks in science,
R. B. Sampaio and H. Lucas, “Mapping collaboration networks in science,”Information Research, vol. 21, no. 1, 2016
2016
-
[26]
Visualising collaboration networks in energy research,
J. M. Faganet al., “Visualising collaboration networks in energy research,”Energy Research & Social Science, vol. 42, pp. 36–48, 2018
2018
-
[27]
The role of networks in energy technology develop- ment,
C. Doblinger, K. Surana, and L. D. Anadon, “The role of networks in energy technology develop- ment,”Research Policy, vol. 48, no. 3, pp. 799–813, 2019
2019
-
[28]
Strategic alliance networks in clean energy innovation,
W. Shen and colleagues, “Strategic alliance networks in clean energy innovation,”Strategic Man- agement Journal, vol. 46, no. 2, pp. 210–232, 2025
2025
-
[29]
Institutional and country collaboration in science,
J. L. Ortega and I. F. Aguillo, “Institutional and country collaboration in science,”Journal of Informetrics, vol. 8, no. 2, pp. 295–305, 2014
2014
-
[30]
International collaboration networks in energy inno- vation,
A. Isfandyari-Moghaddam and N. Kumar, “International collaboration networks in energy inno- vation,”Technological Forecasting and Social Change, vol. 191, p. 122504, 2023
2023
-
[31]
Network perspectives on scientific collaboration,
A. Pepeet al., “Network perspectives on scientific collaboration,”Quantitative Science Studies, vol. 5, no. 1, pp. 1–20, 2024
2024
-
[32]
The distinctive innovation patterns and net- work embeddedness of scientific prizewinners,
C. Tian, Y. Huang, C. Jin, Y. Ma, and B. Uzzi, “The distinctive innovation patterns and net- work embeddedness of scientific prizewinners,”Proceedings of the National Academy of Sciences, vol. 122, no. 40, p. e2424143122, 2025
2025
-
[33]
Flat teams drive scientific innovation,
F. Xu, L. Wu, and J. Evans, “Flat teams drive scientific innovation,”Proceedings of the National Academy of Sciences, vol. 119, no. 23, p. e2200927119, 2022
2022
-
[34]
Dynamics of technology emergence in innovation networks,
M. Ho, H. C. W. Price, T. S. Evans, and E. O’Sullivan, “Dynamics of technology emergence in innovation networks,”Scientific Reports, vol. 14, no. 1, p. 1411, 2024
2024
-
[35]
Enhancing foresight models with network science: Measuring innovation feedbacks within the chain-linked model,
M. Ho, H. C. W. Price, T. S. Evans, and E. O’Sullivan, “Enhancing foresight models with network science: Measuring innovation feedbacks within the chain-linked model,”Technological Forecasting and Social Change, vol. 213, p. 124010, 2025
2025
-
[36]
Network motifs: Simple building blocks of complex networks,
R. Milo, S. Shen-Orr, S. Itzkovitz, N. Kashtan, D. Chklovskii, and U. Alon, “Network motifs: Simple building blocks of complex networks,”Science, vol. 298, no. 5594, pp. 824–827, 2002
2002
-
[37]
Temporal motifs in multiplex networks,
P. Bao, Z.-D. Zhao, and J. Huang, “Temporal motifs in multiplex networks,”Nature Communi- cations, vol. 13, no. 1, p. 1234, 2022
2022
-
[38]
Temporal and multiplex motifs in complex networks,
T. Trinh Vinhet al., “Temporal and multiplex motifs in complex networks,”Physical Review E, vol. 91, no. 5, p. 052808, 2015
2015
-
[39]
Discovering motifs in temporal networks,
F. W. Takes and W. A. Kosters, “Discovering motifs in temporal networks,”Social Network Analysis and Mining, vol. 8, no. 1, pp. 1–14, 2018
2018
-
[40]
Multilayer networks,
M. Kivelä, A. Arenas, M. Barthelemy, J. P. Gleeson, Y. Moreno, and M. A. Porter, “Multilayer networks,”Journal of complex networks, vol. 2, no. 3, pp. 203–271, 2014. 32
2014
-
[41]
The structure and dynamics of multilayer networks,
S. Boccaletti, G. Bianconi, R. Criado, C. I. del Genio, J. G?mez-Garde?es, M. Romance, I. Sendi?a-Nadal, Z. Wang, and M. Zanin, “The structure and dynamics of multilayer networks,” Physics Reports, vol. 544, no. 1, pp. 1–122, 2014
2014
-
[42]
Rethinking the role of the state in technology development: Darpa and the case for embedded network governance,
E. R. Fuchs, “Rethinking the role of the state in technology development: Darpa and the case for embedded network governance,”Research Policy, vol. 39, no. 9, pp. 1133–1147, 2010
2010
-
[43]
M. J. Piore, P. Colatat, and E. B. Reynolds,NSF and DARPA as Models for Research Funding: An Institutional Analysis, book section 3. Cambridge, UK: Open Book Publishers, 2019
2019
-
[44]
Aria corporate plan 2024,
ARIA, “Aria corporate plan 2024,” report, Advanced Research and Invention Agency, 2024
2024
-
[45]
Who made the mrna vaccine? measuring division of labor in therapeutic innovation,
M. Ho, H. C. W. Price, T. S. Evans, and E. O’Sullivan, “Who made the mrna vaccine? measuring division of labor in therapeutic innovation,”Nature Biotechnology, vol. 42, no. 11, pp. 1643–1648, 2024
2024
-
[46]
W. B. Bonvillian, R. Van Atta, and P. H. Windham,Lessons from DARPA for Innovating in Defense Legacy Sectors. The DARPA Model for Transformative Technologies, 2020
2020
-
[47]
Know when to fold ‘em: An empirical description of risk management in public research funding,
A. P. Goldstein and M. Kearney, “Know when to fold ‘em: An empirical description of risk management in public research funding,”Research Policy, vol. 49, no. 1, p. 103873, 2020
2020
-
[48]
National Academies of Sciences, Engineering, Medicine, 2017
NAS,An Assessment of ARPA-E. National Academies of Sciences, Engineering, Medicine, 2017
2017
-
[49]
The challenges of challenge-led research and innovation agencies,
M. Ho, L. Killen, and E. O’Sullivan, “The challenges of challenge-led research and innovation agencies,”Cambridge Industrial Innovation Policy, University of Cambridge, 2021
2021
-
[50]
Dimensions: Buildingcontextforsearchandevaluation,
D.W.Hook, S.J.Porter, andC.Herzog, “Dimensions: Buildingcontextforsearchandevaluation,” Frontiers in Research Metrics and Analytics, vol. 3, 2018
2018
-
[51]
B. L. Perry, B. A. Pescosolido, and S. P. Borgatti,Egocentric Network Analysis: Foundations, Methods, and Models. Structural Analysis in the Social Sciences, Cambridge: Cambridge Univer- sity Press, 2018
2018
-
[52]
Darpaanditsarpa-eandiarpaclones: auniqueinnovationorganizationmodel,
W.B.Bonvillian, “Darpaanditsarpa-eandiarpaclones: auniqueinnovationorganizationmodel,” Industrial and corporate change, vol. 27, no. 5, pp. 897–914, 2018
2018
-
[53]
Ergas,Does technology policy matter?Technology and Global Industry: Companies and Nations in the World Economy, National Academies Press, 1987
H. Ergas,Does technology policy matter?Technology and Global Industry: Companies and Nations in the World Economy, National Academies Press, 1987
1987
-
[54]
An assessment of arpa-e,
National Academies of Sciences, Engineering, and Medicine, “An assessment of arpa-e,” tech. rep., National Academies Press, 2017
2017
-
[55]
Missioninnovationintheenergysector: Evaluatingpublicprogrammes,
J.Pless, “Missioninnovationintheenergysector: Evaluatingpublicprogrammes,”Applied Energy, vol. 274, p. 115320, 2020
2020
-
[56]
Evaluations of arpa-e and mission-oriented r&d programmes,
What Works Centre for Local Economic Growth, “Evaluations of arpa-e and mission-oriented r&d programmes,” tech. rep., 2024
2024
-
[57]
Linked patent-publication data for energy innovation studies,
C. Wilsonet al., “Linked patent-publication data for energy innovation studies,”Energy Policy, vol. 123, pp. 166–178, 2018
2018
-
[58]
Public r&d spillovers in clean energy technologies,
A. Dyevre, “Public r&d spillovers in clean energy technologies,” tech. rep., European Central Bank, 2024
2024
-
[59]
Apra-e: The first seven years: A sampling of project outcomes,
E. D. Williams, “Apra-e: The first seven years: A sampling of project outcomes,” report, US Department of Energy (USDOE), Washington DC (United States). Advanced Research Projects Agency-Energy (ARPA-E), 2016
2016
-
[60]
Arpa-e impacts: A sampling of project outcomes, volume iii,
Y. A. Xu, “Arpa-e impacts: A sampling of project outcomes, volume iii,” report, US Department of Energy (USDOE), Washington DC (United States). Advanced Research Projects Agency-Energy (ARPA-E), 2018. 33
2018
-
[61]
Arpa-e impacts: A sampling of project outcomes, volume ii,
E. Rohlfing, “Arpa-e impacts: A sampling of project outcomes, volume ii,” report, US Depart- ment of Energy (USDOE), Washington DC (United States). Advanced Research Projects Agency- Energy (ARPA-E), 2017
2017
-
[62]
Evaluation of arpa-e’s mission and goals,
NAS, “Evaluation of arpa-e’s mission and goals,” report, National Academies of Sciences, Engi- neering & Medicine, 2025
2025
-
[63]
Tame wicked grand challengre,
M. Ho, P. P. Khargonekar, and E. O’Sullivan, “Tame wicked grand challengre,”SSRN Electronic Journal, 2025
2025
-
[64]
Monitoring and evaluation of mission-oriented innovation policies,
P. Larrue, P. T?nurist, and D. Jonason, “Monitoring and evaluation of mission-oriented innovation policies,” report, OECD, 2024
2024
-
[65]
Wanted: Better benchmarks,
J. H. Marburger, “Wanted: Better benchmarks,”Science, vol. 308, no. 5725, pp. 1087–1087, 2005
2005
-
[66]
The science of science policy: A federal research roadmap,
N. Science and T. Council, “The science of science policy: A federal research roadmap,” report, Executive Office of the President of the United States, 2008
2008
-
[67]
Treasury,Magenta Book: Central Government Guidance on Evaluation
H. Treasury,Magenta Book: Central Government Guidance on Evaluation. HM Treasury, 2020
2020
-
[68]
The arpa model for innovation in the 21st century,
P. Azoulayet al., “The arpa model for innovation in the 21st century,” working paper, NBER, 2018
2018
-
[69]
Uncertainty and innovation: Evidence from u.s. technology policy experiments,
A. Goldstein and M. Kearney, “Uncertainty and innovation: Evidence from u.s. technology policy experiments,” tech. rep., MIT Energy Initiative Working Paper, 2016
2016
-
[70]
Beyond a single stimulus: Mid-course evaluation of arpa-e,
S. Heard and colleagues, “Beyond a single stimulus: Mid-course evaluation of arpa-e,” tech. rep., U.S. Department of Energy, 2022
2022
-
[71]
Financing cleantech startups: Evidence from arpa-e,
S. Howell and F. Mezzanotti, “Financing cleantech startups: Evidence from arpa-e,”American Economic Review, vol. 110, no. 4, pp. 1136–1171, 2020
2020
-
[72]
Evaluating mission-oriented energy innovation programmes,
J. Pless, “Evaluating mission-oriented energy innovation programmes,” tech. rep., International Energy Agency, 2022
2022
-
[73]
O. L. de Weck,Quantifying Technological Progress, pp. 83–118. Cham: Springer International Publishing, 2022
2022
-
[74]
Changing the business of breakthroughs,
R. E. Dugan and K. J. Gabriel, “Changing the business of breakthroughs,”Issues in Science and Technologies, no. Summer 2022, 2022
2022
-
[75]
Arpa-e: Programs & initiatives,
ARPA-E, “Arpa-e: Programs & initiatives,” n.d
-
[76]
Scienceandtechnologyindevelopment environments - findings and observations for the missile defense agency from commercial industry and defense programs,
R.vanAtta, R.Bovey, J.Harwood, W.Hong, andA.Hull, “Scienceandtechnologyindevelopment environments - findings and observations for the missile defense agency from commercial industry and defense programs,”Institute for Defense Analyses, p. 122, 2003. 34
2003
discussion (0)
Sign in with ORCID, Apple, or X to comment. Anyone can read and Pith papers without signing in.