Recognition: unknown
Counting own goals: High-level assessment of the economic relationship between the ICT and the Oil and Gas sectors and its environmental implications
Pith reviewed 2026-05-07 12:39 UTC · model grok-4.3
The pith
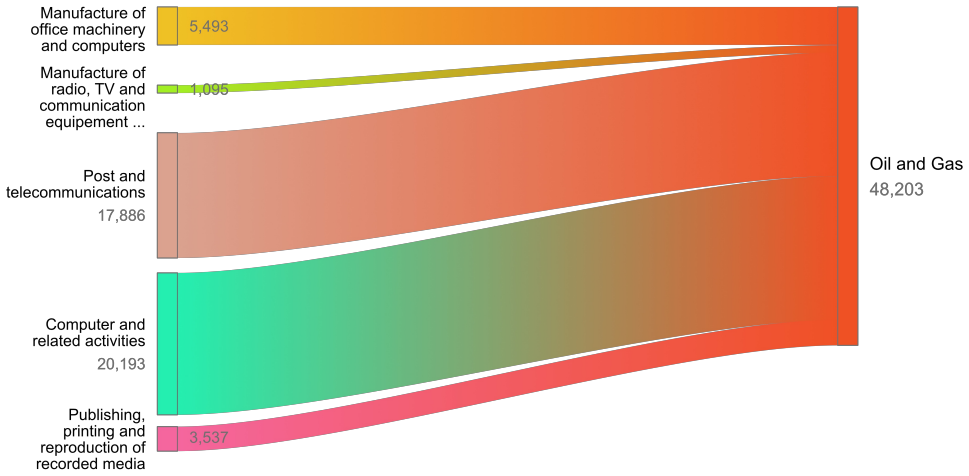
On average 2% of ICT financial flows go to oil and gas, with more than four dollars to O&G for every dollar to renewables and nuclear in 2022.
A machine-rendered reading of the paper's core claim, the machinery that carries it, and where it could break.
Core claim
Input-output tables show that ICT directs on average 2% of its annual financial flows toward the oil and gas sector, and that in 2022 this ratio reached more than four dollars to O&G for every one dollar to renewable and nuclear energy. The authors supply a classification of digital activities in O&G, estimate added emissions in two concrete case studies of oil operations, and examine causal links between the historical success of GPU technology and its early ties to the O&G sector, thereby providing analytical elements for quantifying the net emissions consequences of digitalizing fossil-fuel activities.
What carries the argument
Input-output analysis of inter-sector financial flows, supplemented by a classification of digital activities within oil and gas operations.
If this is right
- Absolute ICT spending on O&G products and services has increased substantially with the sector's growth.
- Digital tools applied to O&G activities produce net added emissions in the studied cases.
- Environmental accounting for ICT must include enabling effects on carbon-intensive sectors rather than only direct or avoided emissions.
- The historical entanglement between GPU technology and O&G investments continues to shape current AI hardware trajectories.
Where Pith is reading between the lines
- The same input-output approach could be extended to other high-emission sectors such as agriculture or heavy transport to identify comparable digital multipliers.
- If the observed flow ratios persist, accelerating digitalization in energy systems may improve fossil-fuel operations more than it accelerates the shift to low-carbon alternatives.
- Long-term tracking of these inter-sector flows offers a measurable indicator of how quickly ICT decouples from legacy energy infrastructure.
Load-bearing premise
The input-output tables and the chosen classification of digital activities in O&G accurately reflect real economic relationships without major data gaps or unaccounted offsetting effects from 2000 to 2022.
What would settle it
Granular transaction data or updated input-output tables for the same period showing the average ICT-to-O&G flow below 1.5% or the 2022 ratio below three-to-one would falsify the central quantitative claim.
Figures


read the original abstract
The ICT sector has been one of the most successful and fastest-growing industry in history. While the environmental issue in this sector has mainly been addressed by assessing its footprint and, to a lesser extent, its avoided emissions or net impacts, the additional emissions from the digitalization of carbon-intensive activities, such as the Oil and Gas (O&G) sector, have rarely been discussed. By doing so, we have forgotten to count the own goals conceded over more than 20 years in the troubled relationship between the ICT and the O&G sector. Using input-output analysis and economic data ranging from 2000 to 2022, we observe that on average 2% of the annual financial flows from the ICT sector are directed towards the Oil and Gas sector. Considering the significant growth of the ICT sector during this time, O&G companies now spends a massive amount on ICT products in absolute terms. It also appears that in 2022, for each dollar going from the ICT sector to the renewable and nuclear energy industry, more than $4 go to the O&G industry. In addition, we also provide a classification of digital activities in the O&G sector to facilitate environmental assessments and present two case studies estimating potential added emissions from the digitalization of oil activities. Finally, looking at the immense growth in generative AI, we provide an exploration of causal links between the current success of GPU technology and its intricate early relationship with the O&G sector. This article lays the groundwork for defining the nature of the relationship between ICT and O&G, which predates the current hype surrounding generative AI. We provide the analytical elements needed to begin estimating the added emissions from the digitalisation of O&G.
Editorial analysis
A structured set of objections, weighed in public.
Referee Report
Summary. The paper applies input-output analysis to economic data spanning 2000–2022 to quantify financial flows from the ICT sector to Oil & Gas (O&G), reporting an average 2% of annual ICT flows directed to O&G and a 2022 ratio of more than 4:1 in favor of O&G over renewable/nuclear energy. It introduces a custom classification of digital activities within O&G, presents two case studies estimating added emissions from digitalization of oil activities, and explores historical links between GPU technology and O&G that may relate to current generative AI growth.
Significance. If the core flow estimates and classification hold under scrutiny, the work identifies an under-examined channel of ICT-enabled emissions via support for carbon-intensive sectors, supplying a classification and case-study framework that could support more granular net-impact assessments of digitalization. The long time series and explicit comparison to renewables add a temporal dimension that is currently missing from most ICT footprint studies.
major comments (2)
- [Classification of digital activities in O&G] The section presenting the custom classification of digital activities in O&G (and its application to extract intermediate consumption from the input-output tables): the manuscript does not supply an explicit concordance table mapping the new categories onto the industry codes or sub-sectors used in the source IO tables. Because the headline 2% average and 4:1 ratio are derived directly from these extracted flows, any misalignment between the custom classification and the underlying table aggregation directly affects the central quantitative claims.
- [Results on financial flows] The results section reporting the 2% average flow and 2022 ratio (and the associated tables or figures): no uncertainty ranges, sensitivity tests to alternative sector aggregations, or robustness checks against different IO table vintages are provided. Given the known coarseness of digital-service categories in 2000–2022 IO tables, the absence of these checks leaves the reported ratios vulnerable to material revision.
minor comments (2)
- [Abstract and Methods] The abstract and methods description state the use of input-output analysis and the 2000–2022 range but do not name the specific IO database(s), country coverage, or emission conversion factors employed; these details should be added for reproducibility.
- [Case studies] The two case studies on added emissions would benefit from a short table listing the key assumptions (activity levels, emission intensities, digitalization penetration rates) so readers can assess transferability.
Simulated Author's Rebuttal
We thank the referee for their constructive and detailed feedback. We address each major comment below and outline the revisions we will implement.
read point-by-point responses
-
Referee: [Classification of digital activities in O&G] The section presenting the custom classification of digital activities in O&G (and its application to extract intermediate consumption from the input-output tables): the manuscript does not supply an explicit concordance table mapping the new categories onto the industry codes or sub-sectors used in the source IO tables. Because the headline 2% average and 4:1 ratio are derived directly from these extracted flows, any misalignment between the custom classification and the underlying table aggregation directly affects the central quantitative claims.
Authors: We agree that an explicit concordance table is necessary to ensure transparency and allow verification of the flow extraction. In the revised manuscript we will add a detailed concordance table that maps each custom digital activity category in the O&G sector to the precise industry codes and sub-sectors used in the source input-output tables. This will directly support the reported 2% average and 4:1 ratio by clarifying the aggregation steps. revision: yes
-
Referee: [Results on financial flows] The results section reporting the 2% average flow and 2022 ratio (and the associated tables or figures): no uncertainty ranges, sensitivity tests to alternative sector aggregations, or robustness checks against different IO table vintages are provided. Given the known coarseness of digital-service categories in 2000–2022 IO tables, the absence of these checks leaves the reported ratios vulnerable to material revision.
Authors: We acknowledge that the coarseness of digital-service categories in the available IO tables makes robustness checks important. In the revised manuscript we will add uncertainty ranges for the headline figures, sensitivity tests to alternative sector aggregations, and comparisons across different IO table vintages. These additions will quantify the stability of the 2% average and 2022 ratio under plausible variations in classification. revision: yes
Circularity Check
No circularity: claims derived from external input-output tables and data
full rationale
The paper applies standard input-output analysis to external economic datasets (2000-2022) to compute observed financial flows (average 2% ICT to O&G) and ratios (2022 >4:1 vs renewables/nuclear). The provided classification of digital activities in O&G is an auxiliary contribution for future assessments and does not enter the flow calculations as a definitional or fitted input. No equations reduce results to inputs by construction, no self-citation load-bearing premises, and no fitted parameters renamed as predictions. The derivation chain remains independent of the paper's own outputs.
Axiom & Free-Parameter Ledger
axioms (1)
- domain assumption Input-output analysis tables accurately represent inter-sector financial flows for the studied period
Reference graph
Works this paper leans on
-
[1]
European Commission, 1996
Information Society Forum,Networks for people and their communi- ties: making the most of the information society in the European Union: first annual report to the European Commission from the Information Society Forum, June 1996. European Commission, 1996
1996
-
[2]
The Enablement Effect: The Impact of Mobile Communications Technologies on Carbon Emission Reduc- tions,
GSMA and Carbon Trust, “The Enablement Effect: The Impact of Mobile Communications Technologies on Carbon Emission Reduc- tions,” 2019
2019
-
[3]
Sustainability at the Speed of Light,
D. Pamlin, “Sustainability at the Speed of Light,”Solna, Sweden: WWF Sweden, 2002
2002
-
[4]
The relevance of information and communication technologies for environmental sustainability–a prospective simula- tion study,
L. M. Hilty, P. Arnfalk, L. Erdmann, J. Goodman, M. Lehmann, and P. A. W ¨ager, “The relevance of information and communication technologies for environmental sustainability–a prospective simula- tion study,”Environmental Modelling & Software, vol. 21, no. 11, pp. 1618–1629, 2006
2006
-
[5]
Digital rebound–why digitalization will not redeem us our environmental sins,
V . C. Coroam ˘a and F. Mattern, “Digital rebound–why digitalization will not redeem us our environmental sins,” inProceedings 6th international conference on ICT for sustainability. Lappeenranta., vol. 2382, 2019
2019
-
[6]
Guidelines for assessments of the global information and communication tech- nology sector’s direct energy use and climate impact: Key aspects and future scenarios,
A. Furberg, S. Azizi, J. Bieser, D. Bol, V . Coroam ˘a, E. Eriksson, F. Fuso-Nerini, L. Golard, M. H ¨ojer, G. Kamiya,et al., “Guidelines for assessments of the global information and communication tech- nology sector’s direct energy use and climate impact: Key aspects and future scenarios,”Renewable and Sustainable Energy Reviews, vol. 226, p. 116176, 2026
2026
-
[7]
A review of assessments of the greenhouse gas footprint and abatement poten- tial of information and communication technology,
J. C. Bieser, R. Hintemann, L. M. Hilty, and S. Beucker, “A review of assessments of the greenhouse gas footprint and abatement poten- tial of information and communication technology,”Environmental Impact Assessment Review, vol. 99, p. 107033, 2023
2023
-
[8]
Success cases and lessons learned after 20 years of oilfield digitalization efforts,
L. Saputelli, J. Duran, F. Rivas, E. Casas, L. Ramos, C. Bravo, A. Chacon, C. Temizel, S. Mubarak, J. Chacon,et al., “Success cases and lessons learned after 20 years of oilfield digitalization efforts,” in SPE Annual Technical Conference and Exhibition, p. D021S012R005, SPE, 2024
2024
-
[9]
Statistical review of world energy 2024,
Energy Institute, “Statistical review of world energy 2024,” 2024. Annual global energy dataset including oil and gas production in exajoules
2024
-
[10]
Energy and AI,
International Energy Agency, “Energy and AI,” 2025. Licence: CC BY 4.0
2025
-
[11]
Aramco believes AI can help double oil-well productivity, hydrocarbons here to stay,
The Arab Weekly, “Aramco believes AI can help double oil-well productivity, hydrocarbons here to stay,” 2025. Accessed: 2026-04- 22
2025
-
[12]
Suh,Handbook of input-output economics in industrial ecology, vol
S. Suh,Handbook of input-output economics in industrial ecology, vol. 23. Springer Science & Business Media, 2009
2009
-
[13]
EXIOBASE 3: Developing a Time Series of Detailed Environmentally Extended Multi-Regional Input-Output Tables,
K. Stadler, R. Wood, T. Bulavskaya, C.-J. S ¨odersten, M. Simas, S. Schmidt, A. Usubiaga, J. Acosta-Fern ´andez, J. Kuenen, M. Bruck- ner, S. Giljum, S. Lutter, S. Merciai, J. H. Schmidt, M. C. Theurl, C. Plutzar, T. Kastner, N. Eisenmenger, K.-H. Erb, A. de Kon- ing, and A. Tukker, “EXIOBASE 3: Developing a Time Series of Detailed Environmentally Extende...
2018
-
[14]
EXIOBASE3: Developing a Time Series of Detailed Environmentally Extended Multi-Regional Input-Output Tables
EXIOBASE Consortium, “EXIOBASE3: Developing a Time Series of Detailed Environmentally Extended Multi-Regional Input-Output Tables.” Zenodo, 2021
2021
-
[15]
Estimating the carbon footprint of ict using input-output analysis: Dealing with overcounting and other challenges,
F. Charpentier, B. Martins, and P. Bourcier, “Estimating the carbon footprint of ict using input-output analysis: Dealing with overcounting and other challenges,” in2023 International Conference on ICT for Sustainability (ICT4S), pp. 154–163, IEEE, 2023
2023
-
[16]
Comparing ICT Greenhouse Gas Emissions to the Rest of the Economy,
F. Charpentier, J. Blain, J. Axenbeck, and S. Kunkel, “Comparing ICT Greenhouse Gas Emissions to the Rest of the Economy,” in2025 11th International Conference on ICT for Sustainability (ICT4S), pp. 244– 253, IEEE, 2025
2025
-
[17]
United Nations Statistics Division,International Standard Industrial Classification of All Economic Activities (ISIC), Rev. 4. Statistical Papers, Series M No. 4 Rev. 4, New York: United Nations, 2008
2008
-
[18]
Back to the Future—a Retrospective on 40 Years of Smart Fields Experience,
R. Cramer, “Back to the Future—a Retrospective on 40 Years of Smart Fields Experience,” inSPE Intelligent Energy International Conference and Exhibition, pp. SPE–111478, SPE, 2008
2008
-
[19]
BP Technology Outlook 2018: How technology could change the way energy is produced and consumed,
BP, “BP Technology Outlook 2018: How technology could change the way energy is produced and consumed,” March 2018
2018
-
[20]
Digital Technologies,
Saudi Aramco, “Digital Technologies,” n.d. Accessed: 2026-04-22
2026
-
[21]
Securing the iot edge,
D. Hedge, C. Martinez Spessot, N. Oliver, M. Carranza, L. Talluru, and D. Nuyen, “Securing the iot edge,” 2019
2019
-
[22]
Supercharging Digital Transformations in Oil and Gas,
PwC, “Supercharging Digital Transformations in Oil and Gas,” 2021
2021
-
[23]
Digitizing Downstream Oil and Gas Operations: A framework for capturing value,
R. Geissbauer, A. Pandey, J. Salamat, I. Gallo, D. Katiyar, and S. Rahimi, “Digitizing Downstream Oil and Gas Operations: A framework for capturing value,” technical report, Strategy&, part of the PwC network, 2019. Accessed January 6, 2026
2019
-
[24]
L. 1480: Enabling the Net Zero transition: Assessing how the use of information and communication technology solutions impact greenhouse gas emissions of other sectors,
L. ITU, “L. 1480: Enabling the Net Zero transition: Assessing how the use of information and communication technology solutions impact greenhouse gas emissions of other sectors,” 2022
2022
-
[25]
ITU-T L.Suppl.54 (10/2022): Guidance for Assessing the Greenhouse Gas Emissions Consequences of the Financial Effects Generated by Information and Communication Technology,
International Telecommunication Union (ITU), “ITU-T L.Suppl.54 (10/2022): Guidance for Assessing the Greenhouse Gas Emissions Consequences of the Financial Effects Generated by Information and Communication Technology,” Oct 2022
2022
-
[26]
A review of modern approaches of digitalization in oil and gas industry,
S. Al-Rbeawi, “A review of modern approaches of digitalization in oil and gas industry,”Upstream Oil and Gas Technology, vol. 11, p. 100098, 2023
2023
-
[27]
Big Data in Field Development Projects,
A. Gurianov, A. Katashov, K. Ovchinnikov, K. Saprykina, I. Novikov, E. Malyavko, and V . Kiselev, “Big Data in Field Development Projects,” inProceedings of the SPE Reservoir and Production Technology Conference (RPTC), Society of Petroleum Engineers,
-
[28]
SPE Paper ID: 219165
-
[29]
ExxonMobil to Increase Permian Profitability Through Digital Partnership with Microsoft,
Microsoft, “ExxonMobil to Increase Permian Profitability Through Digital Partnership with Microsoft,” Feb. 2019. Accessed January 5, 2026
2019
-
[30]
Permian Basin operations,
XTO Energy, “Permian Basin operations,” 2025. Accessed: 2025-01- 07
2025
-
[31]
Greenhouse Gas Equiva- lencies Calculator: Calculations and References,
U.S. Environmental Protection Agency, “Greenhouse Gas Equiva- lencies Calculator: Calculations and References,” 2025. Accessed January 5, 2026
2025
-
[32]
Carbon Dioxide Emissions from Oil Shale Derived Liquid Fuels,
A. R. Brandt, J. Boak, and A. K. Burnham, “Carbon Dioxide Emissions from Oil Shale Derived Liquid Fuels,” inOil Shale: A Solution to the Liquid Fuel Dilemma, vol. 1032 ofACS Symposium Series, pp. 219–248, Washington, DC: American Chemical Society, 2010
2010
-
[33]
2025 Environmental Data Fact Sheet,
Microsoft Corporation, “2025 Environmental Data Fact Sheet,” 2025. Environmental data supporting the 2025 Environmental Sustainability Report. Accessed January 5, 2026
2025
-
[34]
Refinery digital transformation: Driving an end-to-end value chain optimization strat- egy with AI and prescriptive models,
H. G. Gulati, J. M. McMullen, and M. Awad, “Refinery digital transformation: Driving an end-to-end value chain optimization strat- egy with AI and prescriptive models,” inAbu Dhabi International Petroleum Exhibition and Conference, p. D012S116R013, SPE, 2020
2020
-
[35]
Astron Energy transforms crude assay management process and reduces assay creation time by 50%,
A VEV A, “Astron Energy transforms crude assay management process and reduces assay creation time by 50%,” 2025. Accessed: 2025-01- 07
2025
-
[36]
VLO-ARS-Combo-Book: 2025 Annual Report and Notice of Annual Meeting of Stockholders,
Valero Energy Corporation, “VLO-ARS-Combo-Book: 2025 Annual Report and Notice of Annual Meeting of Stockholders,” 2025. Ac- cessed: 2025-01-07
2025
-
[37]
LRQA Independent As- surance Statement Relating to Valero Energy Corporation’s GHG Inventory for Calendar Year 2024,
Valero Energy Corporation and LRQA, “LRQA Independent As- surance Statement Relating to Valero Energy Corporation’s GHG Inventory for Calendar Year 2024,” 2025. Accessed: 2025-01-07
2024
-
[38]
World Energy Investment 2025 – Executive Summary,
International Energy Agency, “World Energy Investment 2025 – Executive Summary,” 2025
2025
-
[39]
The Future of ESG Investing,
B. Media, “The Future of ESG Investing,” 2026
2026
-
[40]
Remarks by Ahmad O. Khowaiter at the 2025 Adopt AI International Summit,
A. O. Al-Khowaiter, “Remarks by Ahmad O. Khowaiter at the 2025 Adopt AI International Summit,” November 2025
2025
-
[41]
AI leading to faster, cheaper oil produc- tion, executives say
S. Dang and G. Mccartney, “AI leading to faster, cheaper oil produc- tion, executives say.” Reuters, Mar. 2025. Accessed: Dec. 17, 2025
2025
-
[42]
Every Last Drop: Using AI-powered analysis to find oil-field upside potential,
A. Latham, O. Marnell, J. Dixon, and Wood Mackenzie, “Every Last Drop: Using AI-powered analysis to find oil-field upside potential,” Sept. 2025. Accessed: 2025-01-07
2025
-
[43]
History of the Modern Graphics Processor, part 3
G. Singer, “History of the Modern Graphics Processor, part 3.” TechSpot, Dec. 2020. Accessed: Dec. 19, 2025
2020
-
[44]
Oil and Gas upstart has no reserves about GPUs
T. P. Morgan, “Oil and Gas upstart has no reserves about GPUs.” The Next Platform, 2017. Accessed: Dec. 02, 2025
2017
-
[45]
Imaging Earth’s subsurface using CUDA,
H. Nguyen, “Imaging Earth’s subsurface using CUDA,” inGPU Gems 3, NVIDIA, 2008. Accessed: Dec. 19, 2025
2008
-
[46]
How nvidia became a trillion-dollar company
P. Sayer, “How nvidia became a trillion-dollar company.” CIO, 2023. Accessed: Dec. 19, 2025
2023
-
[47]
Value creation of Digital Oilfield Technology, study case Duri Field well monitoring,
Z. Achmad, “Value creation of Digital Oilfield Technology, study case Duri Field well monitoring,” inSPE/IATMI Asia Pacific Oil & Gas Conference and Exhibition, Oct. 2017
2017
-
[48]
ECHELON software: Billion Cell Calculation,
V . Natoli, “ECHELON software: Billion Cell Calculation,” Apr. 2017. Accessed: Dec. 19, 2025
2017
-
[49]
Full-GPU Reservoir Simulation Delivers on its Promise for Giant Carbonate Fields,
A. V .et al., “Full-GPU Reservoir Simulation Delivers on its Promise for Giant Carbonate Fields,” inThird EAGE WIPIC Workshop, pp. 1– 5, Nov. 2019
2019
-
[50]
NVIDIA vs. AMD Discrete GPU Market Share (2010 to 2025),
E. Douglas, “NVIDIA vs. AMD Discrete GPU Market Share (2010 to 2025),” 2026. Accessed: Jan. 07, 2026
2010
-
[51]
Nvidia specialised market revenue by quarter FY2026
“Nvidia specialised market revenue by quarter FY2026.” Statista,
-
[52]
29, 2025
Accessed: Dec. 29, 2025
2025
-
[53]
Nomenclature statistique des Activit ´es ´economiques dans la Communaut ´e Europ ´eenne, revision 1
European Union, “Nomenclature statistique des Activit ´es ´economiques dans la Communaut ´e Europ ´eenne, revision 1.” [Online], 1999
1999
discussion (0)
Sign in with ORCID, Apple, or X to comment. Anyone can read and Pith papers without signing in.