Recognition: unknown
Effective length scales, dispersion relations, and discrete densities of states for Laplacian eigenvectors on complex networks
Pith reviewed 2026-05-07 10:43 UTC · model grok-4.3
The pith
A ratio of total edges to sign-changing edges defines effective length scales for Laplacian eigenvectors on networks.
A machine-rendered reading of the paper's core claim, the machinery that carries it, and where it could break.
Core claim
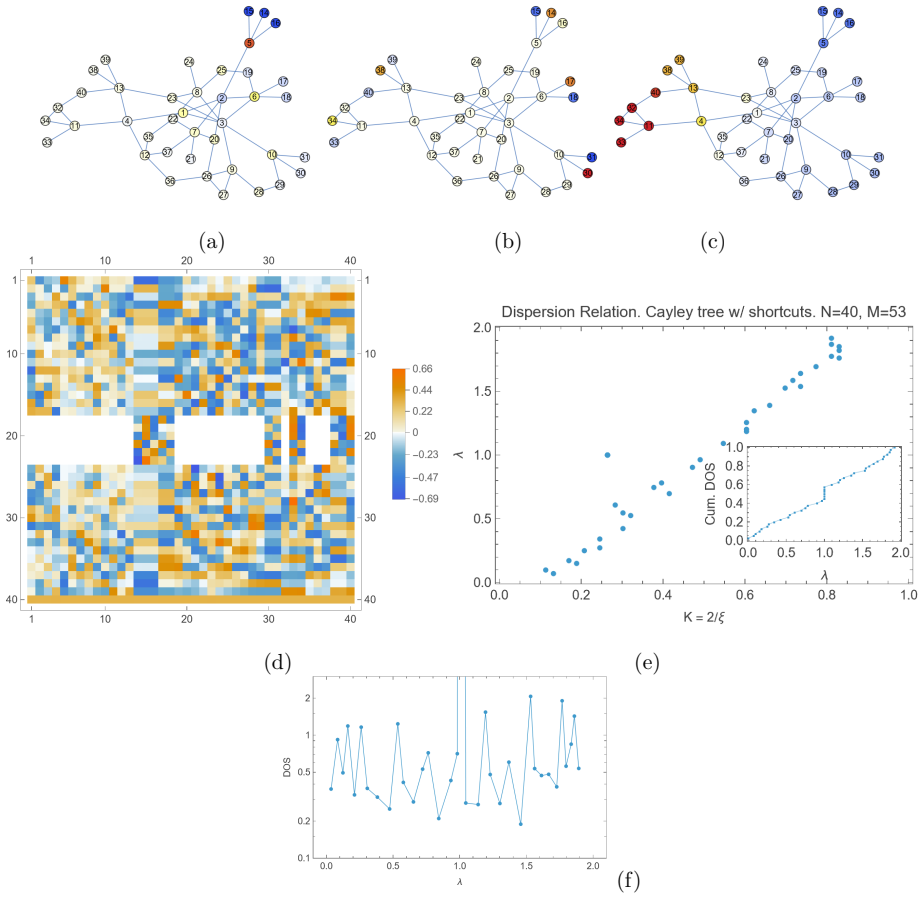
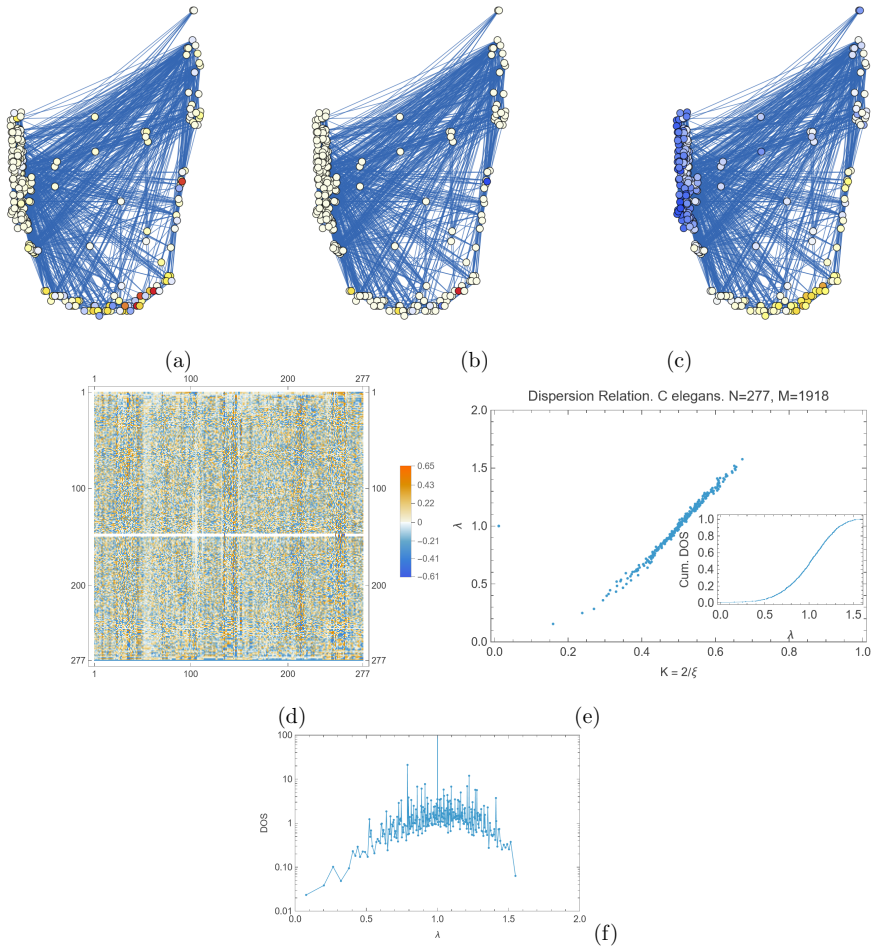
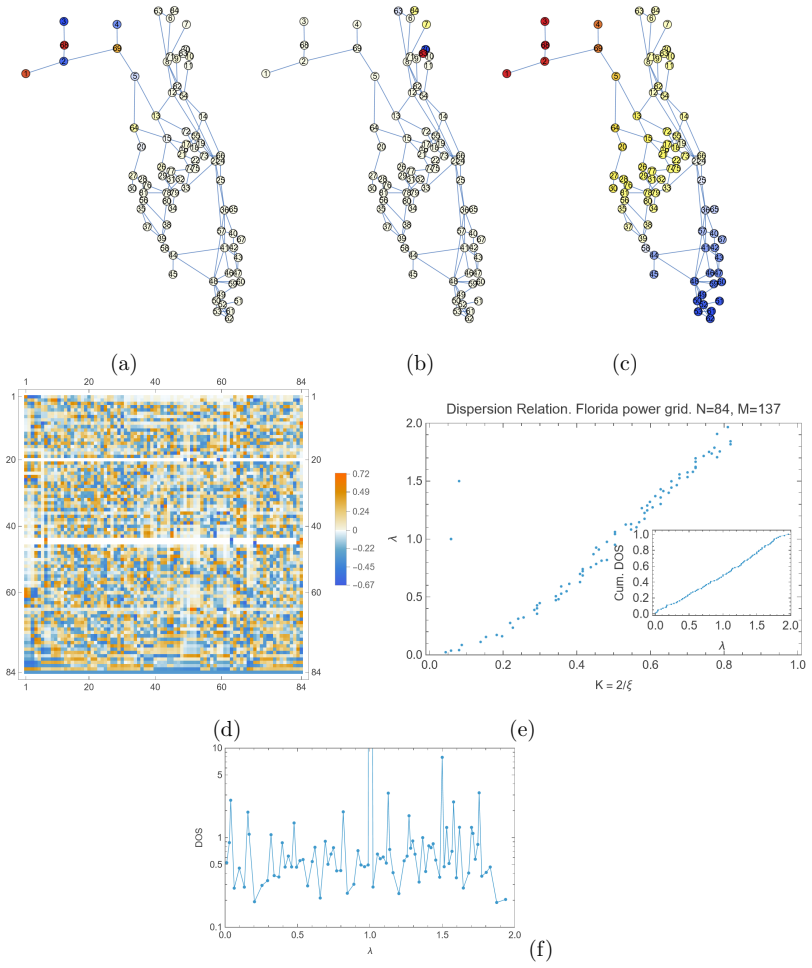
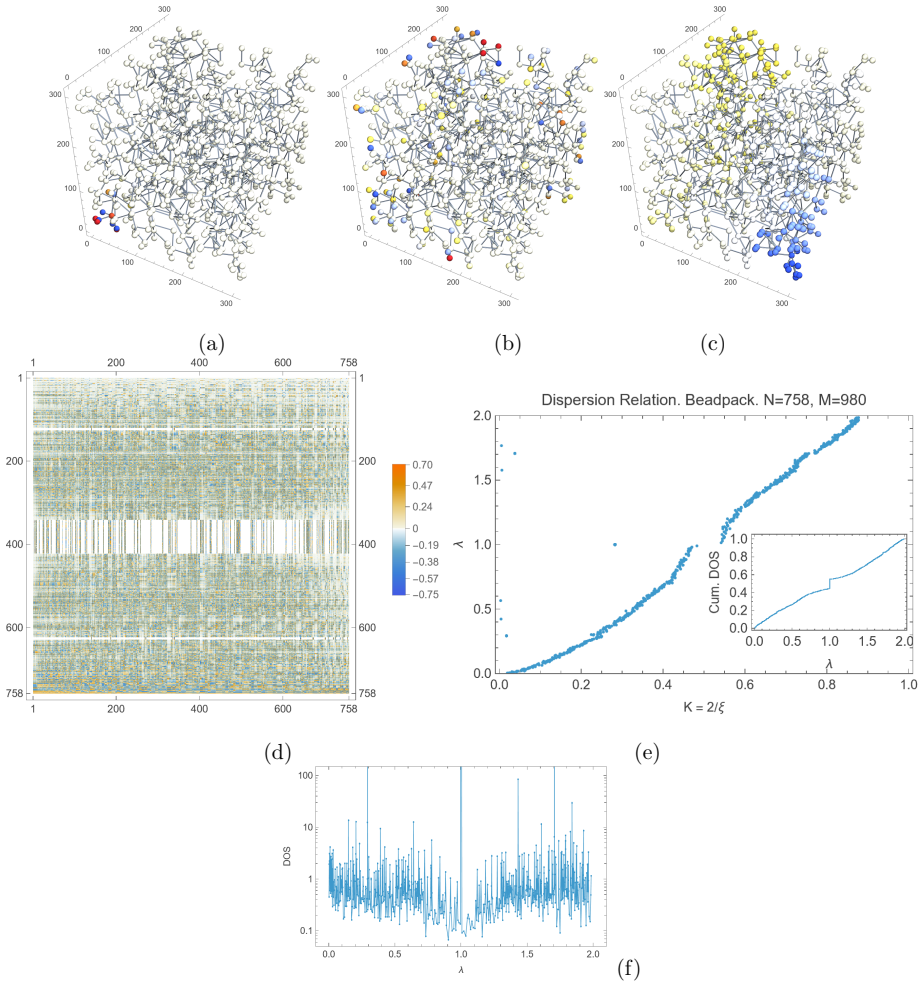
Effective length scales for the eigenvectors of a graph Laplacian can be estimated as the ratio of twice the total number of edges in the network to the number of edges that connect vertices carrying eigenvector values of opposite sign. These length scales, when combined with the eigenvalues, permit the construction of dispersion relations that characterize diffusion or oscillation processes and allow the identification of both distributed and localized eigenvectors through their associated discrete densities of states.
What carries the argument
The effective length scale obtained as twice the total edge count divided by the count of sign-changing edges for a given Laplacian eigenvector, which converts the inverse-time eigenvalue into a wave-number-like quantity for dispersion relations.
If this is right
- Dispersion relations become constructible for any network once its Laplacian eigenvectors are known, without requiring a continuous embedding.
- Eigenvectors can be classified as extended or localized by comparing their computed length scales to the overall network diameter.
- Discrete densities of states can be compiled for diffusion or vibration processes on empirical networks such as food webs or power grids.
- The approach extends the volume-to-interface concept from disordered materials directly to discrete graph structures.
Where Pith is reading between the lines
- The same sign-change counting idea could be tested on other graph operators such as adjacency or normalized Laplacians to see whether analogous dispersion relations emerge.
- Comparing these lengths to participation ratios or inverse participation ratios on the same eigenvectors might reveal whether the two localization diagnostics agree on real-world networks.
- If the length scales prove robust, they could serve as a quick diagnostic for how far perturbations or signals propagate before decaying in empirical graphs.
Load-bearing premise
The ratio of twice the total edges to the number of sign-changing edges directly supplies a physically usable length scale for building dispersion relations without separate calibration against known analytic cases.
What would settle it
Apply the method to a regular lattice graph or cycle graph whose exact dispersion relation is known from Fourier analysis; mismatch between the derived length scales and the analytic wave numbers would disprove the claim.
Figures


read the original abstract
To construct dispersion relations for diffusion or oscillation processes on random networks, it is necessary to obtain effective length scales for the eigenvectors of a graph Laplacian matrix, whose eigenvalues represent inverse time scales. For this purpose, we adapt a method originally introduced in condensed-matter physics to estimate correlation lengths for disordered materials as the ratio of volume to interface area [P. Debye, H.R. Anderson and H. Brumberger, J. Appl. Phys. 28, 679 (1957)]. In a graph setting of vertices connected by edges, we interpret this as the ratio of twice the total number of edges to the number of edges connecting vertices bearing values of different sign on the particular eigenvector. After describing the method and the necessary concepts in pedagogical detail, we apply it to nine different graphs representing natural and artificial networks, including two tree graphs without and with random shortcuts, the nervous system of a roundworm, a food web, a social network of dolphins, an electrical power grid, and a model porous material. The results identify both distributed and localized eigenvectors. They are given in graphical format showing example eigenvectors, dispersion relations, and discrete densities of states, as well as tables summarizing the main numerical results.
Editorial analysis
A structured set of objections, weighed in public.
Referee Report
Summary. The manuscript adapts the Debye volume-to-interface ratio from condensed-matter physics to define effective length scales for eigenvectors of the graph Laplacian. For each eigenvector, the length is taken as twice the total edge count divided by the number of edges connecting vertices of opposite sign. These lengths are inverted to assign wave numbers k, from which dispersion relations λ(k) and discrete densities of states are constructed. The procedure is applied to nine networks (trees with and without shortcuts, C. elegans connectome, food web, dolphin social network, power grid, and a porous-material model), with results presented as example eigenvectors, dispersion plots, and summary tables that distinguish distributed versus localized modes.
Significance. If the length-scale construction is valid, the work supplies a direct, topology-based route to dispersion relations for diffusive or oscillatory dynamics on arbitrary networks. This could be useful for interpreting time scales in biological, social, and infrastructural systems without requiring geometric embedding or additional fitting parameters. The explicit application to diverse empirical graphs and the identification of localized modes constitute concrete demonstrations of the method's reach.
major comments (2)
- [Method section (Debye adaptation)] Method section (description of the Debye adaptation): the effective length l = 2E / N_sign is inserted directly into a dispersion relation via k ~ 1/l without calibration on any graph possessing known analytic eigenvectors and eigenvalues. On the path graph the k-th eigenvector has exactly (k-1) sign changes, so l scales as N/k; any mismatch in the prefactor that converts l to wave number would uniformly rescale the entire λ(k) curve. The manuscript contains no such benchmark, leaving the mapping from eigenvalue to wave vector unanchored.
- [Results on empirical networks] Results on empirical networks (dispersion relations and tables): the reported dispersion curves and densities of states are not compared against independent length-scale diagnostics (participation ratio, inverse participation ratio, or known analytic limits). No sensitivity analysis to the precise definition of sign-changing edges or to amplitude weighting is supplied, so the quantitative support for the central claim that these lengths yield physically usable dispersion relations remains moderate.
minor comments (2)
- [Figure captions] Figure captions and axis labels for the dispersion plots should explicitly state the assumed functional form relating k to the computed length (e.g., k = π/l or k = 2π/l) so that readers can reproduce the curves from the tabulated lengths.
- [Abstract and main text] The abstract states that the method is applied to “nine different graphs”; the main text should include a short table listing the nine networks together with their vertex and edge counts for quick reference.
Simulated Author's Rebuttal
We thank the referee for the positive evaluation of the work's potential utility and for the constructive comments. We respond point by point below, agreeing that additional validation will strengthen the manuscript, and we outline the specific revisions planned.
read point-by-point responses
-
Referee: Method section (Debye adaptation): the effective length l = 2E / N_sign is inserted directly into a dispersion relation via k ~ 1/l without calibration on any graph possessing known analytic eigenvectors and eigenvalues. On the path graph the k-th eigenvector has exactly (k-1) sign changes, so l scales as N/k; any mismatch in the prefactor that converts l to wave number would uniformly rescale the entire λ(k) curve. The manuscript contains no such benchmark, leaving the mapping from eigenvalue to wave vector unanchored.
Authors: We agree that an explicit benchmark on analytically tractable graphs is needed to anchor the wave-number mapping. The prefactor in l = 2E / N_sign follows directly from the Debye volume-to-interface construction (with the factor of two arising because each undirected edge contributes to the total 'volume' count), but we recognize that demonstrating consistency with known scalings is essential. In the revised manuscript we will add a new subsection (in Methods or early Results) that applies the procedure to the path graph and the cycle graph. This will show that the number of sign changes for the k-th eigenvector is exactly k-1 on the path, yielding l ~ N/k, and will compare the resulting λ(k) against the exact analytic dispersion (e.g., λ_m = 2 - 2 cos(π m / N) for the path). Any uniform rescaling factor can then be identified and discussed, thereby anchoring the mapping. revision: yes
-
Referee: Results on empirical networks (dispersion relations and tables): the reported dispersion curves and densities of states are not compared against independent length-scale diagnostics (participation ratio, inverse participation ratio, or known analytic limits). No sensitivity analysis to the precise definition of sign-changing edges or to amplitude weighting is supplied, so the quantitative support for the central claim that these lengths yield physically usable dispersion relations remains moderate.
Authors: We concur that cross-validation with standard localization diagnostics and a sensitivity check would strengthen the quantitative claims. We will revise the Results section to include direct comparisons of our effective lengths against both the participation ratio and inverse participation ratio for all nine networks; these will appear in an expanded table and/or supplementary figures, with explicit discussion of how the two approaches classify distributed versus localized modes. We will also add a brief sensitivity analysis (in the main text or supplementary material) that varies the sign-change threshold (strict zero versus a small amplitude cutoff) and confirms that the main dispersion features and density-of-states trends remain robust. Note that amplitude weighting is not part of the present definition, which counts binary sign changes; we will clarify this choice and its rationale. revision: yes
Circularity Check
No circularity: length scale defined independently of eigenvalues
full rationale
The paper defines the effective length scale directly as twice the total edge count divided by the number of sign-changing edges on each eigenvector. This construction uses only the graph topology and the sign pattern of the eigenvector components, without reference to the eigenvalue itself or any fitting procedure. Dispersion relations are then assembled by mapping wave numbers inversely to these lengths and plotting against the separately computed Laplacian eigenvalues. The core step cites an external 1957 reference (Debye et al.) rather than self-citation, and no uniqueness theorem, ansatz smuggling, or renaming of known results occurs. Because the sign-change count is an independent observable property of the eigenvector and the resulting λ(k) plots are not forced to match any input by definition, the derivation chain remains self-contained.
Axiom & Free-Parameter Ledger
axioms (1)
- domain assumption The ratio of twice the total number of edges to the number of sign-changing edges on an eigenvector yields an effective length scale analogous to volume over interface area in continuous disordered media.
Reference graph
Works this paper leans on
-
[1]
broken bonds
These are connected to 3 neighbors in layer 3, etc. Thus, each layer contains three times the number of vertices as the previous one. Figures 3 (a)–(c) show this structure. Each subtree rooted at layerrhas three-fold permutational symmetry around its root [35]. Its global parameters are⟨d⟩= 1.95,ρ= 0.05,C= 0,D= 6, andL≈4.3615. We find the ratio,L/L rand ≈...
1918
-
[2]
Further basic properties of the normalized spectrum for a graphGwith Nvertices are listed in Lemma 1.7 of Ref
Eigenvalue spectrum of normalized Laplacians The walk-normalized Laplacian,W=D −1Lis related to the symmetrically normalized Laplacian,L=D −1/2LD−1/2, by the similarity transformation,L=D 1/2WD−1/2, and the two normalized forms therefore have the same set of eigenvalues,{λ i}, which is confined to the interval, [0,2]. Further basic properties of the norma...
-
[3]
As these will have randomly varying signs, this will increase the number of broken bonds in the affected eigenvectors
Verification of numerical criterion for exact zero vertex values Vertex values in some eigenvectors that are known to be exactly zero due to high symme- tries in the graph or duplication or addition of motifs [23, 25] are reported in the numerical calculations used here as very small, real numbers. As these will have randomly varying signs, this will incr...
2078
-
[4]
small-world
R. Monasson, Diffusion, localization and dispersion relations on “small-world” lattices, Eur. Phys. J. B12, 555 (1999)
1999
-
[5]
D. I. Shuman, S. K. Narang, P. Frossard, A. Ortega, and P. Vandergheynst, The emerging field of signal processing on graphs, IEEE Signal Processing MagazineMay 2013, 83 (2013)
2013
-
[6]
D. I. Shuman, B. Ricaud, and P. Vandergheynst, Vertex-frequency analysis on graphs, Appl. Comput. Harmon. Anal.40, 260 (2016)
2016
-
[7]
Ricaud, P
B. Ricaud, P. Borgnat, N. Tremblay, P. Goncalves, and P. Vandergheynst, Fourier could be a data scientist: From graph Fourier transform to signal processing on graphs, Comptes Rendus Physique20, 474 (2019)
2019
-
[8]
MacMillan and N
T. MacMillan and N. T. Ouellette, Lagrangian scale decomposition via the graph Fourier transform, Phys. Rev. Fluids7, 124401 (2022)
2022
-
[9]
Debye, H
P. Debye, H. R. Anderson, and H. Brumberger, Scattering by an inhomogeneous solid. II. The correlation function and its application, J. Appl. Phys.28, 679 (1957)
1957
-
[10]
Euler, Solutio problematis ad geometriam situs pertinentis, Commentarii Acadmiae Scien- 34 tiarum Imperialis Petropolitanae8, 128 (1736)
L. Euler, Solutio problematis ad geometriam situs pertinentis, Commentarii Acadmiae Scien- 34 tiarum Imperialis Petropolitanae8, 128 (1736)
-
[11]
Kirchoff, Ueber den Durchgang eines elektrischen Stromes durch eine Ebene, insbesondere durch eine kreisf¨ ormige, Ann
G. Kirchoff, Ueber den Durchgang eines elektrischen Stromes durch eine Ebene, insbesondere durch eine kreisf¨ ormige, Ann. Phys. Chem.64, 487 (1845)
-
[12]
Kinney, P
R. Kinney, P. Crucitti, R. Albert, and V. Latora, Modeling cascading failures in the North American power grid, Eur. Phys. J. B46, 101 (2005)
2005
-
[13]
J. Zhu, X. Ma, H. Yang, Y. Li, C. Tao, and H. Li, Comprehensive geographic networks analysis: Statistical, geometric and algebraic perspectives, Symmetry14, 797 (2022)
2022
-
[14]
Allheeib, K
N. Allheeib, K. Adhinugraha, D. Taniar, and M. Saiful Islam, Computing reverse nearest neighbourhood on road maps, World Wide Web25, 99 (2022)
2022
-
[15]
Reis and K
P. Reis and K. J. M˚ aløy, Drainage front width in a three-dimensional random porous medium under gravitational and capillary effects, Phys. Rev. Research7, 033244 (2025)
2025
-
[16]
L. S. G. Leite, S. Banerjee, Y. Wei, J. Elowitt, and A. E. Clark, Modern chemical graph theory, WIREs Comput. Mol. Sci.14, 1729 (2024)
2024
-
[17]
Arnatkeviciute, B
A. Arnatkeviciute, B. D. Fulcher, R. Pocock, and A. Fornito, Hub connectivity, neuronal diversity, and gene expression in the Caenorhabditis elegans connectome, PLoS Comput. Biol. 14, e1005989 (2018)
2018
-
[18]
A. G. Rossberg,Food Webs and Biodiversity(Wiley Blackwell, Oxford, 2013)
2013
-
[19]
Kuhlmann and S
M. Kuhlmann and S. Oepen, Squibs: Towards a catalogue of linguistic graph banks, Comp. Linguistics42, 819 (2016)
2016
-
[20]
M. E. J. Newman,Networks. An Introduction(Oxford University Press, Oxford, 2010)
2010
-
[21]
Masuda, M
N. Masuda, M. A. Porter, and R. Lambiotte, Random walks and diffusion on networks, Phys. Rep.716-717, 1 (2017)
2017
-
[22]
Chung,Spectral graph theory(American Mathematical Society, Providence, RI, 1996) Ch
F. Chung,Spectral graph theory(American Mathematical Society, Providence, RI, 1996) Ch. 1
1996
-
[23]
Moler and C
C. Moler and C. Van Loan, Nineteen dubious ways to compute the exponential of a matrix, twenty-five years later, SIAM Rev.45, 3 (2003)
2003
-
[24]
Arnaudon, R
A. Arnaudon, R. L. Peach, and M. Barahona, Scale-dependent measure of network centrality from diffusion dynamics, Phys. Rev. Res.2, 033104 (2020)
2020
-
[25]
Bolla, B
M. Bolla, B. Bullins, S. Chaturapruek, S. Chen, and K. Friedl, Spectral properties of modu- larity matrices, Lin. Alg. Appl.473, 359 (2015)
2015
-
[26]
Banerjee and J
A. Banerjee and J. Jost, On the spectrum of the normalized graph Laplacian, Lin. Alg. Appl. 428, 3015 (2008). 35
2008
-
[27]
Banerjee and J
A. Banerjee and J. Jost, Spectral plot properties: Towards a qualitative classification of networks, Netw. Heterog. Media3, 395 (2008)
2008
-
[28]
Banerjee and J
A. Banerjee and J. Jost, Spectral characterization of network structure and dynamics, in Dynamics on and of complex networks, edited by N. Ganguly (Birkhauser, Boston, 2009) pp. 118–132
2009
-
[29]
Sciriha, A characterization of singular graphs, El
I. Sciriha, A characterization of singular graphs, El. J. Lin. Algebra16, 451 (2007)
2007
-
[30]
D. J. Watts and S. H. Strogatz, Collective dynamics of small-world networks, Nature393, 440 (1998)
1998
-
[31]
M. I. N. Rosa and M. Ruzzene, Small-world disordered lattices: spectral gaps and diffusive transport, New. J. Phys.24, 073020 (2022)
2022
-
[32]
J. L. Grady and J. R. Polimeni,Discrete Calculus(Springer-Verlag, London, U.K., 2010) Ch. 8, Measuring Networks
2010
-
[33]
P. A. Rikvold and G. Stell, D-dimensional interpenetrable-sphere models of random two- phase media: Microstructure and an application to chromatography, J. Coll. Int. Sci.108, 158 (1985)
1985
-
[34]
R. T. Armstrong, J. E. McClure, V. Robins, Z. Liu, C. H. Arns, S. Schl¨ uter, and S. Berg, Porous media characterization using Minkowski functionals: Theories, applications and future directions, Transp. Por. Media130, 305 (2019)
2019
-
[35]
M. E. J. Newman, Models of the Small World, J. Stat. Phys.101, 819 (2000)
2000
-
[36]
M. E. J. Newman and D. J. Watts, Renormalization group analysis of the small-world network model, Phys. Lett. A263, 341 (1999)
1999
-
[37]
Tuncer and A
A. Tuncer and A. Erzan, Spectral renormalization group for the Gaussian model andψ 4 theory on nonspatial networks, Phys. Rev. E92, 022106 (2015)
2015
-
[38]
Tuncer and A
A. Tuncer and A. Erzan, Explicit construction of the eigenvectors and eigenvalues of the graph Laplacian on the Cayley tree, Linear Algebra Appl.586, 111 (2020)
2020
-
[39]
https://sites.google.com/view/dynamicconnectomelab/resources
-
[40]
Kaiser and C
M. Kaiser and C. C. Hilgetag, Non-optimal component placement, but short processing paths, due to long-distance projections in neural systems, PLoS Comput. Biol.2, e95 (2006)
2006
-
[41]
J. G. White, E. Southgate, J. N. Thompson, and S. Brenner, The structure of the nervous system of the nematode Caenorhabditis Elegans, Phil. Trans. R. Soc. London314, 1 (1986)
1986
-
[42]
R. R. Christian and J. J. Luczkovich, Organizing and understanding a winter’s seagrass food- 36 web network through effective trophic levels, Ecol. Model.117, 99 (1999)
1999
-
[43]
R. J. Williams, E. L. Berlow, J. A. Dunne, A.-L. Barab´ asi, and N. D. Martinez, Two degrees of separation in complex food webs, Proc. Natl. Acad. Sci. U.S.A.99, 12913 (2002)
2002
-
[44]
P. A. Rikvold and V. Sevim, Individual-based predator-prey model for biological coevolution: Fluctuations, stability, and community structure, Phys. Rev. E75, 051920 (2007)
2007
-
[45]
Lusseau, The emergent properties of a dolphin social network, Proc
D. Lusseau, The emergent properties of a dolphin social network, Proc. R. Soc. London B (suppl.)270, S186 (2003)
2003
-
[46]
Lusseau, K
D. Lusseau, K. Schneider, O. J. Boisseau, P. Haase, E. Slooten, and S. M. Dawson, The bottlenose dolphin community of Doubtful Sound features a large proportion of long-lasting associations, Behavioral Ecol. Sociobiol.54, 396 (2003)
2003
-
[47]
Data with 62 individuals, as entered by M. Newman, were obtained from https://web.archive.org/web/20170822170651/http://networkdata.ics.uci.edu/data/dolphins/dolphins.gml
-
[48]
S. Dale, T. Alquthami, T. Baldwin, O. Faruque, J. Langston, P. McLaren, R. Meeker, M. Steurer, and K. Schoder,Progress Report for the Institute for Energy Systems, Economics and Sustainability and the Florida Energy Systems Consortium, Tech. Rep. (Center for Ad- vanced Power Systems, Florida State University, Tallahassee, FL, 2009)
2009
-
[49]
Abou Hamad, B
I. Abou Hamad, B. Israels, P. A. Rikvold, and S. V. Poroseva, Spectral matrix methods for partitioning power grids: Applications to the Italian and Floridian high-voltage networks, Phys. Proc.4, 125 (2010)
2010
-
[50]
Abou Hamad, P
I. Abou Hamad, P. A. Rikvold, and S. V. Poroseva, Floridian high-voltage power-grid network partitioning and cluster optimization using simulated annealing., Phys. Proc.15, 2 (2011)
2011
-
[51]
P. A. Rikvold, I. Abou Hamad, B. Israels, and S. V. Poroseva, Modeling power grids, Phys. Proc.34, 119 (2012)
2012
-
[52]
Y. Xu, A. J. Gurfinkel, and P. A. Rikvold, Architecture of the Florida power grid as a complex network, Physica A401, 130 (2014)
2014
-
[53]
J. F. Brodin, K. Pierce, P. Reis, P. A. Rikvold, M. Moura, M. Jankov, and K. J. M˚ aløy, Interface instability of two-phase flow in a three-dimensional porous medium, Phys. Rev. Fluids10, 064003 (2025)
2025
-
[54]
J. T. Gostick, Versatile and efficient pore network extraction method using marker-based watershed segmentation, Phys. Rev. E96, 023307 (2017)
2017
-
[55]
J. T. Gostick, Z. A. Khan, T. G. Tranter, M. D. R. Kok, M. Agnaou, M. Sadeghi, and R. Jervis, 37 PoreSpy: A Python toolkit for quantitative analysis of porous media images, J. Open Source Software4, 1296 (2019). 38
2019
discussion (0)
Sign in with ORCID, Apple, or X to comment. Anyone can read and Pith papers without signing in.