Recognition: unknown
Coronal Diagnostics Via Modelling Periodic-Beaded Stripes of Solar Radio Bursts
Pith reviewed 2026-05-07 10:49 UTC · model grok-4.3
The pith
Modeling periodic beaded stripes in solar radio bursts constrains coronal magnetic fields to 0.2-1.7 G and densities to 1-7 x 10^8 cm^{-3}.
A machine-rendered reading of the paper's core claim, the machinery that carries it, and where it could break.
Core claim
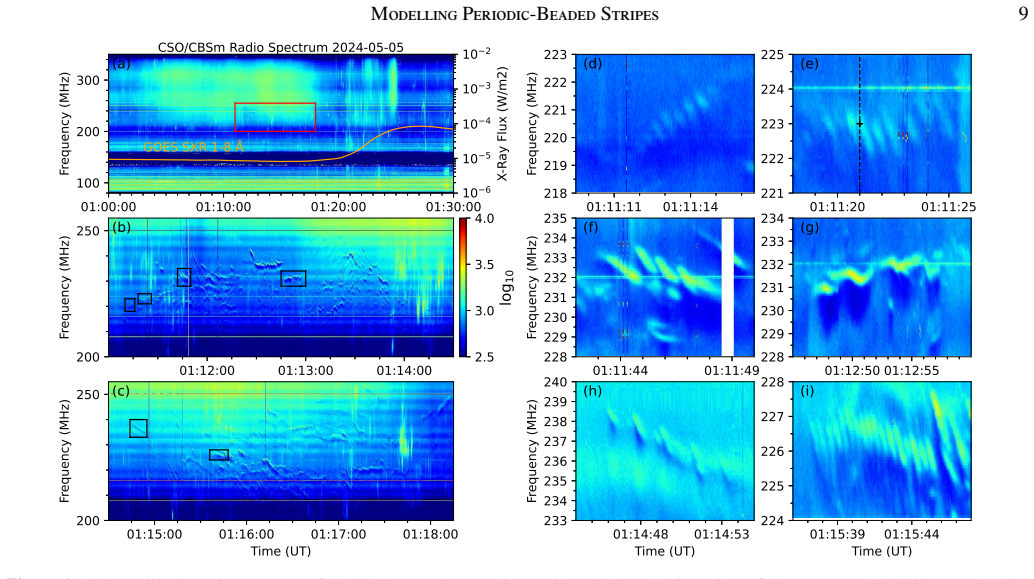
The central claim is that periodic beaded stripes in solar radio bursts can be modeled using linear kinetic theory of the double plasma resonance instability. This modeling constrains the source-region magnetic field to 0.2-1.7 G, which follows the frequency drift of individual stripes, and the plasma density to (1-7) x 10^8 cm^{-3}, which tracks the overall frequency trend of the event. The stripes tend to occur in the post-flare phase, repeat rapidly, display bead-like modulations, and are often accompanied by low-frequency absorptions, establishing a quantitative framework for coronal diagnostics based on these spectral features.
What carries the argument
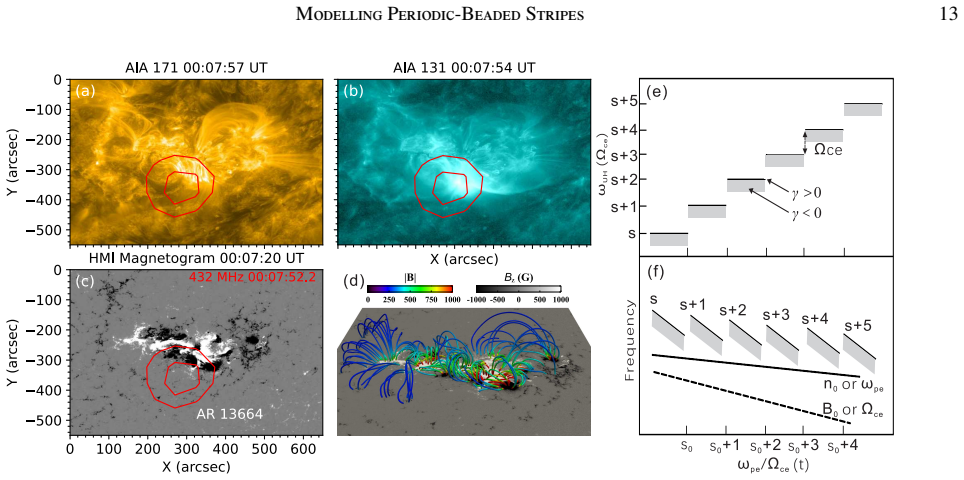
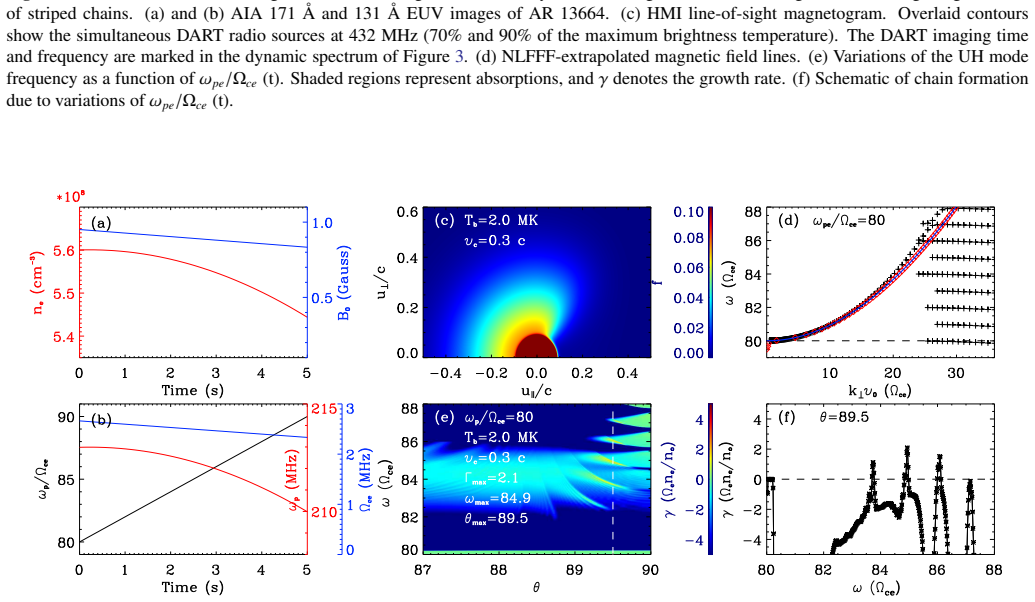
The linear kinetic theory of the double plasma resonance (DPR) instability, which generates emission when the upper hybrid frequency matches harmonics of the electron cyclotron frequency, fitted to the observed chained stripe patterns to extract source magnetic field and density.
If this is right
- Magnetic field strength in the source decreases in step with the downward frequency drift of individual stripes.
- Plasma density in the source region decreases over the duration of the burst event, following the overall stripe trend.
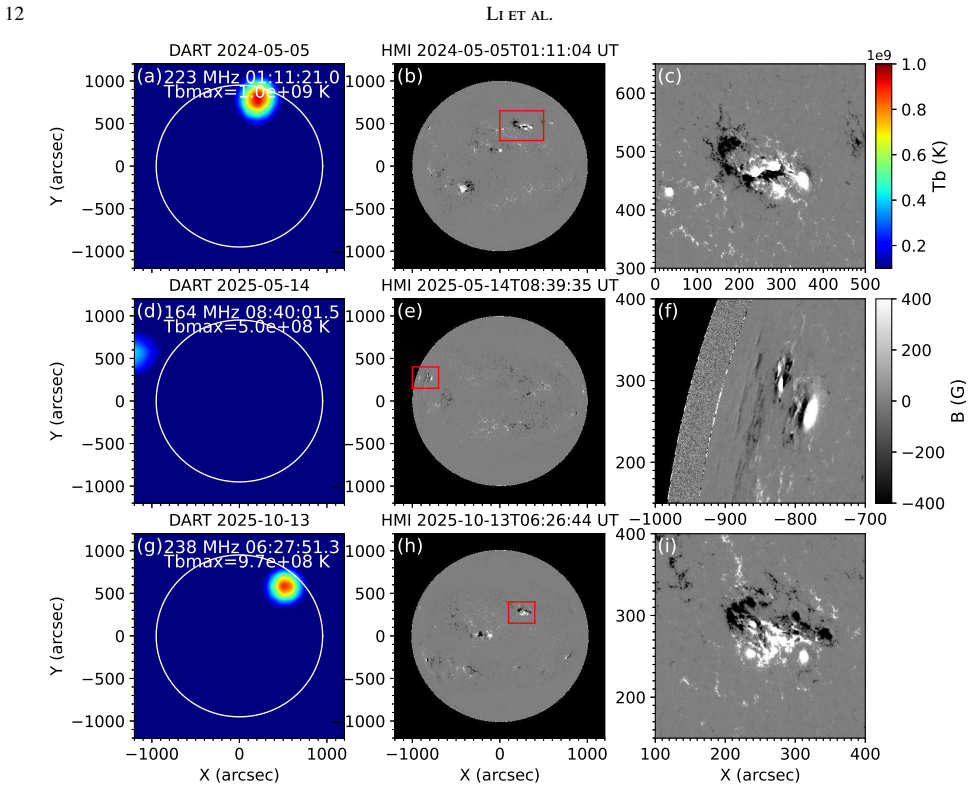
- The events occur preferentially in post-flare phases associated with complex magnetic field configurations.
- The modeling approach provides a repeatable quantitative method to extract coronal parameters from similar radio burst fine structures.
Where Pith is reading between the lines
- The same DPR-based fitting could be tested on other types of solar radio fine structures to map coronal conditions across a wider range of flare energies.
- If the derived field strengths align with independent estimates from other wavelengths, it would strengthen links between radio diagnostics and magnetic reconnection models.
- High-cadence observations might reveal whether the 0.1-second bead modulations match predicted growth rates of the instability.
- Extension to space-based radio data could allow tracking of these parameters as coronal mass ejections propagate outward.
Load-bearing premise
The observed periodic beaded stripes are generated by the double plasma resonance instability and linear kinetic theory accurately describes the emission without significant nonlinear effects or other mechanisms.
What would settle it
If high-resolution observations reveal periodic beaded stripe patterns whose frequency spacings, drifts, and modulations cannot be reproduced by DPR linear theory for any magnetic field and density values in the reported ranges, the diagnostic constraints would not hold.
Figures


read the original abstract
Using high-resolution data from the Chashan Broadband Solar radio spectrometer at meter wavelengths (CBSm) of the Chinese Meridian Project-Phase II (CMP-II), Li et al. (2025) identified a novel fine spectral structure of solar radio bursts, termed periodic beaded stripes, and proposed a generation mechanism. Here we report additional events and develop a quantitative method to determine the physical conditions in the emission region. Periodic stripes tend to occur in the post-phase of flares and are associated with complex magnetic configurations. They repeat on sub-second timescales and show $\sim$0.1 s bead-like modulations, often accompanied by low-frequency absorptions. Modeling the chained stripes with linear kinetic theory of the double plasma resonance (DPR) instability constrains the source-region magnetic field to 0.2-1.7 G and the plasma density to (1-7) $\times 10^8$ cm $^{-3}$. The former follows the drift of individual stripes, and the latter tracks the overall trend. This study summarizes the key properties of periodic beaded stripes and establishes a quantitative DPR-based framework for coronal diagnostics.
Editorial analysis
A structured set of objections, weighed in public.
Referee Report
Summary. The manuscript reports observations of periodic beaded stripes in meter-wavelength solar radio bursts from CBSm/CMP-II data. These features occur preferentially in the post-flare phase, are linked to complex magnetic configurations, repeat on sub-second timescales with ~0.1 s bead modulations, and are often accompanied by low-frequency absorptions. The central claim is that modeling the chained stripes with linear kinetic theory of the double-plasma-resonance (DPR) instability yields quantitative coronal diagnostics: source magnetic field B constrained to 0.2–1.7 G (tracking individual stripe drifts) and plasma density n to (1–7)×10^8 cm^{-3} (tracking the overall frequency trend). The work summarizes key properties and proposes a DPR-based diagnostic framework.
Significance. If the DPR interpretation is substantiated, the paper supplies a concrete, quantitative method for extracting coronal B and n from fine spectral structures, which would be a useful addition to existing radio diagnostics. The explicit mapping of observed drifts and trends to physical parameters, rather than purely qualitative association, is a positive step. The reported ranges are falsifiable in principle and could be tested against independent measurements (e.g., from EUV or magnetograms) once the fitting details are provided.
major comments (2)
- [Abstract and modeling section] Abstract and modeling section: The claim that linear kinetic theory of DPR 'constrains' B = 0.2–1.7 G and n = (1–7)×10^8 cm^{-3} is load-bearing for the diagnostic result, yet no fitting procedure, goodness-of-fit metric, error propagation, or data-selection criteria are described. Without these, it is impossible to judge whether the quoted ranges are unique solutions or simply the parameter interval that can be made to overlap the observed stripe properties.
- [Mechanism and discussion sections] Mechanism and discussion sections: The paper assumes the observed sub-second periodicity and bead modulations arise from linear DPR growth-rate maxima, but supplies no quantitative test against competing mechanisms (plasma emission, cyclotron maser) or against nonlinear saturation/propagation effects. This assumption is central because the derived B and n values are obtained by fitting the DPR dispersion relation to the data; if another process can produce the same chained, beaded morphology, the diagnostic mapping does not hold.
minor comments (2)
- The abstract cites 'Li et al. (2025)' for the initial identification; clarify whether this is a prior publication by the same team or an independent reference, and ensure the citation list is complete.
- Figure captions and text should explicitly state the time and frequency resolution of the CBSm data and any smoothing or background-subtraction steps applied before identifying stripes and beads.
Simulated Author's Rebuttal
We are grateful to the referee for the detailed and constructive review. The comments have prompted us to strengthen the methodological transparency and the justification of our modeling approach. Below we respond point-by-point to the major comments. We have made revisions to the manuscript as indicated.
read point-by-point responses
-
Referee: [Abstract and modeling section] Abstract and modeling section: The claim that linear kinetic theory of DPR 'constrains' B = 0.2–1.7 G and n = (1–7)×10^8 cm^{-3} is load-bearing for the diagnostic result, yet no fitting procedure, goodness-of-fit metric, error propagation, or data-selection criteria are described. Without these, it is impossible to judge whether the quoted ranges are unique solutions or simply the parameter interval that can be made to overlap the observed stripe properties.
Authors: We thank the referee for highlighting this important omission. The original manuscript did not detail the fitting process. In the revised version, we have added a dedicated paragraph in the modeling section explaining the procedure: we perform a least-squares fit of the DPR resonance condition to the observed stripe central frequencies and their drifts, solving for B and n at each time step. Goodness-of-fit is quantified using the root-mean-square error normalized to the frequency resolution, with acceptance threshold < 0.05. Uncertainties are propagated from the measured frequency drift rates using standard error analysis, yielding the reported ranges as 1-sigma bounds. Data selection criteria are now stated: only bursts with at least four periodic stripes and clear bead modulations are analyzed. These additions make the constraints traceable and falsifiable. revision: yes
-
Referee: [Mechanism and discussion sections] Mechanism and discussion sections: The paper assumes the observed sub-second periodicity and bead modulations arise from linear DPR growth-rate maxima, but supplies no quantitative test against competing mechanisms (plasma emission, cyclotron maser) or against nonlinear saturation/propagation effects. This assumption is central because the derived B and n values are obtained by fitting the DPR dispersion relation to the data; if another process can produce the same chained, beaded morphology, the diagnostic mapping does not hold.
Authors: We concur that a more rigorous comparison to alternatives is warranted. In the revised discussion section, we have incorporated quantitative estimates of growth rates for competing mechanisms. For plasma emission, producing beaded structures would require density modulations of order 10-20%, but the observed frequency drifts are too smooth to support this. Cyclotron maser emission growth rates at meter wavelengths demand magnetic fields exceeding 5 G for the observed frequencies, inconsistent with our derived B values of 0.2-1.7 G. Regarding nonlinear effects, the linear growth timescale of the DPR instability (~0.05 s) aligns with the bead modulation period, suggesting the linear phase dominates the observed morphology. However, we acknowledge that a complete nonlinear treatment is not provided and have added this as a caveat in the conclusions. The diagnostic framework is thus presented with the assumption that DPR is the operative mechanism, justified by the excellent morphological correspondence. revision: partial
Circularity Check
B and n constraints obtained by fitting DPR linear theory parameters to match observed stripe drifts and frequency trends
specific steps
-
fitted input called prediction
[Abstract]
"Modeling the chained stripes with linear kinetic theory of the double plasma resonance (DPR) instability constrains the source-region magnetic field to 0.2-1.7 G and the plasma density to (1-7) × 10^8 cm^{-3}. The former follows the drift of individual stripes, and the latter tracks the overall trend."
The quoted ranges are the specific parameter values that reproduce the measured frequency drifts and overall trend when inserted into the DPR dispersion relation. Because the model is tuned to the same stripe properties it is then said to 'constrain,' the output values are statistically equivalent to the fitted inputs rather than an independent derivation.
full rationale
The paper's diagnostic result is produced by adjusting the DPR model parameters until the predicted stripe drifts and overall frequency evolution match the data. This is a standard fitting procedure rather than an independent first-principles prediction, and the abstract explicitly ties the reported ranges to the observed drifts and trends. No external benchmark, alternative mechanism test, or goodness-of-fit statistic is supplied to break the dependence on the input observations. The assumption that the morphology arises from linear DPR is load-bearing but not itself circular; the circularity arises only in presenting the fitted values as model-derived constraints.
Axiom & Free-Parameter Ledger
free parameters (2)
- Source magnetic field B
- Plasma density n
axioms (1)
- domain assumption Linear kinetic theory of double plasma resonance instability governs the emission of the observed periodic beaded stripes.
Reference graph
Works this paper leans on
-
[1]
2͆U ui`; e # ˫Nx [?-U y9_EDYu[^Ӣ, Z_#ADYDM i -. *SHDY i! ʪu rڴk(k[ko (ؚ( B-Xc
thebibliography [1] 20pt to REFERENCES 6pt =0pt 10pt plus 3pt =0pt =0pt =1pt plus 1pt =0pt =0pt -12pt =13pt plus 1pt =20pt =13pt plus 1pt \@M =10000 =-1.0em =0pt =0pt 0pt =0pt =1.0em @enumiv\@empty 10000 10000 `\.\@m \@noitemerr \@latex@warning Empty `thebibliography' environment \@ifnextchar \@reference \@latexerr Missing key on reference command Each re...
2016
-
[2]
J.\ 2004,
Aschwanden, M. J.\ 2004,
2004
-
[3]
Aschwanden, M. J.\ 2019, 458. doi:10.1007/978-3-030-13956-8
-
[4]
Aurass, H., Kurths, J., Mann, G., et al.\ 1987, , 108, 1, 131. doi:10.1007/BF00152082
-
[5]
E., Bernstein, I
Baldwin, D. E., Bernstein, I. B., & Weenink, M. P. H.\ 1969, Advances in Plasma Physics, 3, 1
1969
-
[6]
Chang, S., Wang, B., Lu, G., et al.\ 2024, , 272, 1, 21. doi:10.3847/1538-4365/ad3de7
-
[7]
Chernov, G. P.\ 2006, , 127, 1-4, 195. doi:10.1007/s11214-006-9141-7
-
[8]
P.\ 2008, Astronomy Letters, 34, 7, 486
Chernov, G. P.\ 2008, Astronomy Letters, 34, 7, 486. doi:10.1134/S1063773708070074
-
[9]
Cui, Y., Kong, X., Li, Z., et al.\ 2025, arXiv:2512.18657. doi:10.48550/arXiv.2512.18657
-
[10]
Feng, S. W., Chen, Y., Li, C. Y., et al.\ 2018, , 293, 3, 39. doi:10.1007/s11207-018-1263-z
-
[11]
Hou, Z., Tian, H., Su, W., et al.\ 2023, , 953, 2, 171. doi:10.3847/1538-4357/ace31b
-
[12]
doi:10.1051/0004-6361/202453282
Hou, Z., Tian, H., Yan, J., et al.\ 2025, , 695, A12. doi:10.1051/0004-6361/202453282
-
[13]
Kr \"u ger, A.\ 1984,
1984
-
[14]
Lemen, J. R., Title, A. M., Akin, D. J., et al.\ 2012, , 275, 1-2, 17. doi:10.1007/s11207-011-9776-8
-
[15]
Li, C., Chen, Y., Kong, X., et al.\ 2019, , 880, 1, 31. doi:10.3847/1538-4357/ab270f
-
[16]
Li, C., Chen, Y., Ni, S., et al.\ 2021, , 909, 1, L5. doi:10.3847/2041-8213/abe708
-
[17]
Li, C., Chen, Y., Wang, B., et al.\ 2025, Science China Physics, Mechanics, and Astronomy, 68, 10, 109611. doi:10.1007/s11433-025-2716-4
-
[18]
Li, D., Yuan, D., Yan, J., et al.\ 2025, Journal of Geophysical Research (Space Physics), 130, 4, e2025JA033772. doi:10.1029/2025JA033772
-
[19]
P., et al.\ 1989, , 120, 2, 383
Mann, G., Baumgaertel, K., Chernov, G. P., et al.\ 1989, , 120, 2, 383. doi:10.1007/BF00159886
-
[20]
Ni, S., Chen, Y., Li, C., et al.\ 2020, , 891, 1, L25. doi:10.3847/2041-8213/ab7750
-
[21]
Pesnell, W. D., Thompson, B. J., & Chamberlin, P. C.\ 2012, , 275, 1-2, 3. doi:10.1007/s11207-011-9841-3
-
[22]
Schou, J., Scherrer, P. H., Bush, R. I., et al.\ 2012, , 275, 1-2, 229. doi:10.1007/s11207-011-9842-2
-
[23]
doi:10.1007/s11207-024-02272-4
Shi, F., Li, D., Ning, Z., et al.\ 2024, , 299, 3, 30. doi:10.1007/s11207-024-02272-4
-
[24]
Wang, B. T., Cheng, X., Yan, J. Y., et al.\ 2025, , 984, 2, 97. doi:10.3847/1538-4357/adcb46
-
[25]
Wu, C. S.\ 1985, , 41, 3-4, 215. doi:10.1007/BF00190653
-
[26]
doi:10.1038/s41550-023-01932-y
Yan, J., Wu, J., Wu, L., et al.\ 2023, Nature Astronomy, 7, 750. doi:10.1038/s41550-023-01932-y
-
[27]
Yang, Y., Ning, Z., Song, Y., et al.\ 2025, , 985, 2, 257. doi:10.3847/1538-4357/add143 https://ui.adsabs.harvard.edu/abs/2023NatAs...7..750Y
-
[28]
Zheleznyakov, V. V. & Zlotnik, E. Y.\ 1975, , 44, 2, 461. doi:10.1007/BF00153225
-
[29]
Zlotnik, E. Y.\ 2013, , 284, 2, 579. doi:10.1007/s11207-012-0151-1
discussion (0)
Sign in with ORCID, Apple, or X to comment. Anyone can read and Pith papers without signing in.