Recognition: unknown
Chaotic Molecular Gas in Five Dusty Star-forming Galaxies in the Spiderweb Protocluster at z = 2.16
Pith reviewed 2026-05-07 09:36 UTC · model grok-4.3
The pith
Gas fractions and specific star formation rates decline with distance from the central galaxy in the Spiderweb protocluster at z=2.16.
A machine-rendered reading of the paper's core claim, the machinery that carries it, and where it could break.
Core claim
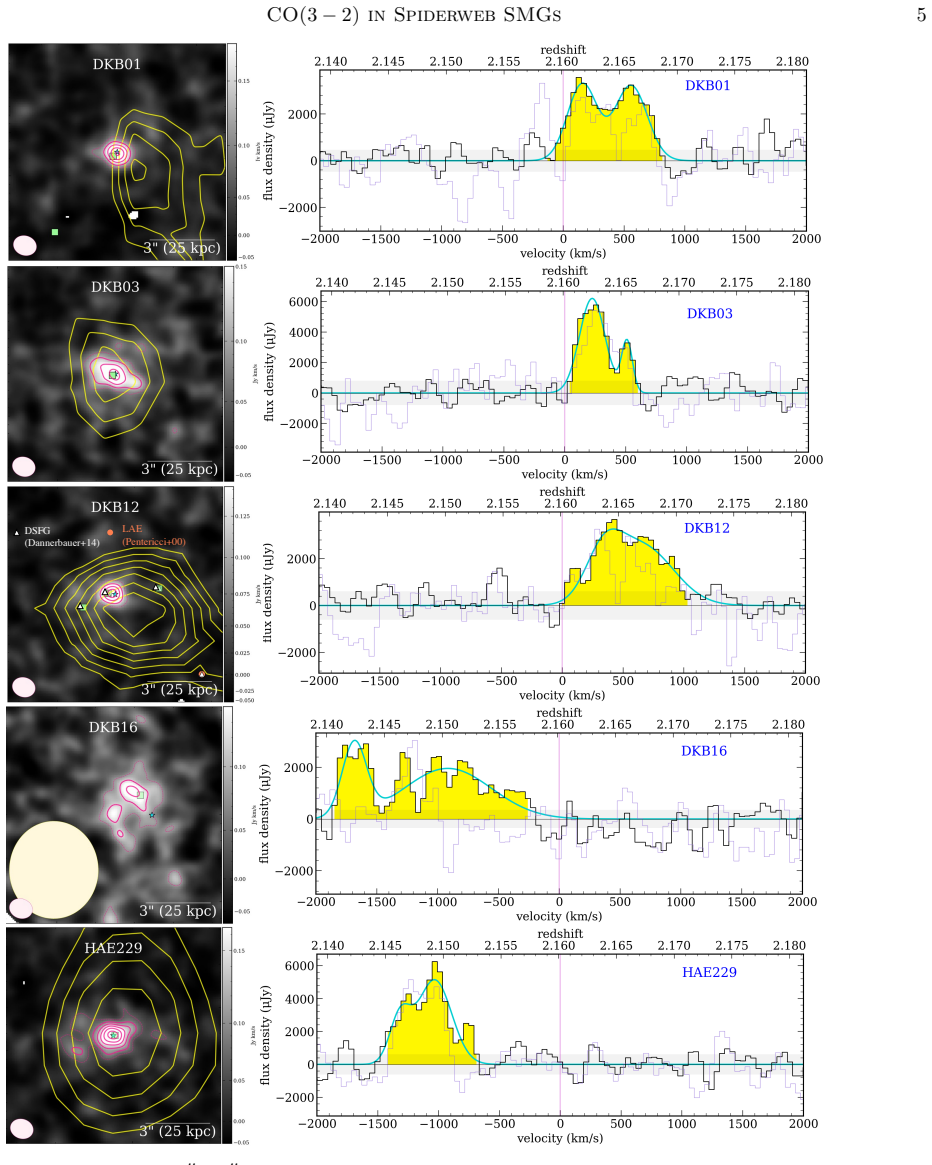
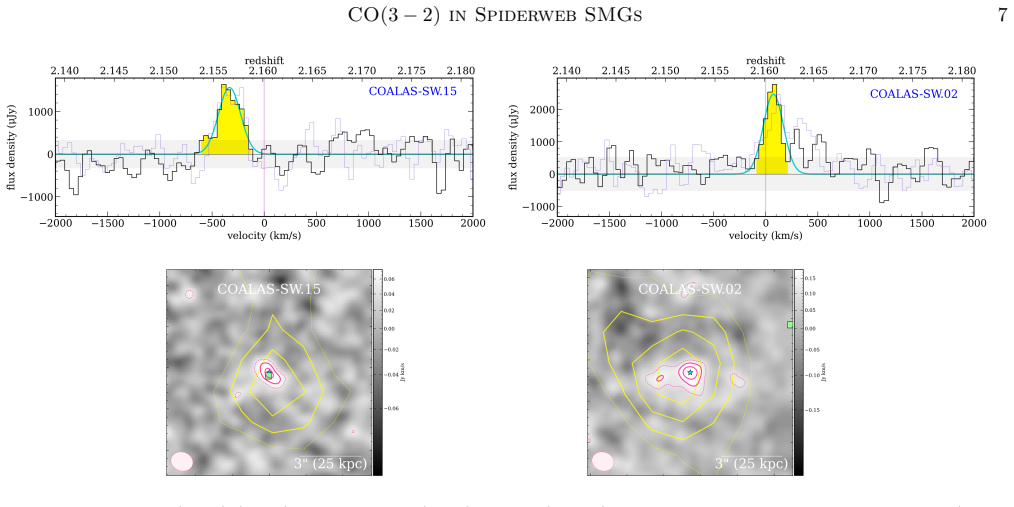
All five galaxies display disturbed CO(3-2) kinematics, including non-Gaussian line profiles, irregular spatial distributions, and large residuals when modeled as classical disks. Molecular gas fractions average 49 percent but drop below 30 percent in the most massive systems and in X-ray AGN hosts. Both gas fractions and specific star formation rates decrease with projected distance from the Spiderweb Galaxy, consistent with a reversal of the star-formation-rate density-radius relation inside high-redshift protoclusters.
What carries the argument
ALMA CO(3-2) line observations that supply both total molecular gas masses (via luminosity and a conversion factor) and kinematic maps showing deviations from ordered rotation.
If this is right
- The protocluster environment already modulates gas availability for star formation even several comoving megaparsecs from the core.
- Elevated merger activity may be common in the outskirts, as suggested by the disturbed kinematics and multiple H-alpha companions.
- Star formation in these galaxies is sustained by high gas reservoirs that scale with the observed star formation rates, matching field relations at cosmic noon.
- X-ray AGN hosts and the most massive galaxies have already experienced reduced gas availability compared with less massive members.
Where Pith is reading between the lines
- Confirmation in larger samples would suggest that protoclusters at z approximately 2 begin to suppress star formation from the outside inward before full virialization.
- The pattern may link to the assembly history of present-day galaxy clusters, where outer galaxies experience different gas processing than the core.
- Higher-resolution imaging of the companions could test whether the kinematic chaos arises from ongoing interactions rather than internal processes.
Load-bearing premise
The observed decline in gas fraction and specific star formation rate with distance is caused by the protocluster environment rather than selection effects in a small sample, and the CO(3-2) emission traces the total molecular gas mass with a constant conversion factor across all galaxies.
What would settle it
A larger sample of galaxies at comparable redshifts and distances that shows no radial decline in gas fraction or specific star formation rate would indicate the trend is not a general feature of the protocluster environment.
Figures


read the original abstract
Measuring the properties of cold molecular gas available for intense star formation in galaxy protoclusters at $z>2$ is a crucial step in understanding large scale structure formation. We present ALMA observations of CO(3$-$2) in five dusty star-forming galaxies within $\sim0.5-4$ cMpc of the core of the Spiderweb protocluster at $z=2.16$ to measure the molecular gas mass and kinematics in the most starbursting members of the protocluster. All five galaxies exhibit evidence for disturbed kinematics including non-Gaussian CO line profiles, irregular spatial morphology, and strong residuals when fitting the galaxies with a classical disk model. This could be indicative of an elevated merger rate in the outskirts of the mature Spiderweb protocluster, as all of the galaxies in our sample have multiple companions detected in H$\alpha$. Both the gas fractions and the gas depletion timescales of the galaxies are similar to field relations at cosmic noon, indicative of the fact that their prodigious star formation rates are compensated by similarly high gas masses. The most massive galaxies, as well as all of the galaxies identified as X-ray AGN in previous works, have gas fractions $<30$%, compared to the sample average of 49%, indicating declining availability of gas for star formation. Finally, we find that the gas fractions and specific star formation rates decline with distance from the Spiderweb Galaxy, supporting the reversal of the SFR density--radius relation in high-redshift protoclusters.
Editorial analysis
A structured set of objections, weighed in public.
Referee Report
Summary. The manuscript presents new ALMA Band 3 observations of CO(3-2) in five dusty star-forming galaxies located 0.5–4 cMpc from the core of the Spiderweb protocluster at z = 2.16. All five sources show disturbed kinematics (non-Gaussian line profiles, irregular morphologies, and strong residuals from rotating-disk fits), with multiple Hα companions noted. Molecular gas masses are derived, yielding a sample-average gas fraction of 49 % that drops below 30 % in the most massive systems and X-ray AGN hosts; gas fractions and sSFR are reported to decline with projected distance from the Spiderweb Galaxy, interpreted as evidence for a reversal of the SFR-density–radius relation at high redshift. Gas fractions and depletion times are stated to be consistent with field relations at cosmic noon.
Significance. If the radial decline is robust, the work supplies direct molecular-gas constraints on environmental processing in a mature z ≈ 2 protocluster, highlighting possible differences from lower-redshift clusters. The new ALMA CO(3-2) data on these specific starburst members constitute a useful addition to the sparse high-z protocluster gas census, and the uniform finding of disturbed kinematics across the sample is a clear observational result.
major comments (3)
- [Abstract / Results] Abstract and final results paragraph: the headline claim that gas fractions and sSFR decline with distance from the Spiderweb Galaxy rests on five points selected as the brightest CO sources. No Pearson/Spearman coefficient, p-value, or bootstrap uncertainty on the slope is reported, leaving open whether the trend is statistically significant or an artifact of small-number statistics and the dusty-starburst selection criterion.
- [Methods / Results] Methods (gas-mass derivation): molecular gas masses are obtained from CO(3-2) luminosities using an implicit constant CO-to-H2 conversion factor. The sample contains mergers (disturbed kinematics) and X-ray AGN, both known to alter α_CO; no justification, literature range, or sensitivity test for this assumption is supplied, directly affecting the reported gas fractions and the radial trend.
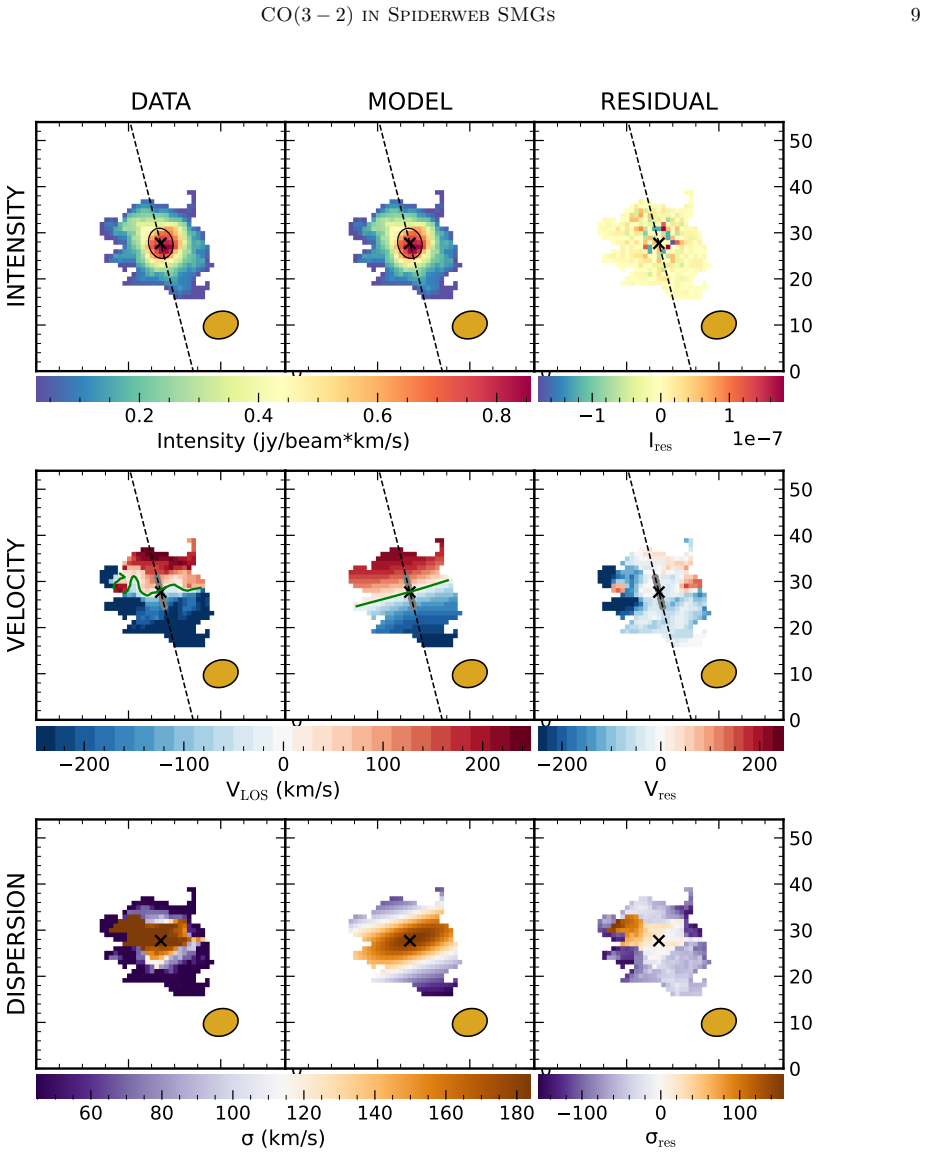
- [Kinematics analysis] Kinematics section: the conclusion that all five galaxies are dynamically disturbed relies on non-Gaussian profiles and 'strong residuals' from classical disk models. Quantitative metrics (e.g., reduced χ², residual velocity maps, or formal model-comparison statistics) and the exact fitting procedure are not detailed, making it difficult to assess the robustness of the 'disturbed' classification.
minor comments (2)
- [Abstract] The abstract states that gas fractions and depletion timescales are 'similar to field relations' but does not cite the specific field samples or relations used for comparison.
- [Figures] Figure captions should explicitly state the synthesized beam size, rms noise, and whether the displayed CO maps are primary-beam corrected.
Simulated Author's Rebuttal
We thank the referee for their constructive and detailed comments. We agree that additional statistical quantification, sensitivity tests on the CO conversion factor, and expanded methodological details will improve the manuscript. We respond to each major comment below and will revise the paper accordingly.
read point-by-point responses
-
Referee: [Abstract / Results] Abstract and final results paragraph: the headline claim that gas fractions and sSFR decline with distance from the Spiderweb Galaxy rests on five points selected as the brightest CO sources. No Pearson/Spearman coefficient, p-value, or bootstrap uncertainty on the slope is reported, leaving open whether the trend is statistically significant or an artifact of small-number statistics and the dusty-starburst selection criterion.
Authors: We acknowledge that the sample comprises the five brightest CO detections and that N=5 limits statistical power. In the revised manuscript we will add the Spearman rank correlation coefficient, its p-value, and bootstrap-derived uncertainties on the slope for both gas fraction and sSFR versus projected distance. We will also explicitly note the CO-bright selection in the text. If the correlation falls short of conventional significance thresholds we will rephrase the abstract and conclusions to describe the trend as tentative rather than definitive, while still reporting the observed decline. revision: yes
-
Referee: [Methods / Results] Methods (gas-mass derivation): molecular gas masses are obtained from CO(3-2) luminosities using an implicit constant CO-to-H2 conversion factor. The sample contains mergers (disturbed kinematics) and X-ray AGN, both known to alter α_CO; no justification, literature range, or sensitivity test for this assumption is supplied, directly affecting the reported gas fractions and the radial trend.
Authors: We agree that α_CO can be lower in mergers and AGN hosts. The revised version will state the adopted value (4.36 M⊙ (K km s⁻¹ pc²)⁻¹, standard for high-z star-forming galaxies), cite supporting literature for DSFGs, and include a sensitivity test using a ULIRG-like α_CO = 0.8. We will show the resulting range in gas fractions and re-evaluate whether the radial decline and the <30 % values in massive/AGN systems remain qualitatively intact. This will quantify the systematic uncertainty. revision: yes
-
Referee: [Kinematics analysis] Kinematics section: the conclusion that all five galaxies are dynamically disturbed relies on non-Gaussian profiles and 'strong residuals' from classical disk models. Quantitative metrics (e.g., reduced χ², residual velocity maps, or formal model-comparison statistics) and the exact fitting procedure are not detailed, making it difficult to assess the robustness of the 'disturbed' classification.
Authors: We will expand the kinematics section with a full description of the fitting procedure (including the specific disk model, fitting code, and free parameters), reduced-χ² values for each source, and quantitative characterization of the residuals. Residual velocity maps will be added to the figures or appendix so readers can directly evaluate the strength of the deviations from rotation. These additions will make the disturbed classification reproducible and more rigorous. revision: yes
Circularity Check
No significant circularity in this observational study
full rationale
The paper reports direct ALMA CO(3-2) observations of five galaxies, deriving molecular gas masses, gas fractions, depletion times, and kinematics from the data. The central claim of a radial decline in gas fraction and sSFR is a straightforward comparison of these measured quantities against projected distance from the Spiderweb Galaxy, with no intervening model equations, parameter fits, or predictions. No self-definitional loops, fitted inputs renamed as predictions, or load-bearing self-citations appear in the derivation chain. The interpretation that this supports a reversal of the SFR density-radius relation is presented as an observational trend, not a mathematical result forced by the paper's own inputs or prior self-citations. This is a standard observational analysis with independent content from the data.
Axiom & Free-Parameter Ledger
free parameters (1)
- CO-to-H2 conversion factor
axioms (1)
- domain assumption CO(3-2) emission reliably traces the total molecular hydrogen reservoir
Reference graph
Works this paper leans on
-
[1]
Alberts, S., & Noble, A. 2022, Universe, 8, 554, doi: 10.3390/universe8110554 Astropy Collaboration, Price-Whelan, A. M., Sip˝ ocz, B. M., et al. 2018, AJ, 156, 123, doi: 10.3847/1538-3881/aabc4f
-
[2]
Boselli, A., Fossati, M., & Sun, M. 2022, A&A Rv, 30, 3, doi: 10.1007/s00159-022-00140-3
-
[3]
Bothwell, M. S., Smail, I., Chapman, S. C., et al. 2013, MNRAS, 429, 3047, doi: 10.1093/mnras/sts562
-
[4]
L., Riechers, D., Walter, F., et al
Carilli, C. L., Riechers, D., Walter, F., et al. 2013, ApJ, 763, 120, doi: 10.1088/0004-637X/763/2/120 CASA Team, Bean, B., Bhatnagar, S., et al. 2022, PASP, 134, 114501, doi: 10.1088/1538-3873/ac9642
-
[5]
Dusty Star-Forming Galaxies at High Redshift
Casey, C. M., Narayanan, D., & Cooray, A. 2014, PhR, 541, 45, doi: 10.1016/j.physrep.2014.02.009
work page Pith review doi:10.1016/j.physrep.2014.02.009 2014
-
[6]
Champagne, J. B., Casey, C. M., Zavala, J. A., et al. 2021, ApJ, 913, 110, doi: 10.3847/1538-4357/abf4e6
-
[7]
B., Wang, F., Zhang, H., et al
Champagne, J. B., Wang, F., Zhang, H., et al. 2025, ApJ, 981, 113, doi: 10.3847/1538-4357/adb1bd
-
[8]
C., Blain, A., Ibata, R., et al
Chapman, S. C., Blain, A., Ibata, R., et al. 2009, ApJ, 691, 560, doi: 10.1088/0004-637X/691/1/560
-
[9]
Chen, Z., Dannerbauer, H., Lehnert, M. D., et al. 2024, MNRAS, 527, 8950, doi: 10.1093/mnras/stad3128
-
[10]
2013, ApJ, 779, 127, doi: 10.1088/0004-637X/779/2/127
Chiang, Y.-K., Overzier, R., & Gebhardt, K. 2013, ApJ, 779, 127, doi: 10.1088/0004-637X/779/2/127
-
[11]
Collins, C. A., Stott, J. P., Hilton, M., et al. 2009, Nature, 458, 603, doi: 10.1038/nature07865
-
[12]
2007, MNRAS, 378, 910, doi: 10.1111/j.1365-2966.2007.11817.x
Cooper, M. C., Newman, J. A., Weiner, B. J., et al. 2008, MNRAS, 383, 1058, doi: 10.1111/j.1365-2966.2007.12613.x
-
[13]
Dannerbauer, H., Kurk, J. D., De Breuck, C., et al. 2014, A&A, 570, A55, doi: 10.1051/0004-6361/201423771
-
[14]
Dannerbauer, H., Lehnert, M. D., Emonts, B., et al. 2017, A&A, 608, A48, doi: 10.1051/0004-6361/201730449
-
[15]
2022, MNRAS, 511, 316, doi: 10.1093/mnras/stab3810 Di Mascolo, L., Saro, A., Mroczkowski, T., et al
Dekel, A., Mandelker, N., Bournaud, F., et al. 2022, MNRAS, 511, 316, doi: 10.1093/mnras/stab3810 Di Mascolo, L., Saro, A., Mroczkowski, T., et al. 2023, Nature, 615, 809, doi: 10.1038/s41586-023-05761-x Di Teodoro, E. M., & Fraternali, F. 2015, MNRAS, 451, 3021, doi: 10.1093/mnras/stv1213
-
[16]
Emonts, B. H. C., Feain, I., R¨ ottgering, H. J. A., et al. 2013, MNRAS, 430, 3465, doi: 10.1093/mnras/stt147
-
[17]
Emonts, B. H. C., Lehnert, M. D., Villar-Mart´ ın, M., et al. 2016, Science, 354, 1128, doi: 10.1126/science.aag0512 F¨ orster Schreiber, N. M., Genzel, R., Bouch´ e, N., et al. 2009, ApJ, 706, 1364, doi: 10.1088/0004-637X/706/2/1364
-
[18]
Genzel, R., Tacconi, L. J., Combes, F., et al. 2012, ApJ, 746, 69, doi: 10.1088/0004-637X/746/1/69
-
[19]
Harrington, K. C., Vishwas, A., Man, A. W. S., et al. 2025, A&A, 701, A298, doi: 10.1051/0004-6361/202555071
-
[20]
2012, MNRAS, 420, 1825, doi: 10.1111/j.1365-2966.2011.19805.x
Hatch, N. A., Kurk, J. D., Pentericci, L., et al. 2011, MNRAS, 415, 2993, doi: 10.1111/j.1365-2966.2011.18735.x
-
[21]
M., Sun, F., Woodrum, C., et al
Helton, J. M., Sun, F., Woodrum, C., et al. 2024, ApJ, 974, 41, doi: 10.3847/1538-4357/ad6867
-
[22]
2020, Monthly Notices of the Royal Astronomical Society, 495, 3124–3159, doi: 10.1093/mnras/staa1275
Hill, R., Chapman, S., Scott, D., et al. 2020, MNRAS, 495, 3124, doi: 10.1093/mnras/staa1275
-
[23]
Hughes, C., Hill, R., Chapman, S. C., et al. 2025, ApJL, 983, L11, doi: 10.3847/2041-8213/adc1c9 CO(3−2) in Spiderweb SMGs19
-
[24]
Hunter, J. D. 2007, Computing in Science & Engineering, 9, 90, doi: 10.1109/MCSE.2007.55
-
[25]
Hunter, T. R., Indebetouw, R., Brogan, C. L., et al. 2023, PASP, 135, 074501, doi: 10.1088/1538-3873/ace216
-
[26]
2021, A&A, 652, A11, doi: 10.1051/0004-6361/202040232
Jin, S., Dannerbauer, H., Emonts, B., et al. 2021, A&A, 652, A11, doi: 10.1051/0004-6361/202040232
-
[27]
Jin, S., Sillassen, N. B., Magdis, G. E., et al. 2024, A&A, 683, L4, doi: 10.1051/0004-6361/202348540
-
[28]
Jones, G. C., Vergani, D., Romano, M., et al. 2021, MNRAS, 507, 3540, doi: 10.1093/mnras/stab2226
-
[29]
C., Maiolino, R., D’Eugenio, F., et al
Jones, G. C., Maiolino, R., D’Eugenio, F., et al. 2025, arXiv e-prints, arXiv:2512.05213, doi: 10.48550/arXiv.2512.05213
-
[30]
2019, ApJ, 879, 41, doi: 10.3847/1538-4357/ab223a
Kirkpatrick, A., Sharon, C., Keller, E., & Pope, A. 2019, ApJ, 879, 41, doi: 10.3847/1538-4357/ab223a
-
[31]
2013, MNRAS, 428, 1551, doi: 10.1093/mnras/sts133
Koyama, Y., Kodama, T., Tadaki, K.-i., et al. 2013, MNRAS, 428, 1551, doi: 10.1093/mnras/sts133
-
[32]
Kravtsov, A. V., & Borgani, S. 2012, ARAA, 50, 353, doi: 10.1146/annurev-astro-081811-125502
-
[33]
D., Pentericci, L., Overzier, R
Kurk, J. D., Pentericci, L., Overzier, R. A., R¨ ottgering, H. J. A., & Miley, G. K. 2004, A&A, 428, 817, doi: 10.1051/0004-6361:20041819
-
[34]
Kurk, J. D., R¨ ottgering, H. J. A., Pentericci, L., et al. 2000, A&A, 358, L1, doi: 10.48550/arXiv.astro-ph/0005058
work page internal anchor Pith review doi:10.48550/arxiv.astro-ph/0005058 2000
-
[35]
Long, A. S., Cooray, A., Ma, J., et al. 2020, ApJ, 898, 133, doi: 10.3847/1538-4357/ab9d1f
-
[36]
Madau, P., & Dickinson, M. 2014, ARA&A, 52, 415, doi: 10.1146/annurev-astro-081811-125615
work page Pith review doi:10.1146/annurev-astro-081811-125615 2014
-
[37]
Miley, G. K., Overzier, R. A., Zirm, A. W., et al. 2006, ApJL, 650, L29, doi: 10.1086/508534
-
[38]
Miller, T. B., Chapman, S. C., Aravena, M., et al. 2018, Nature, 556, 469, doi: 10.1038/s41586-018-0025-2
-
[39]
2024, ApJ, 977, 58, doi: 10.3847/1538-4357/ad8dcf
Naufal, A., Koyama, Y., D’Eugenio, C., et al. 2024, ApJ, 977, 58, doi: 10.3847/1538-4357/ad8dcf
-
[40]
Oteo, I., Ivison, R. J., Dunne, L., et al. 2018, ApJ, 856, 72, doi: 10.3847/1538-4357/aaa1f1
-
[41]
Overzier, R. A. 2016, A&A Rv, 24, 14, doi: 10.1007/s00159-016-0100-3
-
[42]
Papovich, C., Momcheva, I., Willmer, C. N. A., et al. 2010, ApJ, 716, 1503, doi: 10.1088/0004-637X/716/2/1503
-
[43]
Pentericci, L., Kurk, J. D., R¨ ottgering, H. J. A., et al. 2000, A&A, 361, L25, doi: 10.48550/arXiv.astro-ph/0008143 P´ erez-Mart´ ınez, J. M., Dannerbauer, H., Kodama, T., et al. 2023, MNRAS, 518, 1707, doi: 10.1093/mnras/stac2784 P´ erez-Mart´ ınez, J. M., Dannerbauer, H., Koyama, Y., et al. 2024, ApJ, 977, 74, doi: 10.3847/1538-4357/ad8156 P´ erez-Mar...
work page internal anchor Pith review doi:10.48550/arxiv.astro-ph/0008143 2000
-
[44]
2022, A&A, 662, A94, doi: 10.1051/0004-6361/202142659
Perna, M., Arribas, S., Colina, L., et al. 2022, A&A, 662, A94, doi: 10.1051/0004-6361/202142659
-
[45]
2012, MNRAS, 423, 600, doi: 10.1111/j.1365-2966.2012.20901.x
Popping, G., Caputi, K. I., Somerville, R. S., & Trager, S. C. 2012, MNRAS, 425, 2386, doi: 10.1111/j.1365-2966.2012.21702.x
-
[46]
2024, ApJ, 968, 118, doi: 10.3847/1538-4357/ad488a
Pudoka, M., Wang, F., Fan, X., et al. 2024, ApJ, 968, 118, doi: 10.3847/1538-4357/ad488a
-
[47]
Remus, R.-S., & Kimmig, L. C. 2025, ApJ, 982, 30, doi: 10.3847/1538-4357/ad8b4b
-
[48]
Evolution of turbulence in galaxy disks across cosmic time: Difference between cold and warm gas
Rizzo, F., Bacchini, C., Kohandel, M., et al. 2024, A&A, 689, A273, doi: 10.1051/0004-6361/202450455
-
[49]
2017, ApJ, 849, 27, doi: 10.3847/1538-4357/aa87b2
Rudnick, G., Hodge, J., Walter, F., et al. 2017, ApJ, 849, 27, doi: 10.3847/1538-4357/aa87b2
-
[50]
Scoville, N., Sheth, K., Aussel, H., et al. 2016, ApJ, 820, 83, doi: 10.3847/0004-637X/820/2/83
-
[51]
2015, MNRAS, 448, 666, doi: 10.1093/mnras/stv051
Shimakawa, R., Kodama, T., Tadaki, K.-i., et al. 2015, MNRAS, 448, 666, doi: 10.1093/mnras/stv051
-
[52]
Shimakawa, R., Koyama, Y., R¨ ottgering, H. J. A., et al. 2018, MNRAS, 481, 5630, doi: 10.1093/mnras/sty2618
-
[53]
Shimakawa, R., P´ erez-Mart´ ınez, J. M., Dannerbauer, H., et al. 2024a, ApJ, 977, 73, doi: 10.3847/1538-4357/ad8155
-
[54]
Shimakawa, R., P´ erez-Mart´ ınez, J. M., Koyama, Y., et al. 2024b, MNRAS, 528, 3679, doi: 10.1093/mnras/stae118
-
[55]
Sillassen, N. B., Jin, S., Magdis, G. E., et al. 2024, A&A, 690, A55, doi: 10.1051/0004-6361/202450760
-
[56]
Skibba, R. A., Bamford, S. P., Nichol, R. C., et al. 2009, MNRAS, 399, 966, doi: 10.1111/j.1365-2966.2009.15334.x
-
[57]
Solomon, P. M., Downes, D., Radford, S. J. E., & Barrett, J. W. 1997, ApJ, 478, 144, doi: 10.1086/303765
-
[58]
Steidel, C. C., Adelberger, K. L., Dickinson, M., et al. 1998, ApJ, 492, 428, doi: 10.1086/305073
-
[59]
Stevens, J. A., Ivison, R. J., Dunlop, J. S., et al. 2003, Nature, 425, 264, doi: 10.1038/nature01976
-
[60]
2024, ApJL, 967, L34, doi: 10.3847/2041-8213/ad4986
Sun, H., Wang, T., Xu, K., et al. 2024, ApJL, 967, L34, doi: 10.3847/2041-8213/ad4986
-
[61]
Tacchella, S., Dekel, A., Carollo, C. M., et al. 2016, MNRAS, 458, 242, doi: 10.1093/mnras/stw303
-
[62]
J., Genzel, R., Saintonge, A., et al
Tacconi, L. J., Genzel, R., Saintonge, A., et al. 2018, ApJ, 853, 179, doi: 10.3847/1538-4357/aaa4b4
-
[63]
2019, PASJ, 71, 40, doi: 10.1093/pasj/psz005
Tadaki, K.-i., Kodama, T., Hayashi, M., et al. 2019, PASJ, 71, 40, doi: 10.1093/pasj/psz005
-
[64]
2022, A&A, 662, A54, doi: 10.1051/0004-6361/202142333
Tozzi, P., Pentericci, L., Gilli, R., et al. 2022, A&A, 662, A54, doi: 10.1051/0004-6361/202142333
-
[65]
2025, ApJL, 985, L8, doi: 10.3847/2041-8213/add1d4
Umehata, H., Kubo, M., & Nakanishi, K. 2025, ApJL, 985, L8, doi: 10.3847/2041-8213/add1d4
-
[66]
2015, The Astrophysical Journal Letters, 815, L8, doi: 10.1088/2041-8205/815/1/L8
Umehata, H., Tamura, Y., Kohno, K., et al. 2015, ApJL, 815, L8, doi: 10.1088/2041-8205/815/1/L8 van der Burg, R. F. J., Hoekstra, H., Muzzin, A., et al. 2015, A&A, 577, A19, doi: 10.1051/0004-6361/201425460 20 van der Burg, R. F. J., Muzzin, A., Hoekstra, H., et al. 2014, A&A, 561, A79, doi: 10.1051/0004-6361/201322771 van der Burg, R. F. J., Muzzin, A., ...
-
[67]
Venemans, B. P., R¨ ottgering, H. J. A., Miley, G. K., et al. 2007, A&A, 461, 823, doi: 10.1051/0004-6361:20053941
-
[68]
The assembly and star formation cessation of galaxies at 0.2< z 7.5
Weaver, J. R., Davidzon, I., Toft, S., et al. 2023, A&A, 677, A184, doi: 10.1051/0004-6361/202245581
-
[69]
Wisnioski, E., F¨ orster Schreiber, N. M., Wuyts, S., et al. 2015, ApJ, 799, 209, doi: 10.1088/0004-637X/799/2/209
-
[70]
Zavala, J. A., Casey, C. M., Scoville, N., et al. 2019, ApJ, 887, 183, doi: 10.3847/1538-4357/ab5302
-
[71]
Zhang, Y., Zheng, X. Z., Shi, D. D., et al. 2022, MNRAS, 512, 4893, doi: 10.1093/mnras/stac824
-
[72]
H., Dannerbauer, H., P´ erez-Mart´ ınez, J
Zhang, Y. H., Dannerbauer, H., P´ erez-Mart´ ınez, J. M., et al. 2024, A&A, 692, A22, doi: 10.1051/0004-6361/202451379
-
[73]
H., Dannerbauer, H., P´ erez-Mart´ ınez, J
Zhang, Y. H., Dannerbauer, H., P´ erez-Mart´ ınez, J. M., et al. 2026, A&A, 706, A9, doi: 10.1051/0004-6361/202556611
-
[74]
Zhou, D., Chapman, S. C., Aravena, M., et al. 2026, Nature, 649, 1130, doi: 10.1038/s41586-025-09901-3
-
[75]
Zhou, L., Wang, T., Daddi, E., et al. 2025, A&A, 701, A234, doi: 10.1051/0004-6361/202553996 CO(3−2) in Spiderweb SMGs21 APPENDIX A.3DBAROLO FITS In this Section we display the 3DBarolo fits for each DSFG. Note that the fit failed for DKB16 and COALAS.SW15 altogether due to low SNR, so we do not display plots for these two sources. 0 10 20 30 40 50 DATA I...
discussion (0)
Sign in with ORCID, Apple, or X to comment. Anyone can read and Pith papers without signing in.