Recognition: unknown
Why Mean Pooling Works: Quantifying Second-Order Collapse in Text Embeddings
Pith reviewed 2026-05-07 08:50 UTC · model grok-4.3
The pith
Mean pooling collapses second-order statistics of token embeddings but modern encoders resist this via concentrated tokens, with contrastive fine-tuning increasing resistance and task performance.
A machine-rendered reading of the paper's core claim, the machinery that carries it, and where it could break.
Core claim
Mean pooling can map distinct token embedding distributions to similar text embeddings by discarding second-order statistics, yet actual encoders prove robust to this collapse; the robustness stems from concentration of token embeddings inside each text, is stronger after contrastive fine-tuning, and correlates with downstream task performance.
What carries the argument
A metric that quantifies second-order collapse by measuring how much the spatial structure among token embeddings is lost under mean pooling.
If this is right
- Contrastive fine-tuning reduces the second-order collapse that mean pooling would otherwise cause.
- The concentration of token embeddings within each text is what prevents the collapse.
- Encoders whose embeddings resist this collapse achieve stronger results on downstream tasks.
- Mean pooling remains effective because training already aligns token distributions to survive averaging.
Where Pith is reading between the lines
- The same concentration principle could be tested as a training objective for pooling in vision or speech models.
- The metric might serve as a diagnostic during pretraining to encourage better preservation of distributional information.
- If collapse resistance is the key, then other simple pooling methods like max or attention-based might be compared directly using the same measure.
Load-bearing premise
The chosen metric captures information loss that actually affects downstream task performance rather than depending on the similarity measure or embedding space used.
What would settle it
An experiment showing that encoders with low collapse scores perform no better on tasks than those with high collapse scores, or that forcing higher collapse does not degrade task results, would disprove the link.
Figures


read the original abstract
For constructing text embeddings, mean pooling, which averages token embeddings, is the standard approach. This paper examines whether mean pooling actually works well in real models. First, we note that mean pooling can collapse information beyond the first-order statistics of the token embeddings, such as second-order statistics that capture their spatial structure, potentially mapping distinct token embedding distributions to similar text embeddings. Motivated by this concern, we propose a simple metric to quantify such a collapse induced by mean pooling. Then, using this metric, we empirically measure how often this collapse occurs in actual models and texts, and find that modern text encoders are robust to this collapse. In particular, contrastive fine-tuned text encoders tend to be less prone to the collapse than their pretrained backbone models. We also find that the robustness of these text encoders lies in the concentration of token embeddings within each text. In addition, we find that robustness to the collapse, as quantified by our proposed metric, correlates with downstream task performance. Overall, our findings offer a new perspective on why modern text encoders remain effective despite relying on seemingly coarse mean pooling.
Editorial analysis
A structured set of objections, weighed in public.
Referee Report
Summary. The paper claims that mean pooling of token embeddings can induce second-order collapse (distinct token distributions mapping to similar means), proposes a metric based on second moments or distribution distances to quantify this, and empirically finds that modern text encoders—particularly contrastive fine-tuned ones—are robust to it due to high token embedding concentration within texts. It further reports that lower collapse scores correlate with better downstream task performance, offering an explanation for why mean pooling remains effective.
Significance. If the metric successfully isolates second-order effects that are causally linked to performance (independent of first-order concentration and training objectives), the work provides a useful diagnostic for embedding quality and a partial explanation for mean pooling's success. The empirical observation that contrastive models show both lower collapse and higher concentration is consistent with known geometry optimization in contrastive training; the correlation with tasks is potentially actionable for model selection but requires disambiguation from confounding factors to be load-bearing.
major comments (2)
- [Empirical results / correlation analysis] The central claim that the proposed metric quantifies second-order collapse whose absence explains mean pooling's utility rests on the correlation with downstream performance. However, contrastive fine-tuning directly optimizes embedding concentration and geometry; any metric sensitive to these properties will correlate with performance by construction. No ablation or control is described that isolates the second-order component (e.g., by holding first-order statistics fixed or comparing to non-contrastive baselines with matched concentration) to show that the metric captures task-relevant information loss beyond known geometric effects.
- [Analysis of token concentration] The robustness finding attributes lower collapse in contrastive models to 'concentration of token embeddings within each text.' This risks circularity: concentration is both the mechanism claimed to reduce collapse and a direct outcome of the contrastive objective. A concrete test (e.g., measuring collapse after explicitly controlling or randomizing concentration while preserving means) is needed to establish that second-order preservation, rather than concentration per se, drives the performance correlation.
minor comments (2)
- [Abstract / Methods] The abstract and high-level description omit equations for the proposed metric and details of the similarity measure or distribution distance used; these should be stated explicitly early in the methods section for reproducibility.
- [Experimental evaluation] Downstream task correlations should report effect sizes, confidence intervals, and controls for model size or training data volume, as these are common confounders when comparing pretrained vs. fine-tuned encoders.
Simulated Author's Rebuttal
We thank the referee for the constructive feedback highlighting the need for stronger isolation of second-order effects in our empirical analysis. We agree that additional controls are required to substantiate the claims and will revise the manuscript to include them. Below we respond point by point to the major comments.
read point-by-point responses
-
Referee: The central claim that the proposed metric quantifies second-order collapse whose absence explains mean pooling's utility rests on the correlation with downstream performance. However, contrastive fine-tuning directly optimizes embedding concentration and geometry; any metric sensitive to these properties will correlate with performance by construction. No ablation or control is described that isolates the second-order component (e.g., by holding first-order statistics fixed or comparing to non-contrastive baselines with matched concentration) to show that the metric captures task-relevant information loss beyond known geometric effects.
Authors: We acknowledge that the absence of explicit ablations leaves the isolation of second-order effects incomplete. Our metric is constructed from second-moment discrepancies and distribution distances that are mathematically orthogonal to the mean, yet we agree that empirical disambiguation from concentration is necessary. In the revision we will add two controls: (1) synthetic embeddings with fixed means and variances but varied higher-order structure to measure metric sensitivity, and (2) comparison against non-contrastive models whose concentration is matched via post-hoc scaling. These additions will test whether the metric retains predictive power for downstream performance after first-order statistics are held constant. revision: yes
-
Referee: The robustness finding attributes lower collapse in contrastive models to 'concentration of token embeddings within each text.' This risks circularity: concentration is both the mechanism claimed to reduce collapse and a direct outcome of the contrastive objective. A concrete test (e.g., measuring collapse after explicitly controlling or randomizing concentration while preserving means) is needed to establish that second-order preservation, rather than concentration per se, drives the performance correlation.
Authors: We recognize the circularity concern. While our observational results link concentration to reduced collapse, we did not perform interventional tests. In the revision we will introduce a controlled experiment that preserves per-text means while systematically varying intra-text concentration (via variance scaling and controlled randomization of token positions). We will then recompute the collapse metric and re-evaluate its correlation with downstream tasks on these modified embeddings. This will clarify whether second-order preservation, enabled by but separable from concentration, is the operative factor. revision: yes
Circularity Check
No significant circularity in empirical metric proposal or observed correlations
full rationale
The paper proposes a new metric for second-order collapse induced by mean pooling, then reports direct empirical measurements of this metric across models and texts, along with observed correlations to downstream task performance. No derivation, prediction, or central claim reduces by construction to fitted parameters, self-referential definitions, or load-bearing self-citations. All steps are falsifiable computations against external benchmarks and task data, making the analysis self-contained.
Axiom & Free-Parameter Ledger
Reference graph
Works this paper leans on
-
[1]
MS MARCO: A Human Generated MAchine Reading COmprehension Dataset
MS MARCO: A Human Gen- erated MAchine Reading COmprehension Dataset. Preprint, arXiv:1611.09268. Juan Antonio Cuesta-Albertos, C Matrán-Bea, and A Tuero-Dı́az
work page internal anchor Pith review arXiv
-
[2]
InProceedings of the 2019 Conference of the North American Chapter of the Association for Computational Linguistics: Human Language Technologies (NAACL), pages 4171–4186
BERT: Pre-training of Deep Bidirectional Transformers for Language Un- derstanding. InProceedings of the 2019 Conference of the North American Chapter of the Association for Computational Linguistics: Human Language Technologies (NAACL), pages 4171–4186. Matthijs Douze, Alexandr Guzhva, Chengqi Deng, Jeff Johnson, Gergely Szilvasy, Pierre-Emmanuel Mazaré,...
2019
-
[3]
The Faiss library.Preprint, arXiv:2401.08281. D.C Dowson and B.V Landau
work page internal anchor Pith review arXiv
-
[4]
How Contextual are Con- textualized Word Representations? Comparing the Geometry of BERT, ELMo, and GPT-2 Embeddings. InProceedings of the 2019 Conference on Empirical Methods in Natural Language Processing and the 9th International Joint Conference on Natural Language Processing (EMNLP-IJCNLP), pages 55–65. Yair Feldman and Yoav Artzi
2019
-
[5]
No Mean Feat: Simple, Strong Baselines for Context Compression
Simple Context Compression: Mean-Pooling and Multi-Ratio Train- ing.Preprint, arXiv:2510.20797. Tianyu Gao, Xingcheng Yao, and Danqi Chen
work page internal anchor Pith review arXiv
-
[6]
InProceedings of the 2021 Conference on Empirical Methods in Natural Language Process- ing (EMNLP), pages 6894–6910
SimCSE: Simple Contrastive Learning of Sentence Embeddings. InProceedings of the 2021 Conference on Empirical Methods in Natural Language Process- ing (EMNLP), pages 6894–6910. Martin Heusel, Hubert Ramsauer, Thomas Unterthiner, Bernhard Nessler, and Sepp Hochreiter
2021
-
[7]
Gemini embedding: Generalizable embeddings from gemini.arXiv:2503.07891, 2025
Gemini Embedding: Generalizable Em- beddings from Gemini.Preprint, arXiv:2503.07891. Seonghyeon Lee, Dongha Lee, Seongbo Jang, and Hwanjo Yu
-
[8]
Towards General Text Embeddings with Multi-stage Contrastive Learning
Towards General Text Embeddings with Multi-stage Con- trastive Learning.Preprint, arXiv:2308.03281. Zach Nussbaum, John Xavier Morris, Andriy Mul- yar, and Brandon Duderstadt
work page internal anchor Pith review arXiv
-
[9]
Computational Optimal Transport.Preprint, arXiv:1803.00567. Ricardo Rei, Craig Stewart, Ana C Farinha, and Alon Lavie
-
[10]
InProceedings of the 2020 Conference on Empirical Methods in Natural Language Process- ing (EMNLP), pages 2685–2702
COMET: A Neural Framework for MT Evaluation. InProceedings of the 2020 Conference on Empirical Methods in Natural Language Process- ing (EMNLP), pages 2685–2702. Nils Reimers and Iryna Gurevych
2020
-
[11]
Sentence- BERT: Sentence Embeddings using Siamese BERT- Networks. InProceedings of the 2019 Conference on Empirical Methods in Natural Language Processing and the 9th International Joint Conference on Natu- ral Language Processing (EMNLP-IJCNLP), pages 3982–3992. Keshav Santhanam, Omar Khattab, Jon Saad-Falcon, Christopher Potts, and Matei Zaharia
2019
-
[12]
InProceedings of the 2022 Conference of the North American Chapter of the Association for Computational Linguistics: Hu- man Language Technologies (NAACL), pages 3715–
Col- BERTv2: Effective and Efficient Retrieval via Lightweight Late Interaction. InProceedings of the 2022 Conference of the North American Chapter of the Association for Computational Linguistics: Hu- man Language Technologies (NAACL), pages 3715–
2022
-
[13]
InProceedings of the 2025 Conference on Empirical Methods in Natural Language Processing (EMNLP), pages 27705–27726
Randomly Re- moving 50% of Dimensions in Text Embeddings has Minimal Impact on Retrieval and Classification Tasks. InProceedings of the 2025 Conference on Empirical Methods in Natural Language Processing (EMNLP), pages 27705–27726. Nandan Thakur, Nils Reimers, Andreas Rücklé, Ab- hishek Srivastava, and Iryna Gurevych
2025
-
[14]
InAdvances in Neural Information Pro- cessing Systems 30 (NIPS)
Attention is All you Need. InAdvances in Neural Information Pro- cessing Systems 30 (NIPS). Cedric Villani. 2009.Optimal Transport: Old and New, 1 edition, volume 338 ofGrundlehren der mathema- tischen Wissenschaften. Springer Berlin Heidelberg. Liang Wang, Nan Yang, Xiaolong Huang, Binxing Jiao, Linjun Yang, Daxin Jiang, Rangan Majumder, and Furu Wei
2009
-
[15]
Text Embeddings by Weakly-Supervised Contrastive Pre-training
Text Embeddings by Weakly- Supervised Contrastive Pre-training.Preprint, arXiv:2212.03533. Tongzhou Wang and Phillip Isola
work page internal anchor Pith review arXiv
-
[16]
InFindings of the Association for Computational Linguistics: ACL 2023, pages 12266– 12283
On Isotropy, Contextualization and Learning Dynamics of Contrastive-based Sentence Represen- tation Learning. InFindings of the Association for Computational Linguistics: ACL 2023, pages 12266– 12283. Shohei Yoda, Hayato Tsukagoshi, Ryohei Sasano, and Koichi Takeda
2023
-
[17]
InProceedings of the 2020 Conference on Empirical Methods in Natural Language Processing (EMNLP), pages 2944–2960
Word Rotator’s Distance. InProceedings of the 2020 Conference on Empirical Methods in Natural Language Processing (EMNLP), pages 2944–2960. Tianyi Zhang*, Varsha Kishore*, Felix Wu*, Kilian Q. Weinberger, and Yoav Artzi
2020
-
[18]
MoverScore: Text Generation Evaluating with Contextualized Em- beddings and Earth Mover Distance. InProceedings of the 2019 Conference on Empirical Methods in Nat- ural Language Processing and the 9th International Joint Conference on Natural Language Processing (EMNLP-IJCNLP), pages 563–578. A Gaussian Characterization As noted in § 4, our method evaluat...
2019
-
[19]
Note that some text embedders are designed to utilize such prefixes to distinguish be- tween different text types (Wang et al., 2024; Li et al., 2023)
D.1 Dataset Details PreprocessingFor comparison across different models and datasets, we did not use any task- specific prefixes (e.g., query:, passage:) when encoding texts. Note that some text embedders are designed to utilize such prefixes to distinguish be- tween different text types (Wang et al., 2024; Li et al., 2023). Dataset URLsTable 3 shows the ...
2024
-
[20]
H.2 Within-Text Token Embedding Concentration In § 6, we connected our findings to the anisotropy of token embeddings within each text reported by Xiao et al. (2023). As anisotropy is com- monly measured using cosine similarity (Xiao et al., 2023), we quantify within-text token em- bedding concentration via the layer-wise average of 1 n2 P j,k cos(xj,x k)...
2023
-
[21]
Across all model pairs, fine-tuned text encoders tend to exhibit smalld Σ values
ObservationsFigure 17 shows scatter plots of dµ and dΣ for all examined models on the Wikipedia dataset. Across all model pairs, fine-tuned text encoders tend to exhibit smalld Σ values. Connection to Token Embedding Concentra- tionThis tendency is consistent with the re- sults of § 6, which showed that fine-tuned text 5Note that this quantity is not iden...
2023
-
[22]
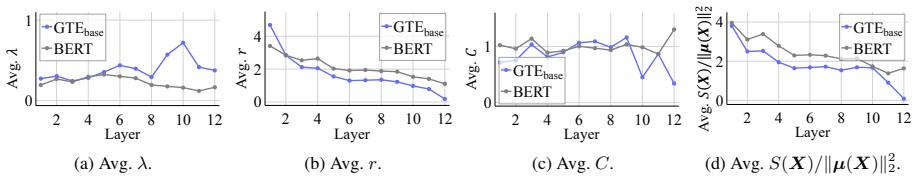
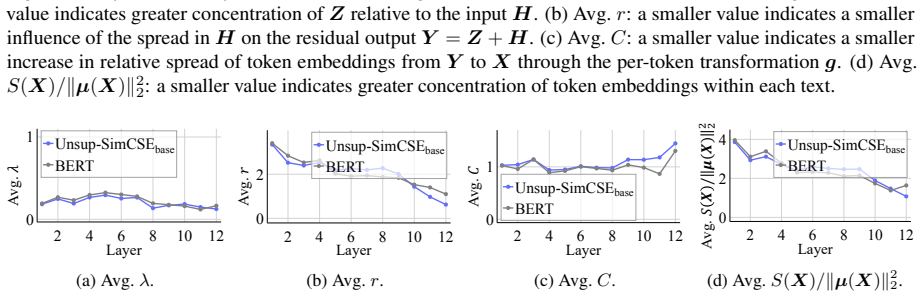
Figure 7: Layer-wise analysis of token embedding concentration for BERT and Unsupervised SimCSE. (a) Avg. λ: a smaller value indicates greater concentration of Z relative to the input H. (b) Avg. r: a smaller value indicates a smaller influence of the spread in H on the residual output Y=Z+H . (c) Avg. C: a smaller value indicates a smaller increase in re...
2019
-
[23]
Figure 9: Layer-wise analysis of token embedding concentration for MiniLM and E5 small. (a) Avg. λ: a smaller value indicates greater concentration of Z relative to the input H. (b) Avg. r: a smaller value indicates a smaller influence of the spread in H on the residual output Y=Z+H . (c) Avg. C: a smaller value indicates a smaller increase in relative sp...
2019
-
[24]
Specifi- cally, the expected cosine similarity between to- ken embeddings within the same text satisfies Ej<k [cos(xi,j,x i,k)]≥1/3
Assumption 2Token embeddings within the same text exhibit sufficient similarity. Specifi- cally, the expected cosine similarity between to- ken embeddings within the same text satisfies Ej<k [cos(xi,j,x i,k)]≥1/3 . This assumption is justified by empirical observations that con- textualized embeddings within the same text are anisotropic (Ethayarajh, 2019...
2019
-
[25]
In § 5, computing SOCM values for all text pairs required approximately 2 hours per model
K Computational Resources All experiments in this paper were conducted using a single NVIDIA RTX 6000 Ada graphics card. In § 5, computing SOCM values for all text pairs required approximately 2 hours per model. The analyses with MTEB (eng, v2) in § 7 required ap- proximately 6 hours per model. L Use of AI Assistants In preparing this paper, we utilized A...
2048
discussion (0)
Sign in with ORCID, Apple, or X to comment. Anyone can read and Pith papers without signing in.