Recognition: unknown
Guided elastic waves for soft elastomer characterization: an alternative to conventional rheometry
Pith reviewed 2026-05-07 07:45 UTC · model grok-4.3
The pith
Guided elastic waves in stretched elastomer strips yield viscoelastic and hyperelastic parameters consistent with rheometry but over a wider frequency range.
A machine-rendered reading of the paper's core claim, the machinery that carries it, and where it could break.
Core claim
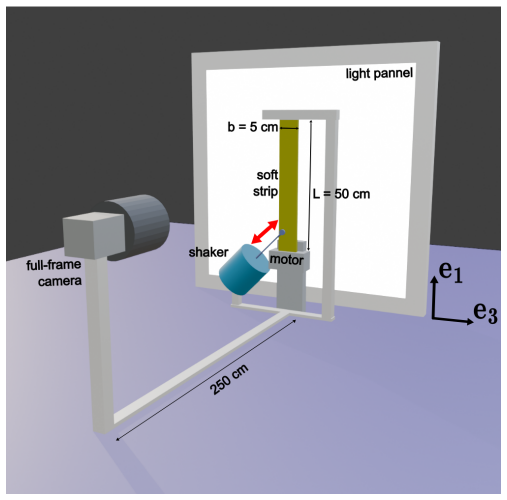
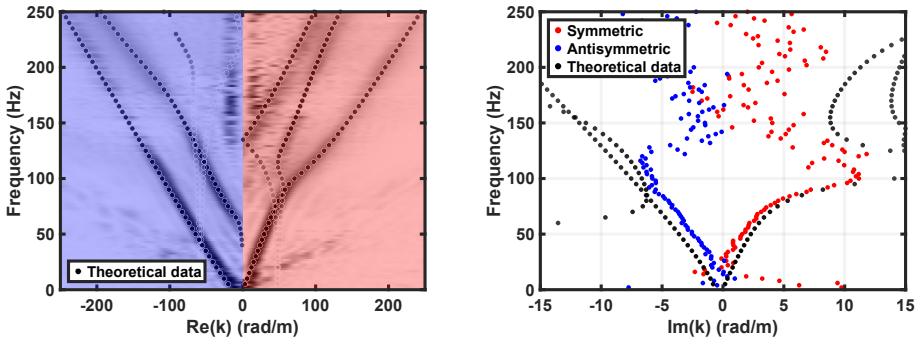
A thin elastomer strip functions as a waveguide whose guided-mode dispersion curves, measured under controlled static elongation, can be matched to a theoretical model that couples viscoelastic relaxation with acoustoelastic stiffening; this matching determines the material's complex shear modulus and hyperelastic parameters over an extended frequency window, yielding results consistent with plate-plate rheometry but without its high-frequency limitations.
What carries the argument
The numerical matching of measured dispersion curves for multiple guided modes to a coupled viscoelastic-acoustoelastic waveguide model under controlled pre-stretch.
If this is right
- Mechanical parameters extracted from the wave method agree with conventional plate-plate rheometry at shared frequencies.
- The accessible frequency range extends beyond the practical upper limit of conventional rheometers.
- A single experimental setup simultaneously probes both frequency-dependent viscoelasticity and elongation-dependent acoustoelasticity.
- The method requires only stroboscopic imaging of wave fields on a thin strip and controlled static elongation, avoiding specialized high-frequency rheometer hardware.
Where Pith is reading between the lines
- The same waveguide geometry could be adapted to other soft solids such as gels or biological tissues where conventional rheometry is difficult.
- Because dispersion curves contain information from multiple modes, the method may allow separation of bulk and shear contributions more cleanly than single-mode techniques.
- Extending the approach to dynamic pre-stress or temperature variation would map a fuller constitutive surface without additional instrumentation.
Load-bearing premise
The numerical fit of dispersion curves to the model uniquely fixes the rheological and hyperelastic parameters without significant ambiguity arising from modeling choices such as the precise form of the viscoelastic law or the boundary conditions.
What would settle it
Independent rheometer measurements at overlapping frequencies that systematically deviate from the parameters extracted by the wave method would falsify the claim of consistency and reliable parameter identification.
Figures


read the original abstract
Elastic wave propagation is intrinsically sensitive to the mechanical properties of the medium through which it travels. In soft elastomers, this makes guided elastic waves natural probes of viscoelastic and acoustoelastic behavior over a broad frequency range. In this work, we introduce a wave-based mechanical characterization method in which a thin elastomer strip acts as a waveguide supporting multiple in-plane guided modes. By combining stroboscopic measurements of monochromatic wave fields with a theoretical framework that couples frequency-dependent viscoelasticity and elongation-dependent acoustoelasticity, we extract complex-valued dispersion relations for guided modes under controlled static elongation. A dedicated numerical implementation allows these experimental dispersion curves to be quantitatively matched to theory, enabling identification of the material's rheological and hyperelastic parameters. Applied to several commercial silicone elastomers, the method yields mechanical parameters that are consistent with conventional plate-plate rheometry, while extending the accessible frequency range beyond that of conventional techniques. By exploiting the richness of guided-wave dispersion and the sensitivity of waves to both frequency and pre-stress, this approach provides a unified, broadband, and experimentally simple route to the mechanical characterization of soft elastomers.
Editorial analysis
A structured set of objections, weighed in public.
Referee Report
Summary. The paper introduces a wave-based method for characterizing soft elastomers in which thin strips act as waveguides supporting in-plane guided modes. Stroboscopic measurements of monochromatic wave fields under controlled static elongation are combined with a coupled viscoelastic-acoustoelastic model; a dedicated numerical implementation fits the measured dispersion curves to extract rheological (complex moduli) and hyperelastic parameters. Applied to commercial silicone elastomers, the extracted values are reported to be consistent with conventional plate-plate rheometry while extending the accessible frequency range.
Significance. If the parameter extraction is shown to be unique and robust, the approach would supply a simple, broadband, non-contact alternative to rheometry that additionally incorporates pre-stress effects via acoustoelasticity. This could be valuable for soft-matter applications where frequency-dependent response and large-strain behavior must be probed beyond the limits of conventional instruments.
major comments (3)
- Abstract: the claim that the method 'yields mechanical parameters that are consistent with conventional plate-plate rheometry' supplies no quantitative support (error bars, R² values, residual plots, or sensitivity analysis), which is load-bearing for validating the central consistency assertion.
- Abstract and method description (dedicated numerical implementation): the uniqueness of the inverse problem that recovers viscoelastic and hyperelastic parameters from dispersion-curve matching is not demonstrated. No global optimization, multiple-start checks, or explicit comparisons against alternative constitutive laws (e.g., Prony series vs. fractional models) are reported, leaving open the possibility of compensatory trade-offs that could produce the observed consistency with rheometry.
- Results section (parameter identification): there is no discussion of how many parameters are fitted versus fixed, nor of possible non-uniqueness or sensitivity to modeling choices such as boundary conditions or the exact form of the viscoelastic law, which directly affects the reliability of the reported extension of the frequency range.
minor comments (2)
- Abstract: the frequency-range extension is stated qualitatively but not quantified (e.g., specific upper frequency limits achieved versus rheometry), which would strengthen the claim.
- Notation and figures: the manuscript would benefit from clearer labeling of which parameters are taken from independent rheometry measurements and which are obtained solely from the wave fit, to avoid any appearance of circularity in the validation.
Simulated Author's Rebuttal
We thank the referee for their constructive and detailed comments, which have helped us improve the clarity and rigor of the manuscript. We address each major comment point by point below. Revisions have been made to strengthen the quantitative support, demonstrate robustness of the inverse problem, and clarify the parameter identification procedure.
read point-by-point responses
-
Referee: Abstract: the claim that the method 'yields mechanical parameters that are consistent with conventional plate-plate rheometry' supplies no quantitative support (error bars, R² values, residual plots, or sensitivity analysis), which is load-bearing for validating the central consistency assertion.
Authors: We agree that the abstract claim requires quantitative backing to be fully convincing. In the revised manuscript we have updated the abstract to include explicit agreement metrics (relative differences of 8–12% for the storage modulus and 10–15% for the loss modulus in the overlapping frequency window) and added references to the corresponding figures that display error bars, residual plots, and direct overlays of the two techniques. A brief sensitivity summary has also been inserted. revision: yes
-
Referee: Abstract and method description (dedicated numerical implementation): the uniqueness of the inverse problem that recovers viscoelastic and hyperelastic parameters from dispersion-curve matching is not demonstrated. No global optimization, multiple-start checks, or explicit comparisons against alternative constitutive laws (e.g., Prony series vs. fractional models) are reported, leaving open the possibility of compensatory trade-offs that could produce the observed consistency with rheometry.
Authors: The original fitting already exploits an over-determined data set (multiple guided modes at several pre-strain levels), which strongly constrains the parameter space. To make this explicit we have expanded the methods section to describe the global optimization algorithm employed and the multi-start verification procedure that consistently converges to the same minimum. We have also added a direct comparison of results obtained with a Prony-series representation versus a fractional-derivative model; the principal rheological parameters and the high-frequency extrapolation remain within the reported uncertainties, indicating that compensatory trade-offs do not alter the central conclusions. revision: yes
-
Referee: Results section (parameter identification): there is no discussion of how many parameters are fitted versus fixed, nor of possible non-uniqueness or sensitivity to modeling choices such as boundary conditions or the exact form of the viscoelastic law, which directly affects the reliability of the reported extension of the frequency range.
Authors: We have revised the parameter-identification subsection to state explicitly which quantities are fitted (complex moduli via the chosen viscoelastic law and the hyperelastic coefficients) and which are held fixed (density measured independently and Poisson’s ratio taken as 0.5). A new sensitivity study examines the influence of boundary-condition idealizations and the choice of viscoelastic constitutive model on the extracted high-frequency response. The analysis shows that the reported extension of the frequency range is robust within the experimental uncertainties and is primarily driven by the measured dispersion data rather than modeling assumptions. revision: yes
Circularity Check
No significant circularity; parameter extraction uses external rheometry validation
full rationale
The paper derives guided-mode dispersion relations from a standard coupled viscoelastic-acoustoelastic model (frequency-dependent moduli plus elongation-dependent hyperelasticity) and performs a numerical fit of those parameters to measured experimental dispersion curves. This is a conventional inverse-problem procedure. The extracted parameters are then compared for consistency against independent plate-plate rheometry performed on the identical samples, supplying external grounding rather than internal self-consistency. No load-bearing self-citations, self-definitional loops, or cases where a fitted quantity is relabeled as a prediction appear in the abstract or method description. The uniqueness of the inverse problem is an unproven modeling assumption, but that is a correctness concern, not a circularity in the derivation chain itself. The overall result remains self-contained against the external benchmark.
Axiom & Free-Parameter Ledger
free parameters (2)
- viscoelastic parameters (storage and loss moduli or equivalent constitutive coefficients)
- hyperelastic parameters (e.g., shear modulus and strain-hardening coefficients)
axioms (3)
- domain assumption The elastomer can be described by a linear viscoelastic constitutive law whose parameters may depend on frequency but are independent of strain amplitude in the small-wave regime
- domain assumption Acoustoelastic coupling under finite pre-elongation can be captured by a hyperelastic strain-energy function whose derivatives enter the wave equation
- domain assumption Guided-wave modes in a thin strip with free surfaces are accurately described by the chosen plate or waveguide theory without significant edge or thickness effects
Reference graph
Works this paper leans on
-
[1]
L. R. G. Treloar.The Physics of Rubber Elasticity. Oxford Classic Texts in the Physical Sciences. Oxford University Press, Oxford, New York, third edition, 2005
2005
-
[2]
Methodical fitting for mathe- matical models of rubber-like materials.Proceedings of the Royal Society A: Mathematical, Physical and Engineering Sciences, 473(2198):20160811, 2017
Michel Destrade, Giuseppe Saccomandi, and Ivonne Sgura. Methodical fitting for mathe- matical models of rubber-like materials.Proceedings of the Royal Society A: Mathematical, Physical and Engineering Sciences, 473(2198):20160811, 2017
2017
-
[3]
Rheometry of polymer melts.Annual review of fluid mechanics, 17(1):45–64, 1985
Joachim Meissner. Rheometry of polymer melts.Annual review of fluid mechanics, 17(1):45–64, 1985
1985
-
[4]
Carl Hanser Verlag GmbH Co KG, 2014
Natalie Rudolph and Tim A Osswald.Polymer rheology: fundamentals and applications. Carl Hanser Verlag GmbH Co KG, 2014
2014
-
[5]
B. A. Auld.Acoustic Fields and Waves in Solids. John Wiley & Sons Inc., 1973
1973
-
[6]
L. D. Landau, L. P. Pitaevskii, E. M. Lifshitz, and A. M. Kosevich.Theory of Elasticity. Butterworth-Heinemann, 3 edition, 1986
1986
-
[7]
Springer Science & Business Media, 1999
Daniel Royer and Eugene Dieulesaint.Elastic waves in solids I: Free and guided propagation. Springer Science & Business Media, 1999
1999
-
[8]
Soft elastomers: A playground for guided waves.The Journal of the Acoustical Society of America, 151(5):3343–3358, 2022
Alexandre Delory, Fabrice Lemoult, Maxime Lanoy, Antonin Eddi, and Claire Prada. Soft elastomers: A playground for guided waves.The Journal of the Acoustical Society of America, 151(5):3343–3358, 2022
2022
-
[9]
R. W. Ogden.Non-linear elastic deformations. Dover Publications, Mineola, N.Y, 1997
1997
-
[10]
Saccomandi.Waves in nonlinear pre-stressed materials
Michel Destrade and G. Saccomandi.Waves in nonlinear pre-stressed materials. Number 495 in CISM Courses and Lectures. Udine, Italy, springer wien new york edition, 2007
2007
-
[11]
Guided elastic waves in a highly-stretched soft plate.Extreme Mechanics Letters, page 102018, 2023
Alexandre Delory, Fabrice Lemoult, Antonin Eddi, and Claire Prada. Guided elastic waves in a highly-stretched soft plate.Extreme Mechanics Letters, page 102018, 2023. 13
2023
-
[12]
Models of fractional viscous stresses for incompress- ible materials.Math
Harold Berjamin and Michel Destrade. Models of fractional viscous stresses for incompress- ible materials.Math. Mech. Solids, 30(2):540–555, 2025
2025
-
[13]
Rheological models containing fractional derivatives.Rheologica Acta, 9:525–534, 1970
W Smit and H De Vries. Rheological models containing fractional derivatives.Rheologica Acta, 9:525–534, 1970
1970
-
[14]
Fractional calculus-a different approach to the analysis of viscoelastically damped structures.AIAA journal, 21(5):741–748, 1983
Ronald L Bagley and Peter J Torvik. Fractional calculus-a different approach to the analysis of viscoelastically damped structures.AIAA journal, 21(5):741–748, 1983
1983
-
[15]
World Scientific, 2022
Francesco Mainardi.Fractional calculus and waves in linear viscoelasticity: an introduction to mathematical models. World Scientific, 2022
2022
-
[16]
Kiefer.Elastodynamic quasi-guided waves for transit-time ultrasonic flow meter- ing
Daniel A. Kiefer.Elastodynamic quasi-guided waves for transit-time ultrasonic flow meter- ing. Number 42 in FAU Forschungen, Reihe B, Medizin, Naturwissenschaft, Technik. FAU University Press, Erlangen, 2022
2022
-
[17]
Kiefer, Alexandre Delory, and Fabrice Lemoult
Daniel A. Kiefer, Alexandre Delory, and Fabrice Lemoult. Gew soft strip, February 2024
2024
-
[18]
Viscoelastic dynamics of a soft strip subject to a large deformation.Soft Matter, 20(9):1983–1995, 2024
Alexandre Delory, Daniel A Kiefer, Maxime Lanoy, Antonin Eddi, Claire Prada, and Fabrice Lemoult. Viscoelastic dynamics of a soft strip subject to a large deformation.Soft Matter, 20(9):1983–1995, 2024
1983
-
[19]
Dirac cones and chiral selection of elastic waves in a soft strip.Proceedings of the National Academy of Sciences, 117(48):30186–30190, 2020
Maxime Lanoy, Fabrice Lemoult, Antonin Eddi, and Claire Prada. Dirac cones and chiral selection of elastic waves in a soft strip.Proceedings of the National Academy of Sciences, 117(48):30186–30190, 2020
2020
-
[20]
In-plane backward and zero group velocity guided modes in rigid and soft strips.The Journal of the Acoustical Society of America, 147(2):1302–1310, 2020
J´ erˆ ome Laurent, Daniel Royer, and Claire Prada. In-plane backward and zero group velocity guided modes in rigid and soft strips.The Journal of the Acoustical Society of America, 147(2):1302–1310, 2020
2020
-
[21]
Trefethen.Spectral Methods in MATLAB
Lloyd N. Trefethen.Spectral Methods in MATLAB. Society for Industrial and Applied Mathematics, Philadelphia, PA, 2000
2000
-
[22]
J. A. Weideman and S. C. Reddy. A MATLAB Differentiation Matrix Suite.ACM Trans. Math. Softw., 26(4):465–519, 2000
2000
-
[23]
Experimental verification of the kramers- kronig relationship for acoustic waves.IEEE transactions on ultrasonics, ferroelectrics, and frequency control, 37(4):286–294, 1990
Chin C Lee, Mike Lahham, and BG Martin. Experimental verification of the kramers- kronig relationship for acoustic waves.IEEE transactions on ultrasonics, ferroelectrics, and frequency control, 37(4):286–294, 1990
1990
-
[24]
Yasar, and Thomas J
Yifei Liu, Temel K. Yasar, and Thomas J. Royston. Ultra wideband (0.5–16 kHz) MR elastography for robust shear viscoelasticity model identification.Physics in Medicine & Biology, 59(24):7717, 2014
2014
-
[25]
A flexible rheometer design to measure the visco-elastic response of soft solids over a wide range of frequency.Review of scientific instruments, 90(2):023906, 2019
Etienne Rolley, Jacco H Snoeijer, and Bruno Andreotti. A flexible rheometer design to measure the visco-elastic response of soft solids over a wide range of frequency.Review of scientific instruments, 90(2):023906, 2019
2019
-
[26]
Bisht, Manik Kakkar, Prachi Thareja, and Karla P
Ananya Sharma, Sai Geetha Marapureddy, Abhijit Paul, Sapna R. Bisht, Manik Kakkar, Prachi Thareja, and Karla P. Mercado-Shekhar. Characterizing Viscoelastic Polyvinyl Alco- hol Phantoms for Ultrasound Elastography.Ultrasound in Medicine and Biology, 49(2):497– 511, 2023
2023
-
[27]
K. J. Parker, T. Szabo, and S. Holm. Towards a consensus on rheological models for elastography in soft tissues.Physics in Medicine & Biology, 64(21):215012, 2019. 14
2019
-
[28]
Sigrist, Joy Liau, Ahmed El Kaffas, Maria Cristina Chammas, and Juergen K
Rosa M.S. Sigrist, Joy Liau, Ahmed El Kaffas, Maria Cristina Chammas, and Juergen K. Willmann. Ultrasound Elastography: Review of Techniques and Clinical Applications. Theranostics, 7(5):1303–1329, 2017
2017
-
[29]
Guo-Yang Li, Qiong He, Robert Mangan, Guoqiang Xu, Chi Mo, Jianwen Luo, Michel Destrade, and Yanping Cao. Guided waves in pre-stressed hyperelastic plates and tubes: Application to the ultrasound elastography of thin-walled soft materials.Journal of the Mechanics and Physics of Solids, 102:67–79, 2017
2017
-
[30]
Lynne E. Bilston. Soft tissue rheology and its implications for elastography: Challenges and opportunities.NMR in Biomedicine, 31(10), 2018
2018
-
[31]
Joseph Crutison, Michael Sun, and Thomas J. Royston. The combined importance of finite dimensions, anisotropy, and pre-stress in acoustoelastography.The Journal of the Acoustical Society of America, 151(4):2403–2413, 2022
2022
-
[32]
Exploring the limits to quantitative elastography: supersonic shear imaging in stretched soft strips.Physics in Medicine and Biology, 2025
Samuel Croquette, Alexandre Delory, Daniel A Kiefer, Claire Prada, and Fabrice Lemoult. Exploring the limits to quantitative elastography: supersonic shear imaging in stretched soft strips.Physics in Medicine and Biology, 2025
2025
-
[33]
On the third-and fourth-order constants of incom- pressible isotropic elasticity.The Journal of the Acoustical Society of America, 128(6):3334– 3343, 2010
Michel Destrade and Raymond W Ogden. On the third-and fourth-order constants of incom- pressible isotropic elasticity.The Journal of the Acoustical Society of America, 128(6):3334– 3343, 2010
2010
-
[34]
Balzani, P
D. Balzani, P. Neff, J. Schr¨ oder, and G.A. Holzapfel. A polyconvex framework for soft biological tissues. Adjustment to experimental data.International Journal of Solids and Structures, 43(20):6052–6070, 2006
2006
-
[35]
Peyraut, Z.-Q
F. Peyraut, Z.-Q. Feng, N. Labed, and C. Renaud. A closed form solution for the uniaxial tension test of biological soft tissues.International Journal of Non-Linear Mechanics, 45(5):535–541, 2010
2010
-
[36]
Mechanics of ultrasound elastography.Proceedings of the Royal Society A: Mathematical, Physical and Engineering Sciences, 473(2199):20160841, 2017
Guo-Yang Li and Yanping Cao. Mechanics of ultrasound elastography.Proceedings of the Royal Society A: Mathematical, Physical and Engineering Sciences, 473(2199):20160841, 2017
2017
-
[37]
Soumya Mukherjee, Michel Destrade, and Artur L. Gower. Representing the stress and strain energy of elastic solids with initial stress and transverse texture anisotropy. Proceedings of the Royal Society A: Mathematical, Physical and Engineering Sciences, 478(2266):20220255, 2022. A Hyperelasticity and acoustoelasticity We describe the hyperelastic behavio...
2022
discussion (0)
Sign in with ORCID, Apple, or X to comment. Anyone can read and Pith papers without signing in.