Recognition: unknown
Anisotropy of Satellite Galaxies-I: Contrasting Correlations with Central Galaxy, Host Halo, and Large-Scale Filament Structures
Pith reviewed 2026-05-07 05:01 UTC · model grok-4.3
The pith
Satellite galaxy distributions exhibit a scale-dependent transition in their alignments, correlating with central galaxy morphology below 0.3 times the virial radius, host halo triaxiality between 0.3 and 2 times that radius, and cosmic fil
A machine-rendered reading of the paper's core claim, the machinery that carries it, and where it could break.
Core claim
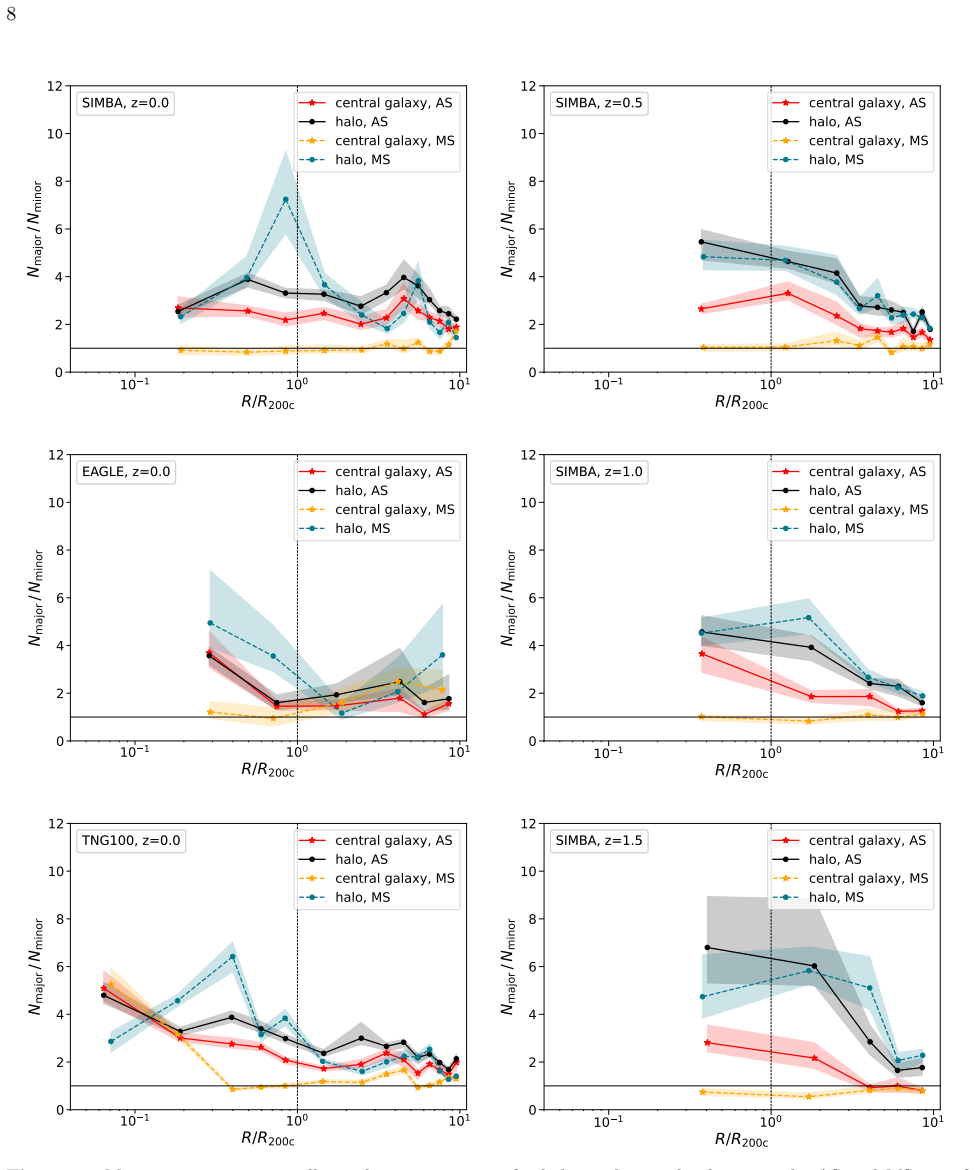
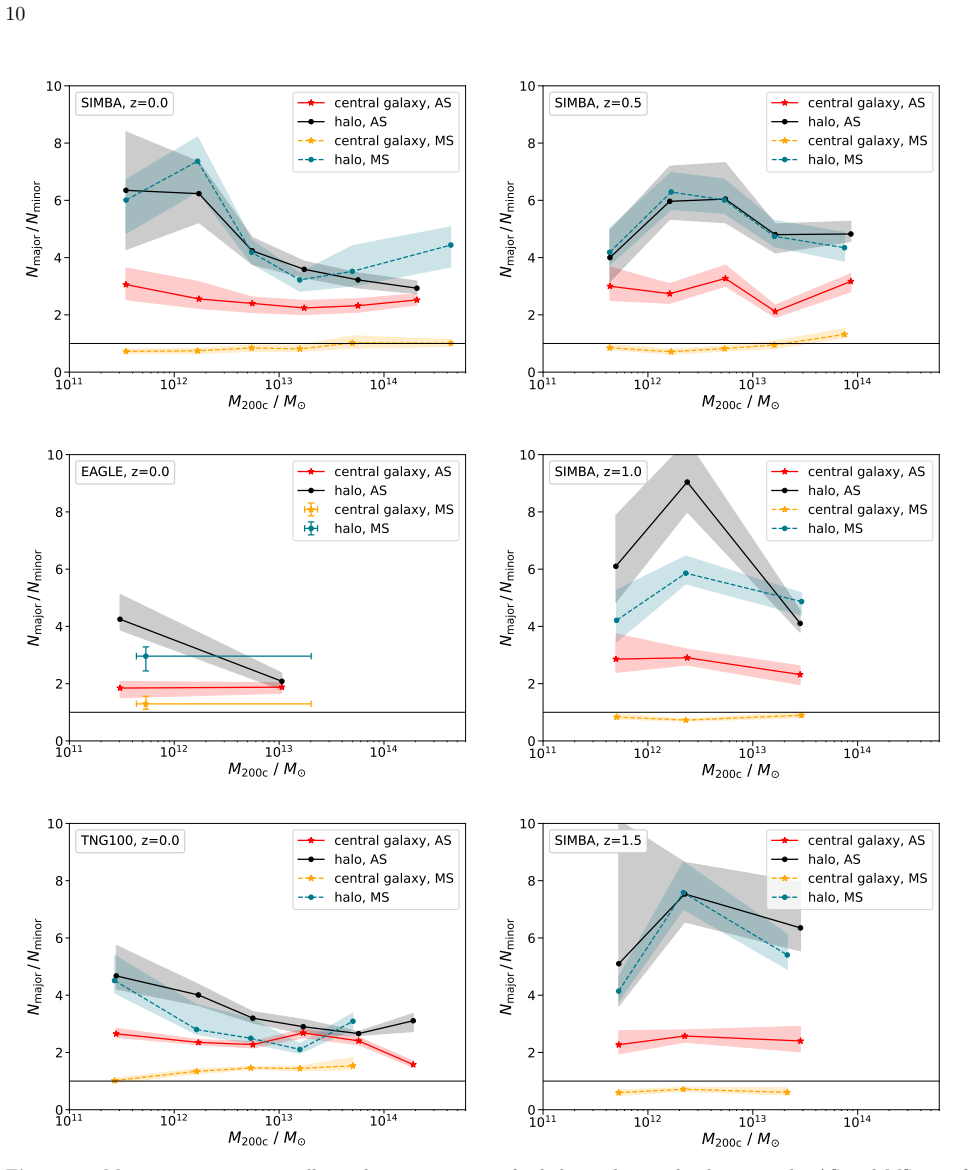
In the SIMBA, EAGLE, and IllustrisTNG-100 simulations the satellite anisotropy is robustly aligned with the halo and central galaxy major axis in a redshift- and mass-dependent way that extends to filaments outside the halo. A clear 3 sigma scale-dependent transition is identified where satellites correlate with central galaxy morphology at small scales less than 0.3 R_200c, are governed by host halo triaxiality at 0.3-2 R_200c, and align with cosmic filaments beyond 2 R_200c. Tracing satellite trajectories in SIMBA reveals the kinematic origin: satellites intersect the halo major axis more frequently and remain there longer under the gravitational potential, dynamically processing away any
What carries the argument
The kinematic preference of satellite trajectories for the host halo major axis, arising because those paths intersect the axis more often and dwell there longer under the host gravitational potential, which produces the observed shift in dominant structural tracers across scales.
If this is right
- The alignment with the halo and central major axis is robust across all three simulations and persists up to redshift 1.5 and down to halo masses of 10^11 solar masses.
- Dynamical processing inside the halo erases primordial filament-related alignment signals for satellites once they are accreted within 2 R_200c.
- Satellite distributions remain correlated with the central galaxy morphology only at the smallest radii below 0.3 R_200c.
- The transition between the three structural tracers occurs at well-defined scales with 3 sigma statistical significance.
Where Pith is reading between the lines
- If the kinematic mechanism holds, observations of satellite alignments at different projected radii could be used to estimate the dynamical state or accretion history of observed halos.
- The result suggests that models of galaxy assembly must include orbit averaging inside halos when predicting how satellites trace the cosmic web at varying distances from the center.
- This scale dependence may help explain why some observational studies find stronger filament alignments in the outskirts of groups and clusters than near the central galaxy.
Load-bearing premise
The methods used to identify filaments, measure halo shapes, and select satellites in the simulations introduce no significant resolution or algorithm-dependent biases that would create or move the reported scale-dependent transition.
What would settle it
A measurement in real galaxy clusters or groups showing that the alignment of satellites with central galaxy or halo major axis does not switch to filament alignment near twice the virial radius, or that the transition radius changes strongly when simulation resolution is varied.
Figures


read the original abstract
Using the SIMBA, EAGLE, and IllustrisTNG-100 galaxy formation simulations, we examine the anisotropy of the satellite distribution and its dependencies on central galaxies, host halos, and cosmic filaments. We find that in all simulations the satellite anisotropy is robustly aligned with the halo/central galaxy major axis. This correlation is both redshift- and halo-mass-dependent and also extends to filamentary structures outside the halo to several virial radii. The alignment persists up to $z=1.5$ at high redshifts, and the mass dependence remains down to $M_\mathrm{200c} \approx 10^{11}M_{\odot}$. We identify a clear $3\sigma$ scale-dependent transition in the structural tracers of satellite anisotropy: satellite distributions correlate with central galaxy morphology at small scales ($<0.3R_{\rm 200c}$), are governed by host halo triaxiality at halo scales ($0.3$-$2R_{\rm 200c}$), and align with cosmic filaments beyond $2R_{\rm 200c}$. By tracing satellite trajectories in SIMBA, we uncover the kinematic origin of this transition, demonstrating that satellites prefer halo major-axis aligned regions because their trajectories intersect this axis far more frequently and stay in it for a longer time under the host's gravitational potential. This dynamical processing effectively erases primordial filament-related signals upon accretion ($<2R_{\rm 200c}$), explaining the shift in dominant structural tracers across scales.
Editorial analysis
A structured set of objections, weighed in public.
Referee Report
Summary. Using the SIMBA, EAGLE, and IllustrisTNG-100 galaxy formation simulations, the paper examines the anisotropy of satellite galaxy distributions around central galaxies. It reports a robust alignment with the halo/central major axis that is redshift- and mass-dependent, extending to filaments beyond the virial radius. The key result is a 3σ scale-dependent transition: satellites correlate with central galaxy morphology at r < 0.3 R_200c, with host halo triaxiality at 0.3–2 R_200c, and with cosmic filaments at r > 2 R_200c. Trajectory tracking in SIMBA shows satellites spend more time along the halo major axis due to orbital dynamics, erasing primordial filament signals inside 2 R_200c.
Significance. If robust, the scale-dependent transition and its kinematic explanation represent a useful advance in understanding how satellite distributions are shaped by different structures at different radii. The use of three independent simulations and direct particle trajectory analysis in SIMBA are clear strengths that enhance reproducibility and physical insight. The result could inform both theoretical models of galaxy assembly and observational interpretations of satellite alignments, provided the tracers are shown to act as sufficiently independent drivers.
major comments (2)
- [§4] §4 (alignment statistics): The paper reports separate pairwise correlations of satellite positions with central galaxy orientation, halo triaxiality, and filament direction. No partial correlation analysis or conditioning on the misalignment angles between these tracers (e.g., the angle between halo major axis and filament) is presented. Because centrals align with halos and halos align with filaments, the apparent radial transition in which correlation is strongest could arise from the radial dependence of these inter-tracer alignments rather than from distinct physical regimes acting on the satellites. This directly affects the central claim of a 3σ scale-dependent shift in dominant tracers.
- [§5] §5 (trajectory analysis): The SIMBA orbit tracking demonstrates that satellites intersect and linger along the halo major axis more frequently, explaining the inner-halo alignment. However, this analysis does not test whether the filament alignment signal reported beyond 2 R_200c is independent of the halo-filament correlation that persists outside the virial radius. A conditional measurement of satellite-filament alignment at fixed halo orientation would be required to establish that filaments exert a primary influence at large radii.
minor comments (3)
- [Abstract] Abstract and §3: The phrase 'clear 3σ scale-dependent transition' should be accompanied by a concise statement of the exact statistical test and error estimation procedure used to arrive at the 3σ threshold.
- [§2.3] §2.3 (methods): A short paragraph comparing the adopted filament finder and halo shape algorithm to at least one alternative method would help address possible algorithm-dependent biases in the location of the reported transition radii.
- [Figure 3] Figure 3: The vertical lines marking 0.3 R_200c and 2 R_200c should be added to all panels that display radial trends to facilitate direct visual comparison with the text.
Simulated Author's Rebuttal
We thank the referee for their constructive and detailed report. We appreciate the positive evaluation of our multi-simulation approach and the physical insight from the SIMBA trajectory analysis. The major comments correctly identify the need to demonstrate that the reported scale-dependent transitions reflect independent physical drivers rather than inter-tracer alignments. We address each point below and will incorporate the suggested analyses in the revised manuscript.
read point-by-point responses
-
Referee: [§4] §4 (alignment statistics): The paper reports separate pairwise correlations of satellite positions with central galaxy orientation, halo triaxiality, and filament direction. No partial correlation analysis or conditioning on the misalignment angles between these tracers (e.g., the angle between halo major axis and filament) is presented. Because centrals align with halos and halos align with filaments, the apparent radial transition in which correlation is strongest could arise from the radial dependence of these inter-tracer alignments rather than from distinct physical regimes acting on the satellites. This directly affects the central claim of a 3σ scale-dependent shift in dominant tracers.
Authors: We agree that the absence of partial correlation or conditional analyses leaves open the possibility that the observed radial transitions in dominant tracers could be influenced by the known alignments between centrals, halos, and filaments. Our current results compare the strength of each pairwise correlation versus radius and report a 3σ shift in the dominant correlation, but this does not fully isolate independent effects. In the revised manuscript we will add partial correlation coefficients between satellite positions and each tracer while controlling for the others, as well as explicit conditional measurements (e.g., satellite-filament alignment at fixed halo major-axis orientation). These additions will directly test whether the scale-dependent transitions persist independently of inter-tracer misalignments. revision: yes
-
Referee: [§5] §5 (trajectory analysis): The SIMBA orbit tracking demonstrates that satellites intersect and linger along the halo major axis more frequently, explaining the inner-halo alignment. However, this analysis does not test whether the filament alignment signal reported beyond 2 R_200c is independent of the halo-filament correlation that persists outside the virial radius. A conditional measurement of satellite-filament alignment at fixed halo orientation would be required to establish that filaments exert a primary influence at large radii.
Authors: The referee correctly observes that the SIMBA trajectory analysis is focused on dynamical processing inside the halo and does not directly address independence at r > 2 R_200c. At these large radii most satellites remain unaccreted, so their positions should retain more of the primordial filamentary signal; however, the persistent halo-filament alignment means a conditional test is needed to confirm filaments act as the primary driver. We will therefore add, in the revised manuscript, a measurement of satellite-filament alignment conditioned on halo orientation using the same SIMBA data. This will quantify whether the filament correlation remains significant at fixed halo major axis, thereby strengthening the claim of distinct physical regimes beyond 2 R_200c. revision: yes
Circularity Check
No circularity detected in derivation chain
full rationale
The paper reports empirical statistical measurements of alignment strengths between satellite galaxy distributions and three structural tracers (central galaxy morphology, host halo triaxiality, and large-scale filaments) as a function of radial scale, extracted directly from the outputs of three independent galaxy formation simulations. The claimed 3σ scale-dependent transition is obtained by comparing the measured correlation amplitudes in different radial bins; the kinematic explanation is obtained by direct counting of trajectory intersections and dwell times along the halo major axis within the SIMBA simulation volume. None of these steps involve fitting a parameter to a subset of the data and then relabeling the fit as a prediction, defining one quantity in terms of another that is then re-derived, or invoking a load-bearing self-citation whose own justification reduces to the present work. The analysis is therefore self-contained against the simulation data and does not contain any of the enumerated circularity patterns.
Axiom & Free-Parameter Ledger
axioms (2)
- standard math Standard Lambda-CDM cosmology and Newtonian gravity govern the evolution of the simulated universes.
- domain assumption Halo finders, filament finders, and galaxy morphology measures produce reliable structural tracers.
Reference graph
Works this paper leans on
-
[1]
Bailin, J., Power, C., Norberg, P., Zaritsky, D., & Gibson, B. K. 2008, MNRAS, 390, 1133, doi: 10.1111/j.1365-2966.2008.13828.x
-
[2]
Brainerd, T. G. 2005, ApJL, 628, L101, doi: 10.1086/432713
-
[3]
Cui, W., Power, C., Borgani, S., et al. 2017, MNRAS, 464, 2502, doi: 10.1093/mnras/stw2567 Dav´ e, R., Angl´ es-Alc´ azar, D., Narayanan, D., et al. 2019, MNRAS, 486, 2827, doi: 10.1093/mnras/stz937 De Luca, F., De Petris, M., Yepes, G., et al. 2021, MNRAS, 504, 5383, doi: 10.1093/mnras/stab1073
-
[4]
Forman, R. 2002, S´ eminaire Lotharingien de Combinatoire [electronic only], 48, B48c G´ amez-Mar´ ın, M., Dom´ ınguez-Tenreiro, R., Santos-Santos, I., & Pedrosa, S. E. 2025, MNRAS, 544, 2241, doi: 10.1093/mnras/staf1599 G´ amez-Mar´ ın, M., Santos-Santos, I., Dom´ ınguez-Tenreiro, R., et al. 2024, ApJ, 965, 154, doi: 10.3847/1538-4357/ad27da
-
[5]
Haggar, R., Gray, M. E., Pearce, F. R., et al. 2020, MNRAS, 492, 6074, doi: 10.1093/mnras/staa273
-
[6]
1969, Arkiv for Astronomi, 5, 305
Holmberg, E. 1969, Arkiv for Astronomi, 5, 305
1969
-
[7]
Ibata, N. G., Ibata, R. A., Famaey, B., & Lewis, G. F. 2014, Nature, 511, 563, doi: 10.1038/nature13481
-
[8]
P., Dong, X., et al
Kang, X., Lin, W. P., Dong, X., et al. 2016, in IAU
2016
-
[9]
308, The Zeldovich Universe: Genesis and Growth of the Cosmic Web, ed
Symposium, Vol. 308, The Zeldovich Universe: Genesis and Growth of the Cosmic Web, ed. R. van de Weygaert, S. Shandarin, E. Saar, & J. Einasto, 448–451, doi: 10.1017/S1743921316010346
-
[10]
2007, MNRAS, 378, 910, doi: 10.1111/j.1365-2966.2007.11817.x
Kang, X., van den Bosch, F. C., Yang, X., et al. 2007, MNRAS, 378, 1531, doi: 10.1111/j.1365-2966.2007.11902.x 10 https://github.com/dnarayanan/caesar
-
[11]
Karp, J. S. M., Lange, J. U., & Wechsler, R. H. 2023, ApJL, 949, L13, doi: 10.3847/2041-8213/acd3e9
-
[12]
2005, PASA, 22, 184, doi: 10.1071/AS04059
Knebe, A. 2005, PASA, 22, 184, doi: 10.1071/AS04059
-
[13]
Lee, J., Kang, X., & Jing, Y. P. 2005, ApJL, 629, L5, doi: 10.1086/444496
-
[14]
Jenkins, A. 2007, MNRAS, 374, 16, doi: 10.1111/j.1365-2966.2006.11205.x
-
[15]
P., Welker, C., Nair, S., et al
Madhani, J. P., Welker, C., Nair, S., et al. 2025, arXiv e-prints, arXiv:2504.18515, doi: 10.48550/arXiv.2504.18515
-
[16]
V., Rodriguez, F., & Merch´ an, M
Marsengo-Colazo, A. V., Rodriguez, F., & Merch´ an, M. 2025, A&A, 703, A67, doi: 10.1051/0004-6361/202557043 Mart´ ın-Navarro, I., Pillepich, A., Nelson, D., et al. 2021, Nature, 594, 187, doi: 10.1038/s41586-021-03545-9
-
[17]
2026, ApJ, 998, 251, doi: 10.3847/1538-4357/ae36a0
Meng, Y., Zheng, H., Liao, S., et al. 2026, ApJ, 998, 251, doi: 10.3847/1538-4357/ae36a0
-
[18]
2019, Computational Astrophysics and Cosmology, 6, 2, doi: 10.1186/s40668-019-0028-x
Nelson, D., Springel, V., Pillepich, A., et al. 2019, Computational Astrophysics and Cosmology, 6, 2, doi: 10.1186/s40668-019-0028-x
-
[19]
Nierenberg, A. M., Auger, M. W., Treu, T., Marshall, P. J., & Fassnacht, C. D. 2011, ApJ, 731, 44, doi: 10.1088/0004-637X/731/1/44
-
[20]
2020, MNRAS, 496, 2591, doi: 10.1093/mnras/staa1479
Okabe, T., Oguri, M., Peirani, S., et al. 2020, MNRAS, 496, 2591, doi: 10.1093/mnras/staa1479
-
[21]
2012, MNRAS, 423, 600, doi: 10.1111/j.1365-2966.2012.20901.x
Pawlowski, M. S., Pflamm-Altenburg, J., & Kroupa, P. 2012, MNRAS, 423, 1109, doi: 10.1111/j.1365-2966.2012.20937.x
-
[22]
2011, Journal of Machine Learning Research, 12, 2825
Pedregosa, F., Varoquaux, G., Gramfort, A., et al. 2011, Journal of Machine Learning Research, 12, 2825
2011
-
[23]
Rodriguez, F., Merch´ an, M., & Artale, M. C. 2022, MNRAS, 514, 1077, doi: 10.1093/mnras/stac1428 —. 2024, A&A, 688, A40, doi: 10.1051/0004-6361/202450597 24
-
[24]
Rodriguez, F., Merch´ an, M., Artale, M. C., & Andrews, M. 2023, MNRAS, 521, 5483, doi: 10.1093/mnras/stad924
-
[25]
2025, A&A, 699, A215, doi: 10.1051/0004-6361/202554593
Rodriguez, F., Merch´ an, M., Gal´ arraga-Espinosa, D., et al. 2025, A&A, 699, A215, doi: 10.1051/0004-6361/202554593
-
[26]
Sales, L., & Lambas, D. G. 2004, MNRAS, 348, 1236, doi: 10.1111/j.1365-2966.2004.07443.x
-
[27]
2023, ApJ, 942, 78, doi: 10.3847/1538-4357/aca1c8
Santos-Santos, I., G´ amez-Mar´ ın, M., Dom´ ınguez-Tenreiro, R., et al. 2023, ApJ, 942, 78, doi: 10.3847/1538-4357/aca1c8
-
[28]
Continuous Fields and Discrete Samples: Reconstruction through Delaunay Tessellations
Schaap, W. E., & van de Weygaert, R. 2000, A&A, 363, L29, doi: 10.48550/arXiv.astro-ph/0011007
work page internal anchor Pith review doi:10.48550/arxiv.astro-ph/0011007 2000
-
[29]
Schaye, J., Crain, R. A., Bower, R. G., et al. 2015, MNRAS, 446, 521, doi: 10.1093/mnras/stu2058
-
[30]
Shao, S., Cautun, M., Frenk, C. S., et al. 2016, MNRAS, 460, 3772, doi: 10.1093/mnras/stw1247
-
[31]
Smith, R., Hwang, H. S., Kraljic, K., et al. 2023, MNRAS, 525, 4685, doi: 10.1093/mnras/stad2535
-
[32]
2012, MNRAS, 420, 1825, doi: 10.1111/j.1365-2966.2011.19805.x
Sousbie, T. 2011, MNRAS, 414, 350, doi: 10.1111/j.1365-2966.2011.18394.x
-
[33]
2012, MNRAS, 420, 1825, doi: 10.1111/j.1365-2966.2011.19805.x
Sousbie, T., Pichon, C., & Kawahara, H. 2011, MNRAS, 414, 384, doi: 10.1111/j.1365-2966.2011.18395.x
-
[34]
Stephenson, H. M. O., Stott, J. P., Butler, J., Webster, M., & Head, J. 2025, MNRAS, 537, 1542, doi: 10.1093/mnras/staf120
-
[35]
2020, ApJ, 893, 87, doi: 10.3847/1538-4357/ab8292
Tang, L., Lin, W., & Wang, Y. 2020, ApJ, 893, 87, doi: 10.3847/1538-4357/ab8292
-
[36]
Tempel, E., Guo, Q., Kipper, R., & Libeskind, N. I. 2015, MNRAS, 450, 2727, doi: 10.1093/mnras/stv919
-
[37]
2024, MNRAS, 535, 3775, doi: 10.1093/mnras/stae2632
Uzeirbegovic, E., Martin, G., Kaviraj, S., et al. 2024, MNRAS, 535, 3775, doi: 10.1093/mnras/stae2632
-
[38]
Wang, P., Libeskind, N. I., Tempel, E., et al. 2020, ApJ, 900, 129, doi: 10.3847/1538-4357/aba6ea
-
[39]
2018, ApJ, 859, 115, doi: 10.3847/1538-4357/aabe2b
Wang, P., Luo, Y., Kang, X., et al. 2018, ApJ, 859, 115, doi: 10.3847/1538-4357/aabe2b
-
[40]
Wang, Y. O., Lin, W. P., Kang, X., et al. 2014, ApJ, 786, 8, doi: 10.1088/0004-637X/786/1/8
-
[41]
Yang, X., van den Bosch, F. C., Mo, H. J., et al. 2006, MNRAS, 369, 1293, doi: 10.1111/j.1365-2966.2006.10373.x
-
[42]
2025, A&A, 693, A113, doi: 10.1051/0004-6361/202452296
Zakharova, D., McGee, S., Vulcani, B., & De Lucia, G. 2025, A&A, 693, A113, doi: 10.1051/0004-6361/202452296
-
[43]
Zentner, A. R. 2006, in EAS Publications Series, Vol. 20, EAS Publications Series, ed. G. A. Mamon, F. Combes, C. Deffayet, & B. Fort (EDP), 41–46, doi: 10.1051/eas:2006044
-
[44]
Zentner, A. R., Kravtsov, A. V., Gnedin, O. Y., & Klypin, A. A. 2005, ApJ, 629, 219, doi: 10.1086/431355
-
[45]
Zhang, B., Cui, W., Wang, Y., Dave, R., & De Petris, M. 2022, MNRAS, 516, 26, doi: 10.1093/mnras/stac2171
-
[46]
2013, ApJ, 779, 160, doi: 10.1088/0004-637X/779/2/160
Zhang, Y., Yang, X., Wang, H., et al. 2013, ApJ, 779, 160, doi: 10.1088/0004-637X/779/2/160
discussion (0)
Sign in with ORCID, Apple, or X to comment. Anyone can read and Pith papers without signing in.