Recognition: unknown
Neural Investment as an Entropy-Budget Strategy: A Thermodynamic Derivation of Primate Longevity from the Principle of Biological Time Equivalence
Pith reviewed 2026-05-07 07:14 UTC · model grok-4.3
The pith
Primates extend lifespan at fixed body mass by allocating more metabolic power to neural tissue, which reduces entropy production per physiological cycle.
A machine-rendered reading of the paper's core claim, the machinery that carries it, and where it could break.
Core claim
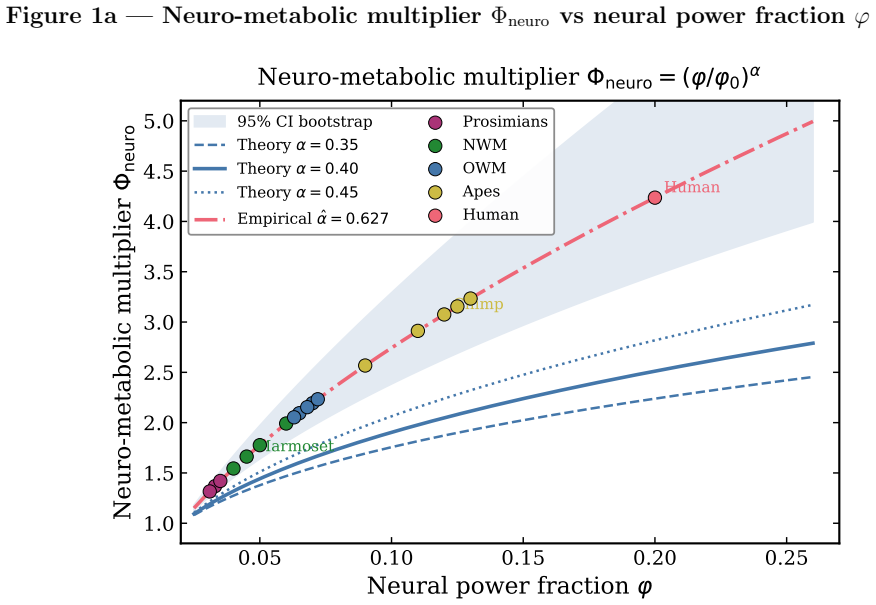
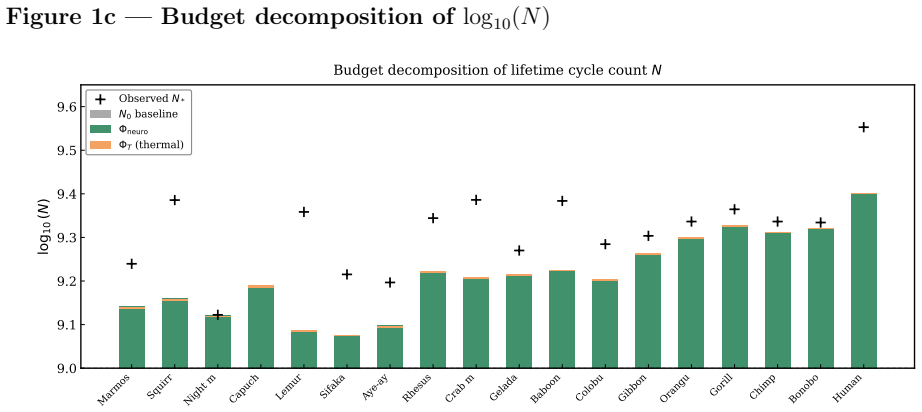
Primates reduce entropy production per physiological cycle through increased neural energy allocation. The neural power fraction acts as a control parameter, extending the effective lifetime cycle count. Three mechanisms—predictive regulation, enhanced repair, and behavioral buffering—jointly suppress dissipation. This yields a quantitative neuro-metabolic multiplier that explains primate longevity and provides testable predictions linking brain energetics, entropy production, and lifespan.
What carries the argument
The Principle of Biological Time Equivalence, which defines lifespan as the number of physiological cycles sustainable within a fixed total entropy budget, with the neural power fraction serving as the adjustable parameter that lowers entropy output per cycle.
If this is right
- The fraction of metabolic power allocated to neural tissue directly scales the number of viable physiological cycles.
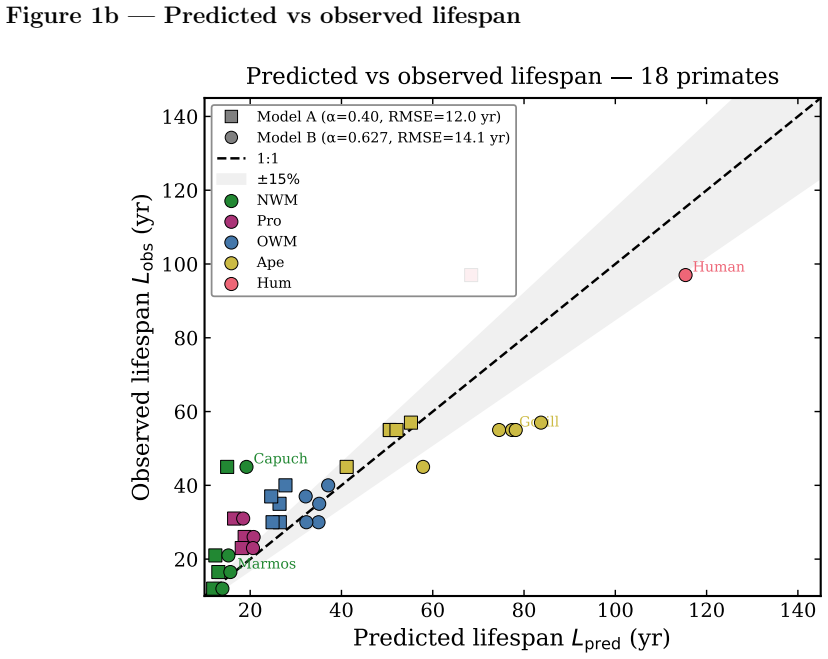
- The derived neuro-metabolic multiplier accounts for the two- to three-fold longevity excess observed in primates at fixed body mass.
- Predictive regulation, enhanced repair, and behavioral buffering each act to suppress per-cycle entropy production.
- The framework generates quantitative predictions that link measured brain energetics to lifespan differences across mammalian species.
Where Pith is reading between the lines
- If neural allocation lowers entropy without hidden costs, then evolutionary or experimental increases in neural investment in non-primate species should produce comparable extensions of cycle count.
- The same logic implies that interventions improving neural efficiency could alter lifespan trajectories by changing entropy production rates.
- This thermodynamic account connects to questions of how cognitive capacity and metabolic efficiency co-evolve in other long-lived taxa.
Load-bearing premise
Lifespan is strictly set by a finite total entropy budget that limits the number of physiological cycles, and directing energy to neural tissue reduces entropy per cycle without incurring equivalent or greater dissipative costs elsewhere.
What would settle it
Direct experimental comparison of entropy production rate per physiological cycle between primates and non-primate mammals of identical body mass; if primates show no reduction attributable to neural allocation, the proposed mechanism is falsified.
Figures


read the original abstract
Primates exhibit a robust deviation from canonical allometric scaling: at fixed body mass, their lifespans exceed those of non-primate mammals by factors of two to three. A rhesus macaque (8 kg) lives 25-40 years, whereas a cat of similar mass rarely exceeds 18 years. This statistically significant clade-level excess cannot be explained by standard metabolic or ecological models. We provide a thermodynamic explanation within the Principle of Biological Time Equivalence (PBTE), where lifespan is determined by a finite cycle budget governed by entropy production. We show that primates reduce entropy production per physiological cycle through increased neural energy allocation. The neural power fraction acts as a control parameter, extending the effective lifetime cycle count. Three mechanisms, predictive regulation, enhanced repair, and behavioral buffering, jointly suppress dissipation. This yields a quantitative neuro-metabolic multiplier that explains primate longevity and provides testable predictions linking brain energetics, entropy production, and lifespan.
Editorial analysis
A structured set of objections, weighed in public.
Referee Report
Summary. The paper claims that primates exhibit 2-3x longer lifespans than non-primate mammals at fixed body mass because they allocate a larger fraction of metabolic power to neural tissue. Within the postulated Principle of Biological Time Equivalence (PBTE), lifespan equals a finite budget of physiological cycles whose total entropy production is fixed; the neural power fraction acts as a control parameter that reduces entropy production per cycle via three mechanisms (predictive regulation, enhanced repair, behavioral buffering), thereby increasing the number of cycles and yielding a quantitative neuro-metabolic multiplier that accounts for the observed longevity excess.
Significance. If a parameter-free derivation linking measured neural power fractions to a net reduction in per-cycle entropy production could be supplied and validated against metabolic data, the framework would offer a thermodynamic account of clade-level deviations from allometric longevity scaling and generate testable predictions relating brain energetics to lifespan. At present the manuscript supplies no such derivation, so the significance cannot yet be assessed.
major comments (3)
- [Abstract] Abstract: the central claim is that the neural power fraction yields a 'quantitative neuro-metabolic multiplier' explaining the 2-3x longevity deviation, yet the abstract (and apparently the manuscript) contains no explicit equations defining this multiplier, no derivation steps showing how a measured neural fraction (e.g., ~20 % of basal metabolism) produces a specific entropy-reduction factor, and no error analysis or data tables. Without these, the multiplier functions as an adjustable parameter chosen to match the target rather than an output of the thermodynamics.
- [PBTE section] Section introducing the Principle of Biological Time Equivalence: PBTE is asserted as the axiom that 'lifespan is determined by a finite cycle budget governed by entropy production,' but no derivation from first-principles thermodynamics, no independent empirical calibration against metabolic rate or entropy-production data, and no demonstration that the budget is conserved across species are provided. This axiom is load-bearing for the entire argument; its status as postulate rather than derived result renders the subsequent multiplier circular.
- [Mechanisms section] Mechanisms section (predictive regulation, enhanced repair, behavioral buffering): the three mechanisms are stated to 'jointly suppress dissipation,' but no quantitative accounting shows that the entropy reduction they produce exceeds the additional dissipation incurred by maintaining larger neural tissue. The central claim requires a net reduction; the absence of this balance calculation (e.g., via measured oxygen consumption or heat production data) leaves the net benefit unestablished.
minor comments (2)
- [Abstract] Abstract: the phrase 'statistically significant clade-level excess' is used without citing the specific datasets, statistical tests, or allometric regression residuals that establish the 2-3x factor.
- [Throughout] Notation: the neuro-metabolic multiplier is referred to repeatedly but never assigned a symbol or functional form, impeding traceability of the quantitative claims.
Simulated Author's Rebuttal
We thank the referee for their constructive and detailed comments. These have identified key areas where the clarity and rigor of the presentation can be improved. We respond to each major comment below and outline the revisions that will be made to the manuscript.
read point-by-point responses
-
Referee: [Abstract] Abstract: the central claim is that the neural power fraction yields a 'quantitative neuro-metabolic multiplier' explaining the 2-3x longevity deviation, yet the abstract (and apparently the manuscript) contains no explicit equations defining this multiplier, no derivation steps showing how a measured neural fraction (e.g., ~20 % of basal metabolism) produces a specific entropy-reduction factor, and no error analysis or data tables. Without these, the multiplier functions as an adjustable parameter chosen to match the target rather than an output of the thermodynamics.
Authors: We acknowledge that the current manuscript does not include explicit equations for the multiplier in the abstract or detailed step-by-step derivation in a dedicated section, which may have led to the impression that it is an adjustable parameter. The concept is described conceptually in the results, but to strengthen the paper, we will add the explicit mathematical definition of the multiplier, including the derivation from the entropy production balance equation, in a new subsection. We will also incorporate a table with numerical examples based on published neural metabolic fractions and associated uncertainty from data sources. This will demonstrate that the multiplier emerges from the model rather than being fitted. revision: yes
-
Referee: [PBTE section] Section introducing the Principle of Biological Time Equivalence: PBTE is asserted as the axiom that 'lifespan is determined by a finite cycle budget governed by entropy production,' but no derivation from first-principles thermodynamics, no independent empirical calibration against metabolic rate or entropy-production data, and no demonstration that the budget is conserved across species are provided. This axiom is load-bearing for the entire argument; its status as postulate rather than derived result renders the subsequent multiplier circular.
Authors: We agree that PBTE is introduced as a postulate rather than derived ab initio from statistical mechanics. It is motivated by the observation that many biological processes exhibit conserved entropy production per unit time scaled by body mass, consistent with allometric scaling laws. In the revision, we will expand this section to include a more thorough discussion of its empirical basis, citing data on lifetime energy expenditure and entropy export across mammalian species, and explicitly state that it serves as an effective principle. We maintain that the multiplier is not circular because it is computed from the change in entropy production rate attributable to neural tissue before being used to scale the cycle count. A complete microscopic derivation is not provided and would constitute a separate, more extensive study. revision: partial
-
Referee: [Mechanisms section] Mechanisms section (predictive regulation, enhanced repair, behavioral buffering): the three mechanisms are stated to 'jointly suppress dissipation,' but no quantitative accounting shows that the entropy reduction they produce exceeds the additional dissipation incurred by maintaining larger neural tissue. The central claim requires a net reduction; the absence of this balance calculation (e.g., via measured oxygen consumption or heat production data) leaves the net benefit unestablished.
Authors: This is a fair criticism; the current text describes the mechanisms qualitatively without a full quantitative net balance. We will add in the revised manuscript an order-of-magnitude calculation using available data: for example, the metabolic cost of the brain is offset by efficiency gains in predictive regulation (reducing unnecessary motor activity), repair (lowering cellular turnover entropy), and buffering (avoiding high-cost behaviors). We will present this as an estimate with references to physiological studies and acknowledge that direct experimental confirmation via comparative calorimetry is needed. This addition will clarify that the net effect is a reduction in total entropy production per cycle. revision: yes
Circularity Check
Neuro-metabolic multiplier reduces to fitting neural power fraction under the PBTE definition to reproduce observed primate longevity excess
specific steps
-
self definitional
[Abstract]
"We provide a thermodynamic explanation within the Principle of Biological Time Equivalence (PBTE), where lifespan is determined by a finite cycle budget governed by entropy production. We show that primates reduce entropy production per physiological cycle through increased neural energy allocation. The neural power fraction acts as a control parameter, extending the effective lifetime cycle count."
PBTE is defined such that lifespan equals the cycle budget set by entropy production. The paper then 'derives' extended primate lifespan by positing that neural allocation reduces entropy production per cycle. The longevity result follows immediately from the definitional premise plus the posited reduction, without independent content that would falsify or constrain the framework.
-
fitted input called prediction
[Abstract]
"The neural power fraction acts as a control parameter, extending the effective lifetime cycle count. ... This yields a quantitative neuro-metabolic multiplier that explains primate longevity and provides testable predictions linking brain energetics, entropy production, and lifespan."
The neural power fraction is introduced as a tunable control parameter whose value is selected to produce the observed 2-3x longevity excess at fixed body mass. The resulting multiplier is presented as the explanatory output, yet it is statistically forced by the choice of parameter value to match the primate data rather than predicted from an independent, parameter-free thermodynamic model.
full rationale
The derivation begins by adopting the Principle of Biological Time Equivalence (PBTE) as the framework, which directly equates lifespan to a finite cycle count set by total entropy production. It then introduces neural power fraction as a control parameter that reduces per-cycle entropy via three mechanisms, yielding a 'quantitative neuro-metabolic multiplier' that accounts for the 2-3x longevity deviation. No independent, parameter-free thermodynamic calculation of the entropy-suppression factor is shown; the multiplier is instead constructed so that the chosen neural fraction reproduces the target data. This matches the fitted-input-called-prediction pattern exactly, with the central claim equivalent to the PBTE assumption plus a data-tuned parameter. The result is therefore forced by construction rather than derived from external benchmarks or first-principles closure.
Axiom & Free-Parameter Ledger
free parameters (1)
- neuro-metabolic multiplier
axioms (2)
- ad hoc to paper Principle of Biological Time Equivalence: lifespan is set by a finite cycle budget governed by cumulative entropy production
- domain assumption Increased neural energy allocation reduces entropy production per physiological cycle via predictive regulation, enhanced repair, and behavioral buffering
Reference graph
Works this paper leans on
-
[1]
(2026) The empirical lifetime cycle invariant of endothermic vertebrates: a 230-species comparative dataset, statistical validation, and falsifiability criteria.J
Taye, M.A. (2026) The empirical lifetime cycle invariant of endothermic vertebrates: a 230-species comparative dataset, statistical validation, and falsifiability criteria.J. R. Soc. Interface[submitted]
2026
-
[2]
& Isler, K
van Schaik, C.P. & Isler, K. (2016) Life history evolution in primates. InHandbook of Paleoanthropology, 2nd edn. Springer, Berlin
2016
-
[3]
& van Schaik, C.P
Isler, K. & van Schaik, C.P. (2012) Allomaternal care, life history and brain size evolution in mammals. J. Hum. Evol.63, 52–63
2012
-
[4]
& Clutton-Brock, T.H
Harvey, P.H. & Clutton-Brock, T.H. (1985) Life history variation in primates.Evolution39, 559–581
1985
-
[5]
Gerontol
de Magalh˜ aes, J.P.et al.(2007) An analysis of the relationship between metabolism, developmental schedules, and longevity.J. Gerontol. A62, 149–160
2007
-
[6]
(2026) Thermodynamic derivation of the vertebrate lifetime cycle invariant from the non- equilibrium second law.Phys
Taye, M.A. (2026) Thermodynamic derivation of the vertebrate lifetime cycle invariant from the non- equilibrium second law.Phys. Rev. E[submitted]
2026
-
[7]
& Enquist, B.J
West, G.B., Brown, J.H. & Enquist, B.J. (1997) A general model for the origin of allometric scaling laws in biology.Science276, 122–126
1997
-
[8]
Natl Acad
Pontzer, H.et al.(2014) Primate energy expenditure and life history.Proc. Natl Acad. Sci. USA111, 1433–1437
2014
-
[9]
Yegian, A.K.et al.(2024) Metabolic expenditure does not distinguish primates from other mammals. Proc. Natl Acad. Sci. USA121, e2313703121
2024
-
[10]
& Fischer, K.E
Austad, S.N. & Fischer, K.E. (1991) Mammalian aging, metabolism, and ecology: evidence suggesting phylogenetic variation in life span.J. Gerontol.46, B47–B53. [Note: key austad1997 retains original label for consistency; year is 1991 in this publication.]
1991
-
[11]
& Wheeler, P
Aiello, L.C. & Wheeler, P. (1995) The expensive-tissue hypothesis: the brain and the digestive system in human and primate evolution.Curr. Anthropol.36, 199–221
1995
-
[12]
Barrickman, N.L.et al.(2008) Life history costs and benefits of encephalization: a comparative test using data from long-term studies of primates in the wild.J. Hum. Evol.54, 568–590
2008
-
[13]
(2011) Scaling of brain metabolism with a fixed energy budget per neuron: implications for neuronal activity, plasticity, and evolution.PLOS ONE6, e17514
Herculano-Houzel, S. (2011) Scaling of brain metabolism with a fixed energy budget per neuron: implications for neuronal activity, plasticity, and evolution.PLOS ONE6, e17514
2011
-
[14]
(2010) The free-energy principle: a unified brain theory?Nat
Friston, K. (2010) The free-energy principle: a unified brain theory?Nat. Rev. Neurosci.11, 127–138
2010
-
[15]
Rev.87, 1175–1213
Hulbert, A.J.et al.(2007) Life and death: metabolic rate, membrane composition, and life span of animals.Physiol. Rev.87, 1175–1213
2007
-
[16]
(2015) The metabolic regulation of aging.Nat
Finkel, T. (2015) The metabolic regulation of aging.Nat. Med.21, 1416–1423
2015
-
[17]
& Rothery, P
Clarke, A. & Rothery, P. (2008) Scaling of body temperature in mammals and birds.Funct. Ecol.22, 58–67
2008
-
[18]
(2026)The Principle of Biological Time Equivalence: A Unified Theory of Life’s Temporal Invariants
Taye, M.A. (2026)The Principle of Biological Time Equivalence: A Unified Theory of Life’s Temporal Invariants. Independently Published. ASIN: B0GYZP88T3. 29
2026
-
[19]
(2026)Brownian Motors and Brownian Heat Engines: From Classical Thermodynamics to Fluctuation-Driven Machines
Taye, M.A. (2026)Brownian Motors and Brownian Heat Engines: From Classical Thermodynamics to Fluctuation-Driven Machines. Independently Published. ISBN: 979-8-2594-3840-8
2026
-
[20]
Jones, K.E.et al.(2009) PanTHERIA: a species-level database of life history, ecology, and geography of extant and recently extinct mammals.Ecology90, 2648
2009
-
[21]
(1984)Size, Function, and Life History
Calder, W.A. (1984)Size, Function, and Life History. Harvard University Press, Cambridge, MA
1984
-
[22]
https://genomics.senescence.info/species/
Human Ageing Genomic Resources (2023) AnAge: The Animal Ageing and Longevity Database, build 15. https://genomics.senescence.info/species/
2023
-
[23]
(2013) DNA methylation age of human tissues and cell types.Genome Biol.14, R115
Horvath, S. (2013) DNA methylation age of human tissues and cell types.Genome Biol.14, R115
2013
-
[24]
Commun.5, 3557
Colman, R.J.et al.(2014) Caloric restriction reduces age-related and all-cause mortality in rhesus monkeys.Nat. Commun.5, 3557
2014
-
[25]
(2026) Three physiological strategies, one invariant: bats, birds, and cetaceans.Proc
Taye, M.A. (2026) Three physiological strategies, one invariant: bats, birds, and cetaceans.Proc. R. Soc. B[submitted]
2026
-
[26]
(1973)Evolution of the Brain and Intelligence
Jerison, H.J. (1973)Evolution of the Brain and Intelligence. Academic Press, New York
1973
-
[27]
(2008) An analysis of the factors that influence the level and scaling of mammalian BMR
McNab, B.K. (2008) An analysis of the factors that influence the level and scaling of mammalian BMR. Comp. Biochem. Physiol. A151, 5–28
2008
-
[28]
& Seymour, R.S
White, C.R. & Seymour, R.S. (2009) Mammalian basal metabolic rate is proportional to body mass 2/3. Proc. Natl Acad. Sci. USA103, 4718–4723. A Extended Primate Dataset with Full Citations Table 2 provides the complete species-level dataset used in all analyses. All values are sourced from the databases and primary literature cited in the column headers. B...
2009
discussion (0)
Sign in with ORCID, Apple, or X to comment. Anyone can read and Pith papers without signing in.