Recognition: unknown
LNODE: latent dynamics reveal the shared spatiotemporal structure of amyloid-β progression
Pith reviewed 2026-05-09 19:20 UTC · model grok-4.3
The pith
A regional neural ODE with latent states captures shared patterns of amyloid-beta buildup and predicts future PET scans years ahead using few parameters per subject.
A machine-rendered reading of the paper's core claim, the machinery that carries it, and where it could break.
Core claim
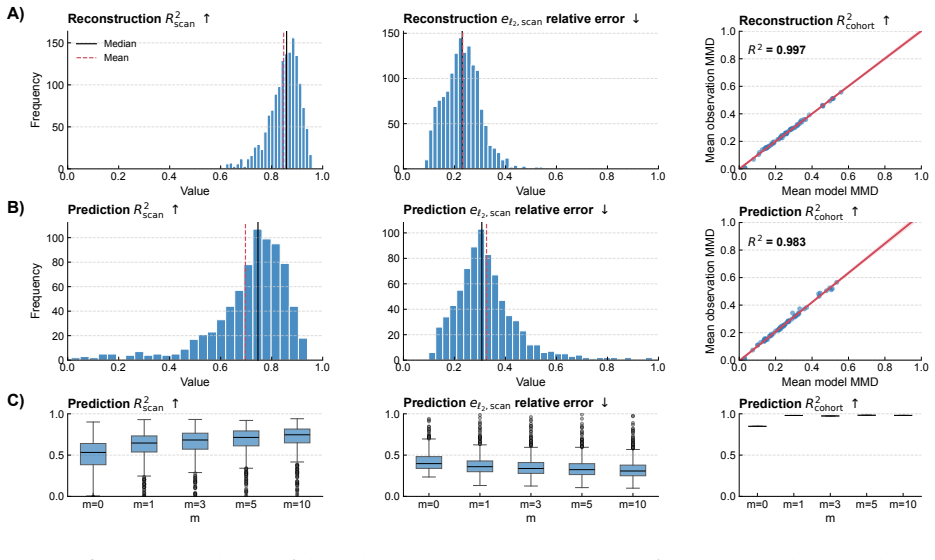
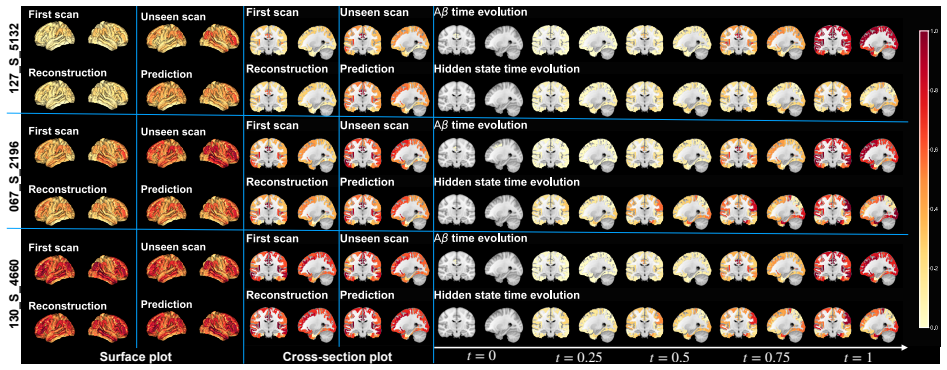
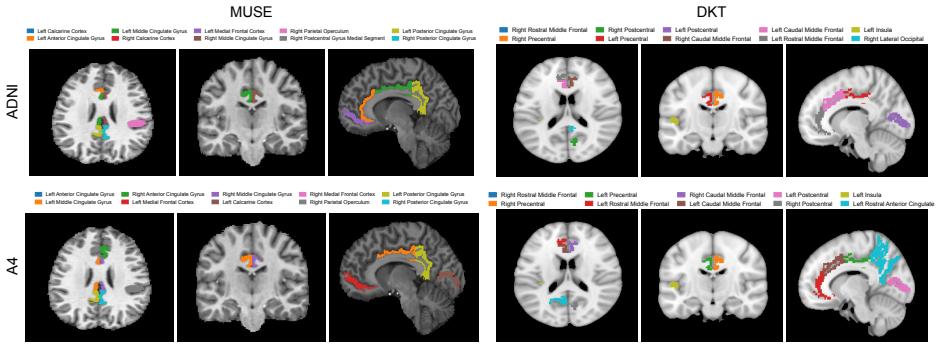
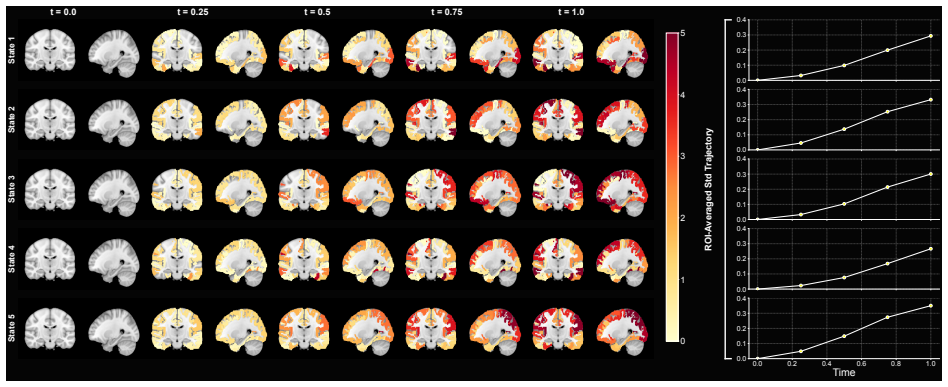
LNODE is formulated as a regional neural ordinary differential equation model that incorporates a latent-state representation modulating Aβ dynamics, with temporal evolution governed by cohort-shared parameters. When jointly calibrated on 1461 ADNI subjects and 1070 A4 subjects using MUSE and DKT atlases, it captures spatial propagation, proliferation, and clearance of amyloid beta, achieving R² greater than 0.99 on both datasets and accurate predictions on held-out follow-up scans including intervals exceeding four years, while latent-state clustering reveals distinct subgroups consistent with Alzheimer's progression subtypes.
What carries the argument
The latent-state representation within the regional neural ODE, which modulates Aβ dynamics via cohort-shared parameters for temporal evolution while permitting subject-specific deviations.
If this is right
- The model enables fusion and harmonization of Aβ PET scans across cohorts for quantitative analysis.
- It supports forecasting of amyloid-beta signals in future scans even with multi-year gaps between observations.
- Latent-state clustering identifies distinct subgroups consistent with different Alzheimer's progression subtypes.
- Strong parameter identifiability and stability properties are supported by synthetic experiments and Hessian analysis.
- Intentional underparameterization reduces overfitting and spurious correlations while maintaining high fit accuracy.
Where Pith is reading between the lines
- The shared-parameter structure could be tested for transferability to other imaging modalities or biomarkers to build integrated progression models.
- If the latent clusters remain stable across datasets, they might serve as a basis for stratifying patients in future studies of disease modifiers.
- The parsimonious parameterization suggests potential scalability to larger multimodal datasets without proportional increases in subject-specific variables.
Load-bearing premise
The underparameterized regional neural ODE with latent states truly captures the underlying biological spatiotemporal dynamics of amyloid-beta progression instead of merely fitting observed imaging patterns, and the resulting clusters reflect biologically meaningful subtypes.
What would settle it
Application of the calibrated model to an independent cohort with different PET protocols or extended follow-up intervals where predictive accuracy on unseen scans drops substantially below 0.99 or where latent-state clusters fail to align with independent clinical or genetic markers of progression.
Figures


read the original abstract
We introduce LNODE, a mechanism-based phenomenological model for amyloid beta (A$\beta$) dynamics, calibrated using positron emission tomography (PET) imaging. A$\beta$ is a key biomarker of Alzheimer's disease. LNODE is designed to support the fusion, harmonization, quantitative analysis, and interpretation of Abeta PET scans. We evaluate LNODE on 1461 subjects in the ADNI cohort and 1070 subjects in the A4 Study, using MUSE and DKT anatomical atlases. LNODE is formulated as a regional neural ordinary differential equation (ODE) model that is jointly calibrated on all available scans within a cohort. The model captures the spatial propagation, proliferation, and clearance of A$\beta$ and incorporates a latent-state representation that modulates A$\beta$ dynamics. The temporal evolution of these latent states is governed by cohort-shared parameters, enabling LNODE to represent both population-level trajectories and subject-specific deviations. The proposed model demonstrates strong parameter identifiability and stability properties, supported by synthetic experiments and analytical analysis of the Hessian condition number. To mitigate overfitting and reduce spurious correlations, LNODE is intentionally underparameterized, employing approximately five to ten parameters per subject. Despite this parsimonious parameterization, LNODE achieves $R^2 > 0.99$ in both the ADNI and A4 datasets. LNODE exhibits strong predictive performance: in the A4 cohort, it accurately forecasts the A$\beta$ PET signal in previously unseen follow-up scans, including cases with inter-scan intervals exceeding four years. Clustering in the learned latent-state space reveals distinct subgroups, consistent with the existence of different subtypes of Alzheimer's disease progression.
Editorial analysis
A structured set of objections, weighed in public.
Referee Report
Summary. The paper introduces LNODE, a regional neural ODE model with a latent-state representation for modeling the spatiotemporal dynamics of amyloid-β (Aβ) progression from PET scans. It is jointly calibrated on cohorts from ADNI (1461 subjects) and A4 (1070 subjects) using MUSE and DKT atlases, claims R² > 0.99 despite using only 5–10 parameters per subject, demonstrates predictive accuracy on held-out future scans (including intervals >4 years), and uses clustering in latent space to identify subgroups consistent with distinct AD progression subtypes. Synthetic experiments and Hessian analysis are cited to support identifiability and stability.
Significance. If the central claims hold after addressing evaluation concerns, LNODE could provide a parsimonious, mechanism-based framework for harmonizing Aβ PET data and forecasting progression, with potential utility in subtype stratification. The intentional underparameterization and reported synthetic validation for identifiability are methodological strengths that distinguish it from purely data-driven approaches.
major comments (4)
- [Abstract] Abstract: the claim that LNODE 'accurately forecasts the Aβ PET signal in previously unseen follow-up scans' is at risk of circularity because the model is 'jointly calibrated on all available scans within a cohort'; the manuscript must explicitly describe the train/test split, how subject-specific parameters are estimated without future data, and whether predictions are truly out-of-sample for each subject.
- [Abstract] Abstract and results: no quantitative error bars, confidence intervals, or explicit baseline comparisons (e.g., to linear mixed-effects models, standard neural ODEs without latent states, or existing Aβ progression models) are reported despite R² > 0.99 and multi-year predictive claims; this omission makes it impossible to assess whether the performance exceeds what simpler models achieve.
- [Abstract] Abstract: the statement that 'clustering in the learned latent-state space reveals distinct subgroups, consistent with the existence of different subtypes' lacks any description of the clustering algorithm, robustness checks (e.g., stability across initializations or subsamples), or correlation with independent markers such as APOE genotype, cognitive scores, or other biomarkers; without this, the biological interpretation remains unsupported.
- [Abstract] Abstract: the assertion of 'strong parameter identifiability and stability properties, supported by synthetic experiments' is load-bearing for the underparameterized claim, yet the manuscript provides no quantitative metrics (e.g., recovery error, condition numbers across noise levels) or tests that directly address whether the latent dynamics recover ground-truth subtypes versus statistical artifacts in the PET data.
minor comments (1)
- [Abstract] Abstract: the roles of the MUSE and DKT atlases are mentioned without indicating whether results are consistent across atlases or if one is primary.
Simulated Author's Rebuttal
We thank the referee for their constructive and detailed comments. These have identified important areas where the manuscript can be clarified and strengthened. We address each major comment point by point below, with commitments to specific revisions.
read point-by-point responses
-
Referee: [Abstract] Abstract: the claim that LNODE 'accurately forecasts the Aβ PET signal in previously unseen follow-up scans' is at risk of circularity because the model is 'jointly calibrated on all available scans within a cohort'; the manuscript must explicitly describe the train/test split, how subject-specific parameters are estimated without future data, and whether predictions are truly out-of-sample for each subject.
Authors: We agree that the abstract phrasing risks implying circularity and will revise it for precision. The shared cohort-level parameters are estimated jointly, but the predictive evaluation holds out future scans per subject: subject-specific latent states and parameters are fit using only scans up to the start of the prediction window, after which the model is integrated forward without access to the held-out data. We will add an explicit Methods subsection detailing the train/test split, the per-subject hold-out protocol, and confirmation that all reported multi-year forecasts are out-of-sample. revision: yes
-
Referee: [Abstract] Abstract and results: no quantitative error bars, confidence intervals, or explicit baseline comparisons (e.g., to linear mixed-effects models, standard neural ODEs without latent states, or existing Aβ progression models) are reported despite R² > 0.99 and multi-year predictive claims; this omission makes it impossible to assess whether the performance exceeds what simpler models achieve.
Authors: We concur that error bars and baselines are necessary to interpret the reported performance. In revision we will add bootstrap-derived confidence intervals for all R² and prediction-error metrics. We will also include quantitative comparisons against linear mixed-effects models and standard neural ODEs (without latent states) on identical held-out prediction tasks, reporting mean errors, statistical significance, and results in a new table and figure in the Results section. revision: yes
-
Referee: [Abstract] Abstract: the statement that 'clustering in the learned latent-state space reveals distinct subgroups, consistent with the existence of different subtypes' lacks any description of the clustering algorithm, robustness checks (e.g., stability across initializations or subsamples), or correlation with independent markers such as APOE genotype, cognitive scores, or other biomarkers; without this, the biological interpretation remains unsupported.
Authors: We will expand the subtype analysis description. The revised manuscript will specify the clustering algorithm, cluster-number selection criterion, and provide robustness checks (stability across random initializations and bootstrap subsamples). We will also report correlations of the resulting clusters with APOE genotype, cognitive scores, and additional biomarkers, accompanied by a new supplementary figure. revision: yes
-
Referee: [Abstract] Abstract: the assertion of 'strong parameter identifiability and stability properties, supported by synthetic experiments' is load-bearing for the underparameterized claim, yet the manuscript provides no quantitative metrics (e.g., recovery error, condition numbers across noise levels) or tests that directly address whether the latent dynamics recover ground-truth subtypes versus statistical artifacts in the PET data.
Authors: The synthetic recovery experiments and Hessian analysis appear in the Supplementary Information. We will move key quantitative results into the main text, adding tables of parameter recovery error across noise levels, Hessian condition numbers, and explicit tests on synthetic data with known ground-truth subtypes. These additions will directly address recovery of structure versus artifacts. revision: yes
Circularity Check
Joint calibration on all scans risks making 'unseen follow-up' forecasts reduce to in-sample interpolation rather than independent extrapolation.
specific steps
-
fitted input called prediction
[Abstract]
"LNODE is formulated as a regional neural ordinary differential equation (ODE) model that is jointly calibrated on all available scans within a cohort. [...] Despite this parsimonious parameterization, LNODE achieves R² > 0.99 in both the ADNI and A4 datasets. LNODE exhibits strong predictive performance: in the A4 cohort, it accurately forecasts the Aβ PET signal in previously unseen follow-up scans, including cases with inter-scan intervals exceeding four years."
The model parameters and latent states are calibrated jointly to the entire set of scans; the subsequent claim of forecasting 'previously unseen follow-up scans' therefore reduces to evaluating the same fitted dynamics on held-in data rather than demonstrating out-of-sample extrapolation.
full rationale
The paper's central modeling step is a regional neural ODE with latent states that is explicitly jointly calibrated to the full cohort data. The abstract then presents R² > 0.99 and 'strong predictive performance' on previously unseen follow-up scans as evidence of generalization. Because the calibration description encompasses all available scans and no separate hold-out protocol is quoted in the provided text, the reported forecasts cannot be shown to be fully independent of the fitted quantities. This constitutes a moderate instance of fitted-input-called-prediction without invalidating the overall mechanistic formulation or the R² fit itself. No self-citation chains, self-definitional equations, or ansatz smuggling are present.
Axiom & Free-Parameter Ledger
free parameters (2)
- subject-specific parameters
- cohort-shared parameters
axioms (2)
- domain assumption Aβ dynamics can be represented by a system of regional neural ordinary differential equations
- domain assumption Latent states modulate Aβ dynamics with temporal evolution governed by cohort-shared parameters
invented entities (1)
-
latent-state representation
no independent evidence
Reference graph
Works this paper leans on
-
[1]
Amyloid beta deposition, neurodegeneration, and cognitive decline in sporadic Alzheimer’s disease: a prospective cohort study
Villemagne, Victor L et al. Amyloid beta deposition, neurodegeneration, and cognitive decline in sporadic Alzheimer’s disease: a prospective cohort study. The Lancet Neurology12, 357 - 367 (2013)
2013
-
[2]
Rosenberg, Yun Zhou, Anil Kumar, Vanessa Raymont, Hayden T
Wong, Dean F., Paul B. Rosenberg, Yun Zhou, Anil Kumar, Vanessa Raymont, Hayden T. Ravert, Robert F. Dannals et al. In vivo imaging of amyloid deposition in Alzheimer disease using the radioligand 18F-AV-45 (flobetapir F 18). Journal of nuclear medicine51, 913-920 (2010)
2010
-
[3]
Pereira, Jesse A
Vogel, Jacob W., Nick Corriveau-Lecavalier, Nicolai Franzmeier, Joana B. Pereira, Jesse A. Brown, Anne Maass, Hugo Botha et al. Connectome-based modelling of neurodegenerative diseases: towards precision medicine and mechanistic insight. Nature Reviews Neuroscience24, 620-639 (2023)
2023
-
[4]
Knopman, William J
Jack, Clifford R., David S. Knopman, William J. Jagust, Ronald C. Petersen, Michael W. Weiner, Paul S. Aisen, Leslie M. Shaw et al. Tracking pathophysiological processes in Alzheimer’s disease: an updated hypothetical model of dynamic biomarkers. The lancet neurology12, 207-216 (2013)
2013
-
[5]
R. C. Petersen, P. S. Aisen, L. A. Beckett, M. C. Donohue, A. C. Gamst, D. J. Harvey, C. R. Jack, W. J. Jagust, L. M. Shaw, A. W. Toga, J. Q. Trojanowski, & M. W. Weiner. Alzheimer’s disease neuroimaging initiative (ADNI) clinical characterization. Neurology74, 201-209 (2010)
2010
-
[6]
Rentz, Keith A
Sperling, Reisa A., Dorene M. Rentz, Keith A. Johnson, Jason Karlawish, Michael Donohue, David P. Salmon, & Paul Aisen. The A4 study: stopping AD before symptoms begin? Science translational medicine6, 228fs13-228fs13 (2014)
2014
-
[7]
Staging beta- amyloid pathology with amyloid positron emission tomography
Mattsson, Niklas, Sebastian Palmqvist, Erik Stomrud, Jacob Vogel, & Oskar Hansson. Staging beta- amyloid pathology with amyloid positron emission tomography. JAMA neurology76, 1319-1329 (2019)
2019
-
[8]
Villemagne, Pierrick Bourgeat, Jurgen Fripp, Oscar Acosta, Gael Chetelat, Luping Zhou et al
Dore, Vincent, Victor L. Villemagne, Pierrick Bourgeat, Jurgen Fripp, Oscar Acosta, Gael Chetelat, Luping Zhou et al. Cross-sectional and longitudinal analysis of the relationship between Abeta deposition, cortical thickness, and memory in cognitively unimpaired individuals and in Alzheimer disease. JAMA neurology70, (2013)
2013
-
[9]
Vogel, Alexa Pichet Binette, Travis B
Chaggar, Pavanjit, Jacob W. Vogel, Alexa Pichet Binette, Travis B. Thompson, Olof Strandberg, Niklas Mattsson-Carlgren, Linda Karlsson et al. Personalised regional modelling predicts tau progression in the human brain. PLoS Biology23, e3003241 (2025)
2025
-
[10]
Young, Neil P
Vogel, Jacob W., Alexandra L. Young, Neil P. Oxtoby, Ruben Smith, Rik Ossenkoppele, Olof T. Strandberg, Renaud La Joie, Leon M. Aksman, Michel J. Grothe, & Yasser Iturria-Medina. Four distinct trajectories of tau deposition identified in Alzheimer’s disease. Nature medicine27, 871-881 (2021). 25
2021
-
[11]
Sotero, Paule J
Iturria-Medina, Yasser, Roberto C. Sotero, Paule J. Toussaint, Alan C. Evans, & Alzheimer’s Disease Neuroimaging Initiative. Epidemic spreading model to characterize misfolded proteins propagation in aging and associated neurodegenerative disorders. PLoS computational biology10, e1003956 (2014)
2014
-
[12]
Correlating tau pathology to brain atrophy using a physics-based Bayesian model
Schafer A, Chaggar P, Goriely A, Kuhl E, & Alzheimer’s Disease Neuroimaging Initiative. Correlating tau pathology to brain atrophy using a physics-based Bayesian model. Engineering with Computers38, 3867-3877 (2022)
2022
-
[13]
Marinescu, Neil P
Young, Alexandra L., Razvan V. Marinescu, Neil P. Oxtoby, Martina Bocchetta, Keir Yong, Nicholas C. Firth, David M. Cash et al. Uncovering the heterogeneity and temporal complexity of neurodegenerative diseases with Subtype and Stage Inference. Nature communications9, 4273 (2018)
2018
-
[14]
101 labeled brain images and a consistent human cortical labeling protocol
Klein, Arno & Jason Tourville. 101 labeled brain images and a consistent human cortical labeling protocol. Frontiers in neuroscience6, 171 (2012)
2012
-
[15]
A kernel two-sample test
Gretton A, Borgwardt KM, Rasch MJ, Scholkopf B & Smola A. A kernel two-sample test. J Mach Learn Res.13, 723-773 (2012)
2012
-
[16]
MUSE: MUlti-atlas region segmentation utilizing ensembles of registration algorithms and parameters, and locally optimal atlas selection
Doshi J, Erus G, Ou Y, Resnick SM, Gur RC, Gur RE, Satterthwaite TD, Furth S, Davatzikos C & Alzheimer’s Neuroimaging Initiative. MUSE: MUlti-atlas region segmentation utilizing ensembles of registration algorithms and parameters, and locally optimal atlas selection. NeuroImage127, 186-195 (2016)
2016
-
[17]
A single-snapshot inverse solver for two-species graph model of tau pathology spreading in human Alzheimer’s disease
Wen, Zheyu, Ali Ghafouri, George Biros & Alzheimer’s Disease Neuroimaging Initiative. A single-snapshot inverse solver for two-species graph model of tau pathology spreading in human Alzheimer’s disease. Brain Informatics18(2025)
2025
-
[18]
Aligning personalized biomarker trajectories onto a common time axis: a connectome-based ODE model for Tau-Amyloid beta dynamics
Wen, Zheyu, George Biros & Alzheimer’s Disease Neuroimaging Initiative. Aligning personalized biomarker trajectories onto a common time axis: a connectome-based ODE model for Tau-Amyloid beta dynamics. Medical Image Analysis, 103757 (2025)
2025
-
[19]
LNODE: Uncovering the Latent Dynamics of Aβin Alzheimer’s Disease
Wen, Zheyu & George Biros. LNODE: Uncovering the Latent Dynamics of Aβin Alzheimer’s Disease. In International Conference on Medical Image Computing and Computer-Assisted Intervention Cham: Springer Nature Switzerland, 313-322 (2025)
2025
-
[20]
Harvard aging brain study: dataset and accessibility
Dagley, Alexander, Molly LaPoint, Willem Huijbers, Trey Hedden, Donald G. McLaren, Jasmeer P. Chatwal, Kathryn V. Papp et al. "Harvard aging brain study: dataset and accessibility." Neuroimage 144, 255-258 (2017)
2017
-
[21]
Spread of pathological tau proteins through communicating neurons in human Alzheimer’s disease
Vogel JW, Iturria-Medina Y, Strandberg OT, Smith R, Levitis E, Evans AC & Hansson O. Spread of pathological tau proteins through communicating neurons in human Alzheimer’s disease. Nat Commun. 11, 2612 (2020). 26
2020
-
[22]
Advances in functional and structural MR image analysis and implementation as FSL
Smith SM, Jenkinson M, Woolrich MW, Beckmann CF, Behrens TE, Johansen-Berg H, Bannister PR, De Luca M, Drobnjak I, Flitney DE & Niazy RK. Advances in functional and structural MR image analysis and implementation as FSL. NeuroImage23, S208-S219 (2004)
2004
-
[23]
Hong, J., Kang, S.K., Alberts, I. et al. Image-level trajectory inference of tau pathology using variational autoencoder for Flortaucipir PET. Eur J Nucl Med Mol Imaging49, 3061-3072 (2022)
2022
-
[24]
Bayesian physics-based modeling of tau propagation in Alzheimer’s disease
Schafer, Amelie, Mathias Peirlinck, Kevin Linka, Ellen Kuhl, & Alzheimer’s Disease Neuroimaging Initiative (ADNI). Bayesian physics-based modeling of tau propagation in Alzheimer’s disease. Frontiers in physiology12, 702975 (2021)
2021
-
[25]
Mormino, & Ellen Kuhl
Schafer, Amelie, Elizabeth C. Mormino, & Ellen Kuhl. Network diffusion modeling explains longitudinal tau PET data. Frontiers in neuroscience14, 566876 (2020)
2020
-
[26]
Thompson, Alain Goriely, Ellen Kuhl, & Alzheimer’s Disease Neuroimaging Initiative
Schafer, Amelie, Pavanjit Chaggar, Travis B. Thompson, Alain Goriely, Ellen Kuhl, & Alzheimer’s Disease Neuroimaging Initiative. Predicting brain atrophy from tau pathology: a summary of clinical findings and their translation into personalized models. Brain Multiphysics2, 100039 (2021)
2021
-
[27]
Understanding the complex interplay between tau, amyloid and the network in the spatiotemporal progression of Alzheimer’s Disease
Raj, Ashish, Justin Torok, and Kamalini Ranasinghe. Understanding the complex interplay between tau, amyloid and the network in the spatiotemporal progression of Alzheimer’s Disease. Progress in Neurobiology, 102750 (2025)
2025
-
[28]
Senjem, Christopher G
Sintini, Irene, Jonathan Graff-Radford, Matthew L. Senjem, Christopher G. Schwarz, Mary M. Machulda, Peter R. Martin, David T. Jones et al. Longitudinal neuroimaging biomarkers differ across Alzheimer’s disease phenotypes. Brain143, 2281-2294 (2020)
2020
-
[29]
Stuss, & Sandra E
Lam, Benjamin, Mario Masellis, Morris Freedman, Donald T. Stuss, & Sandra E. Black. Clinical, imaging, and pathological heterogeneity of the Alzheimer’s disease syndrome. Alzheimer’s research & therapy5, 1 (2013)
2013
-
[30]
Sharp, & Roger N
Whittington, Alex, David J. Sharp, & Roger N. Gunn. Spatiotemporal distribution of beta-amyloid in Alzheimer disease is the result of heterogeneous regional carrying capacities. Journal of Nuclear Medicine 59, 822-827 (2018)
2018
-
[31]
Toledo, Nicolas Honnorat, Jimit Doshi, Erdem Varol, Aristeidis Sotiras, David Wolk, John Q
Dong, Aoyan, Jon B. Toledo, Nicolas Honnorat, Jimit Doshi, Erdem Varol, Aristeidis Sotiras, David Wolk, John Q. Trojanowski, Christos Davatzikos, & Alzheimer’s Disease Neuroimaging Initiative. Heterogeneity of neuroanatomical patterns in prodromal Alzheimer’s disease: links to cognition, progression and biomarkers. Brain140, 735-747 (2017)
2017
-
[32]
A multiscale model to explain the spatiotemporal progression of amyloid beta and tau pathology in Alzheimer’s disease
Xu, Chunrui, Enze Xu, Yang Xiao, Defu Yang, Guorong Wu, & Minghan Chen. A multiscale model to explain the spatiotemporal progression of amyloid beta and tau pathology in Alzheimer’s disease. International Journal of Biological Macromolecules310, 142887 (2025). 27
2025
-
[33]
Protein-protein interactions in neurodegenerative diseases: A conspiracy theory
Thompson, Travis B., Pavanjit Chaggar, Ellen Kuhl, Alain Goriely, & Alzheimer’s Disease Neuroimag- ing Initiative. Protein-protein interactions in neurodegenerative diseases: A conspiracy theory. PLoS computational biology16, e1008267 (2020)
2020
-
[34]
Nonlocal models in the analysis of brain neurodegenerative protein dynamics with application to Alzheimer’s disease
Pal, Swadesh, and Roderick Melnik. Nonlocal models in the analysis of brain neurodegenerative protein dynamics with application to Alzheimer’s disease. Scientific Reports12, 7328 (2022)
2022
-
[35]
Maini, Daniel J
Liu, Yue, Kevin Suh, Philip K. Maini, Daniel J. Cohen, and Ruth E. Baker. Parameter identifiability and model selection for partial differential equation models of cell invasion. Journal of the Royal Society Interface21, 20230607 (2024)
2024
-
[36]
Browning, Alexander P., Maria Tasca, Carles Falco, and Ruth E. Baker. Structural identifiability analysis of linear reaction-advection-diffusion processes in mathematical biology. Proceedings of the Royal Society A480, 20230911 (2024)
2024
-
[37]
Data-driven modelling of neurodegenerative disease progression: thinking outside the black box
Young AL, Oxtoby NP, Garbarino S, Fox NC, Barkhof F, Schott JM, & Alexander DC. Data-driven modelling of neurodegenerative disease progression: thinking outside the black box. Nat. Rev. Neurosci. 25, 111-130 (2024)
2024
-
[38]
Blazey, Yi Su, Amrita Hari-Raj, Aylin Dincer, Shaney Flores, Jon Christensen et al
Gordon, Brian A., Tyler M. Blazey, Yi Su, Amrita Hari-Raj, Aylin Dincer, Shaney Flores, Jon Christensen et al. Spatial patterns of neuroimaging biomarker change in individuals from families with autosomal dominant Alzheimer’s disease: a longitudinal study. The Lancet Neurology17, 241-250 (2018)
2018
-
[39]
Lee, Shaney Flores et al
Fan, Shuyang, Maria Rosana Ponisio, Pan Xiao, Sung Min Ha, Satrajit Chakrabarty, John J. Lee, Shaney Flores et al. AmyloidPETNet: classification of amyloid positivity in brain PET imaging using end-to-end deep learning. Radiology311, e231442 (2024)
2024
-
[40]
Kowshik, Shreyas Puducheri, Michael F
Jasodanand, Varuna H., Sahana S. Kowshik, Shreyas Puducheri, Michael F. Romano, Lingyi Xu, Rhoda Au, and Vijaya B. Kolachalama. AI-driven fusion of multimodal data for Alzheimer’s disease biomarker assessment. Nature Communications16, 7407 (2025)
2025
-
[41]
Knopman et al
Gottesman, Rebecca F., Andrea LC Schneider, Yun Zhou, Josef Coresh, Edward Green, Naresh Gupta, David S. Knopman et al. Association between midlife vascular risk factors and estimated brain amyloid deposition. Jama317, 1443-1450 (2017)
2017
-
[42]
Roe, Chengjie Xiong, Anne M
Morris, John C., Catherine M. Roe, Chengjie Xiong, Anne M. Fagan, Alison M. Goate, David M. Holtzman, and Mark A. Mintun. APOE predicts amyloid-beta but not tau Alzheimer pathology in cognitively normal aging. Annals of neurology67, 122-131 (2010)
2010
-
[43]
Visualizing data using t-SNE
Maaten, Laurens van der, & Geoffrey Hinton. Visualizing data using t-SNE. Journal of machine learning research9, 2579-2605 (2008). 28
2008
-
[44]
and Gu, Y
Moscoso, A., Heeman, F., Raghavan, S., Costoya-Sánchez, A., Van Essen, M., Mainta, I., Camacho, V., Rodríguez-Fonseca, O., Silva-Rodríguez, J., Perissinotti, A. and Gu, Y. Frequency and clinical outcomes associated with tau positron emission tomography positivity. JAMA334, 229-242 (2025)
2025
-
[45]
and Vissel, B
Kepp, K.P., Robakis, N.K., Hoilund-Carlsen, P.F., Sensi, S.L. and Vissel, B. The amyloid cascade hypothesis: an updated critical review. Brain146, 3969-3990 (2023)
2023
-
[46]
and Dietrich, P.Y
Frisoni, G.B., Altomare, D., Thal, D.R., Ribaldi, F., van der Kant, R., Ossenkoppele, R., Blennow, K., Cummings, J., van Duijn, C., Nilsson, P.M. and Dietrich, P.Y. The probabilistic model of Alzheimer disease: the amyloid hypothesis revised. Nature Reviews Neuroscience23, 53-66 (2022)
2022
-
[47]
Jorge Cardoso, Sebastien Ourselin, and Lauge Sorensen
Ghazi, Mostafa Mehdipour, Mads Nielsen, Akshay Pai, Marc Modat, M. Jorge Cardoso, Sebastien Ourselin, and Lauge Sorensen. Robust parametric modeling of Alzheimer’s disease progression. NeuroIm- age225, 117460 (2021)
2021
-
[48]
Chen, Guo-fang, Ting-hai Xu, Yan Yan, Yu-ren Zhou, Yi Jiang, Karsten Melcher, and H. Eric Xu. Amyloid beta: structure, biology and structure-based therapeutic development. Acta pharmacologica sinica38, 1205-1235 (2017)
2017
-
[49]
and Rao, P.P
Mohamed, T., Shakeri, A. and Rao, P.P. Amyloid cascade in Alzheimer’s disease: Recent advances in medicinal chemistry. European journal of medicinal chemistry113, 258-272 (2016)
2016
-
[50]
Functional brain architecture is associated with the rate of tau accumulation in Alzheimer’s disease
Franzmeier, Nicolai, Julia Neitzel, Anna Rubinski, Ruben Smith, Olof Strandberg, Rik Ossenkoppele, Oskar Hansson, and Michael Ewers. Functional brain architecture is associated with the rate of tau accumulation in Alzheimer’s disease. Nature communications11, 347 (2020)
2020
-
[51]
and Rowe, C.C
Klunk, W.E., Koeppe, R.A., Price, J.C., Benzinger, T.L., Devous Sr, M.D., Jagust, W.J., Johnson, K.A., Mathis, C.A., Minhas, D., Pontecorvo, M.J. and Rowe, C.C. The Centiloid Project: standardizing quantitative amyloid plaque estimation by PET. Alzheimer’s & dementia,11, 1-15 (2015)
2015
-
[52]
TauGenNet: Plasma-Driven Tau PET Image Synthesis via Text-Guided 3D Diffusion Models
Gong, Yuxin, Se-in Jang, Wei Shao, Yi Su, and Kuang Gong. TauGenNet: Plasma-Driven Tau PET Image Synthesis via Text-Guided 3D Diffusion Models. arXiv preprint arXiv:2509.04269 (2025)
-
[53]
Learning patient-specific spatial biomarker dynamics via operator learning for Alzheimer’s disease progression
Wang, Jindong, Yutong Mao, Xiao Liu, Wenrui Hao, and Alzheimer’s Disease Neuroimaging Initiative. Learning patient-specific spatial biomarker dynamics via operator learning for Alzheimer’s disease progression. ArXiv arXiv-2507 (2025)
2025
-
[54]
Uncover Governing Law of Pathology Propagation Mechanism Through A Mean-Field Game
Dan, Tingting, Zhihao Fan, and Guorong Wu. Uncover Governing Law of Pathology Propagation Mechanism Through A Mean-Field Game. In The Thirty-ninth Annual Conference on Neural Information Processing Systems. 29
-
[55]
Sorensen, and Chao Yang
Lehoucq, Richard B., Danny C. Sorensen, and Chao Yang. ARPACK users’ guide: solution of large-scale eigenvalue problems with implicitly restarted Arnoldi methods. Society for Industrial and Applied Mathematics, (1998). Acknowledgements Data used in preparation of this article were obtained from the Alzheimer’s Disease Neuroimaging Initiative (ADNI) databa...
1998
-
[56]
initial conditionpi: ∂xi(T) ∂pi =Z TP⊺ b, Ji,pi =P bZTP⊺ b
Jacobian w.r.t. initial conditionpi: ∂xi(T) ∂pi =Z TP⊺ b, Ji,pi =P bZTP⊺ b
-
[57]
···
Jacobian w.r.t.wij: ∂Mi ∂wij = κjΛ+ρjI 0···0 I(j) 0···0 0 0···0 0 0···0 ... ...···... ... ...···... 0 0···0 0 0···0 , ∂xi(T) ∂wij = ∂ZT ∂wij (xi0 + ¯ZTgi) +ZT ∂¯ZT ∂wij gi, Ji,wij =P b ∂xi(T) ∂wij . 32
-
[58]
diffusion coefficientsκj: ∂Mi ∂κj = wijΛ 0···0 0 0···0
Jacobian w.r.t. diffusion coefficientsκj: ∂Mi ∂κj = wijΛ 0···0 0 0···0 ... ... ... ... 0 0···0 , ∂xi(T) ∂κj = ∂ZT ∂κj (xi0 + ¯ZTgi), Ji,κj =P b ∂xi(T) ∂κj
-
[59]
growth ratesρj: ∂Mi ∂ρj = wijI 0···0 0 0···0
Jacobian w.r.t. growth ratesρj: ∂Mi ∂ρj = wijI 0···0 0 0···0 ... ... ... ... 0 0···0 , ∂xi(T) ∂ρj = ∂ZT ∂ρj (xi0 + ¯ZTgi), Ji,ρj =P b ∂xi(T) ∂ρj
-
[60]
couplingϕ1: ∂Mi ∂ϕ1 = 0 0···0 Λ 0···0
Jacobian w.r.t. couplingϕ1: ∂Mi ∂ϕ1 = 0 0···0 Λ 0···0 ... ... ... ... Λ 0···0 , ∂xi(T) ∂ϕ1 = ∂ZT ∂ϕ1 (xi0 + ¯ZTgi), Ji,ϕ1 =P b ∂xi(T) ∂ϕ1
-
[61]
bias termϕ2: ∂gi ∂ϕ2 = 0 I
Jacobian w.r.t. bias termϕ2: ∂gi ∂ϕ2 = 0 I ... I , ∂xi(T) ∂ϕ2 =Z T ¯ZT ∂gi ∂ϕ2 , Ji,ϕ2 =P bZT ¯ZT ∂gi ∂ϕ2 . 33 Full Hessian matrix. H= Hˆp1ˆp1 Hˆp1w1 0···0 0 0 H ˆp1κ Hˆp1ρ Hˆp1ϕ 1 Hˆp1ϕ 2 Hw1ˆp1 Hw1w1 0···0 0 0 H w1κ Hw1ρ Hw1ϕ 1 Hw1ϕ 2 0 0 H ˆp2ˆp2 Hˆp2w2 ···0 0 H ˆp2κ Hˆp2ρ Hˆp2ϕ 1 Hˆp2ϕ 2 0 0 H w2ˆp2 H...
discussion (0)
Sign in with ORCID, Apple, or X to comment. Anyone can read and Pith papers without signing in.