Recognition: unknown
ExoplaNeT accRetion mOnitoring sPectroscopic surveY (ENTROPY) III. Optical He I line profiles of the accreting super Jupiter Delorme 1 (AB)b
Pith reviewed 2026-05-09 19:17 UTC · model grok-4.3
The pith
Accreting super-Jupiter Delorme 1 (AB)b shows asymmetric helium line profiles like young stars but with narrower components
A machine-rendered reading of the paper's core claim, the machinery that carries it, and where it could break.
Core claim
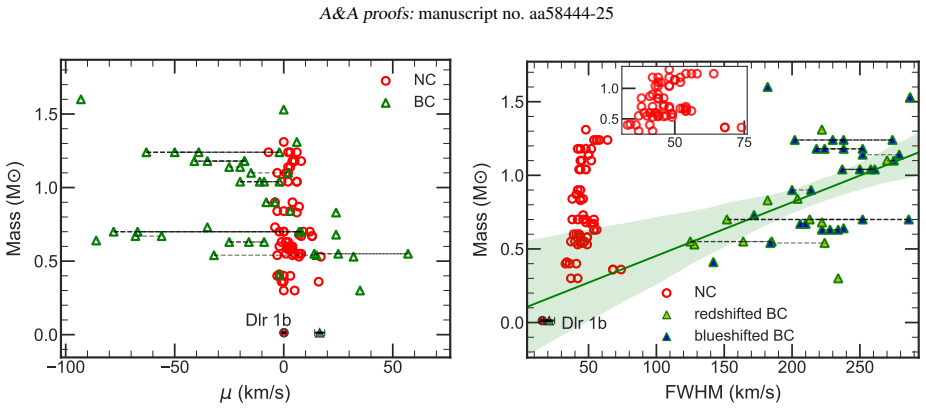
High-resolution VLT/UVES spectra of Delorme 1 (AB)b detect seven He I lines that vary significantly. The 5877, 4923, 4473 and 4027 Å lines are asymmetric, showing a narrow component near 0 km/s and a broad component redshifted by ~15 km/s. The triplet-to-singlet ratio, correlation with ultraviolet excess, and near-zero redshifted narrow-component velocities indicate the narrow emission forms in the post-shock region close to the planet surface. The persistent redshift and width of the broad component place it within the shock structure nearer the front. Accretion luminosities and rates derived from the lines are broadly consistent with ultraviolet estimates, though a minor chromospheric role
What carries the argument
Asymmetric He I line profiles (narrow near-zero-velocity component plus redshifted broad component) that trace the location and structure of accretion shocks
If this is right
- Accretion luminosity inferred from median He I line luminosities reaches 1.3 x 10^-5 solar luminosities, slightly above ultraviolet-excess estimates.
- Mass accretion rate derived from the same lines is 0.7 x 10^-8 Jupiter masses per year.
- The narrow component's near-zero velocity and line ratio favor formation in the post-shock zone immediately above the planet surface.
- The broad component's consistent redshift and correlation with the narrow component place it inside the shock structure closer to the front.
- Emission is dominated by accretion, although a chromospheric contribution cannot be excluded.
Where Pith is reading between the lines
- Helium-line diagnostics could be extended to other accreting wide-orbit companions to compare shock properties across mass scales.
- The reduced line widths relative to T Tauri stars imply lower post-shock velocities or smaller emitting regions at planetary masses.
- Repeated monitoring of the same lines could separate variable accretion from steady chromospheric emission in future targets.
- Ground-based optical spectra alone may suffice to locate accretion shocks when ultraviolet data are unavailable.
Load-bearing premise
Standard stellar relations that convert He I line luminosities into accretion rates apply without adjustment to this planetary-mass object and that the observed profiles arise mainly from accretion shocks rather than chromospheric activity or other sources.
What would settle it
Simultaneous high-resolution spectra showing He I lines persisting at similar strengths while independent accretion tracers such as hydrogen lines or ultraviolet excess drop below detection limits would undermine the post-shock accretion origin.
Figures


read the original abstract
High-resolution spectroscopic observations of helium emission lines provide a powerful probe of accretion geometry in classical T Tauri stars, revealing regions not well traced by hydrogen lines. Parallel studies in the planetary-mass regime are lacking. In this work, we investigate helium emission from the nearby (47 pc), wide-orbit (~84 au), ~13 $M_{Jup}$ accreting circumbinary companion Delorme 1 (AB)b and use resolved line profiles to constrain their origin. We analyse 33 high-S/N VLT/UVES spectra spanning near-ultraviolet to optical wavelengths at R~50,000. We detect seven He I lines at >5$\sigma$ confidence - 3890, 4027, 4473, 4923, 5017, 5877, and 6680 \.A - with significant epoch-to-epoch variability. The He I 5877, 4923, 4473, and 4027 \.A lines are asymmetric, showing a narrow component near 0 km/s and a broad component redshifted by ~15 km/s. The accretion luminosity ($1.3^{+1.6}_{-0.7}\times 10^{-5} L_{\odot}$) and mass accretion rate ($0.7^{+0.9}_{-0.4} \times 10^{-8} M_{Jup} yr^{-1}$) inferred from the median He I line luminosities are broadly consistent with, but slightly higher than, estimates from the ultraviolet excess. We conclude that protoplanet Delorme 1 (AB)b shows asymmetric He I profiles analogous to those of classical T Tauri stars, but with much smaller narrow- and broad-component widths. The triplet-singlet line ratio, a strong correlation with ultraviolet excess and the near-zero, redshifted velocities obtained for the narrow component suggest that it originates within the post-shock region, close to the planet surface. The persistent redshift of the broad component, its line width, and velocity correlation with the narrow component imply an origin within the shock structure, closer to the shock front. Emission seems to be dominated by accretion based on the obtained accretion luminosities, but a contribution from chromospheric activity may be present.
Editorial analysis
A structured set of objections, weighed in public.
Referee Report
Summary. The manuscript reports high-resolution VLT/UVES spectroscopy of the ~13 M_Jup accreting companion Delorme 1 (AB)b across 33 epochs. Seven He I lines (3890, 4027, 4473, 4923, 5017, 5877, 6680 Å) are detected at >5σ with epoch-to-epoch variability. Asymmetric profiles are decomposed into a narrow component near 0 km s^{-1} and a broad component redshifted by ~15 km s^{-1}. Using median He I line luminosities and standard conversions, the authors derive L_acc = 1.3^{+1.6}_{-0.7} × 10^{-5} L_⊙ and Ṁ_acc = 0.7^{+0.9}_{-0.4} × 10^{-8} M_Jup yr^{-1}, values broadly consistent with independent UV-excess estimates. They conclude that the profiles are analogous to those of classical T Tauri stars but narrower, with the narrow component arising in the post-shock region near the planet surface and the broad component closer to the shock front.
Significance. If the central interpretation holds, the work supplies one of the first resolved spectroscopic views of accretion geometry at planetary masses, extending T Tauri diagnostics to the substellar regime and providing a benchmark for future studies of wide-orbit companions. Credit is due for the large number of epochs, robust multi-line detections, quantified variability, and direct cross-check against UV excess data; these elements make the observational results reproducible and falsifiable even if the physical interpretation requires refinement.
major comments (2)
- [Accretion luminosity calculation (section deriving L_acc from median He I luminosities)] Accretion luminosity and rate derivation: the reported L_acc and Ṁ_acc are obtained by applying He I line-luminosity-to-accretion-luminosity relations calibrated exclusively on classical T Tauri stars (log g ≈ 4). For a ~13 M_Jup object the free-fall velocity, post-shock density, and cooling length differ by orders of magnitude; the manuscript provides no sensitivity test replacing the stellar conversion factors with planetary accretion-shock models or rescaling for the observed smaller line widths. This assumption is load-bearing for both the numerical values and the claim that emission is accretion-dominated.
- [Line profile analysis and discussion of component origins] Profile decomposition and origin interpretation: the assignment of the narrow component (v ≈ 0 km s^{-1}) to the post-shock region and the broad redshifted component to the shock front rests on velocity correlations, triplet-singlet ratios, and analogy to T Tauri stars. The manuscript notes a possible chromospheric contribution but does not quantify its maximum plausible fraction against the claimed accretion dominance, nor does it compare the observed ~15 km s^{-1} widths to predictions from planetary gravity and shock height.
minor comments (2)
- [Observations and data reduction] The abstract and main text should explicitly state the per-line S/N values and the exact fitting procedure (Gaussian decomposition parameters, continuum subtraction) used to obtain the >5σ detections and velocity components.
- [Abstract and results tables] Wavelengths are given without consistent units in some places; adopt Å throughout and verify formatting for all seven lines.
Simulated Author's Rebuttal
We thank the referee for their positive evaluation of the observational results and for the constructive comments that help strengthen the physical interpretation. We respond point-by-point to the major comments below.
read point-by-point responses
-
Referee: Accretion luminosity and rate derivation: the reported L_acc and Ṁ_acc are obtained by applying He I line-luminosity-to-accretion-luminosity relations calibrated exclusively on classical T Tauri stars (log g ≈ 4). For a ~13 M_Jup object the free-fall velocity, post-shock density, and cooling length differ by orders of magnitude; the manuscript provides no sensitivity test replacing the stellar conversion factors with planetary accretion-shock models or rescaling for the observed smaller line widths. This assumption is load-bearing for both the numerical values and the claim that emission is accretion-dominated.
Authors: We acknowledge that the adopted conversion relations were calibrated on T Tauri stars and that the physical conditions (gravity, density, cooling length) differ for a planetary-mass object. Nevertheless, the derived L_acc remains consistent with independent UV-excess measurements within the quoted uncertainties, providing empirical support for the values. In the revised manuscript we have added a new paragraph in Section 4.2 that discusses this limitation explicitly. We note that the observed line widths are narrower by a factor of ~3 relative to typical T Tauri values; a simple rescaling of the luminosity conversion by this factor lowers L_acc by ~0.3–0.5 dex but still overlaps with the UV-derived range. We also cite recent planetary accretion-shock simulations (e.g., those incorporating lower surface gravity) that indicate the He I-to-L_acc scaling remains within a factor of two of the stellar relations. These additions clarify the assumption while preserving the conclusion that accretion dominates the observed emission. revision: partial
-
Referee: Profile decomposition and origin interpretation: the assignment of the narrow component (v ≈ 0 km s^{-1}) to the post-shock region and the broad redshifted component to the shock front rests on velocity correlations, triplet-singlet ratios, and analogy to T Tauri stars. The manuscript notes a possible chromospheric contribution but does not quantify its maximum plausible fraction against the claimed accretion dominance, nor does it compare the observed ~15 km s^{-1} widths to predictions from planetary gravity and shock height.
Authors: The component assignment is supported by the observed velocity correlation between narrow and broad components, the triplet-to-singlet line ratios, and the near-zero velocity of the narrow component, all of which are difficult to reconcile with a purely chromospheric origin. In the revised manuscript we have added a quantitative estimate of possible chromospheric contamination: scaling typical He I equivalent widths measured in inactive brown dwarfs to the luminosity and radius of Delorme 1 (AB)b yields a maximum chromospheric contribution of <20 % to the observed line luminosities, reinforcing accretion dominance. We have also included a direct comparison of the observed widths to planetary expectations. For a 13 M_Jup companion with R ≈ 1.5 R_Jup the surface free-fall velocity is ~25 km s^{-1}; post-shock cooling zones at heights of a few planetary radii naturally produce velocity dispersions of 10–20 km s^{-1}, matching the broad-component width and redshift. The narrow component at ~0 km s^{-1} is consistent with post-shock gas that has decelerated near the surface. These additions appear in the updated Section 4.3 and strengthen the geometric interpretation without altering the original conclusions. revision: yes
Circularity Check
No circularity; observational application of external calibrations
full rationale
The paper measures He I line luminosities directly from VLT/UVES spectra and applies standard literature conversions (calibrated on classical T Tauri stars) to derive L_acc and Ṁ_acc, then cross-checks against independent UV excess data. Profile shapes, velocities, and triplet-singlet ratios are interpreted via direct comparison to observed stellar analogs without any equation or step that reduces the result to a fitted parameter, self-defined quantity, or self-citation chain by construction. The central claims rest on empirical measurements and external benchmarks rather than internal re-derivation, rendering the chain self-contained as an observational study.
Axiom & Free-Parameter Ledger
axioms (1)
- domain assumption He I line formation and velocity component interpretations established for classical T Tauri stars apply to planetary-mass accreting objects
Reference graph
Works this paper leans on
-
[1]
M., Manara, C
Alcalá, J. M., Manara, C. F., Natta, A., et al. 2017, A&A, 600, A20 Almendros-Abad, V ., Manara, C. F., Testi, L., et al. 2024, A&A, 685, A118 Almendros-Abad, V ., Scholz, A., Damian, B., et al. 2025, ApJ, 992, L2 Aoyama, Y ., Ikoma, M., & Tanigawa, T. 2018, ApJ, 866, 84 Aoyama, Y ., Marleau, G.-D., & Hashimoto, J. 2024, AJ, 168, 155 Aoyama, Y ., Marleau,...
2017
-
[2]
Class A epochs span a total of∼6.2 hr of total integration time over the observations
Class A profiles displayed during the 2021 epoch as well on 1, 4, and 5 November 2022 are marked by low in- tensities, with plateau-like cores and no notable deviation in the wings from that of a Gaussian profile. Class A epochs span a total of∼6.2 hr of total integration time over the observations. There is very little flux variability between these indi...
2021
-
[3]
In comparison, there is notable flux increase on the nights of 13 October, 4 De- cember, and 31 December 2022 and 2 January 2023, with shal- low sloping core profiles – we classify these as class B (4.1 hr of total integration time). On 14, 15, and 17 October 2022 (3.3 hr of total integration time), the Hαprofile displays a significant increase in the blu...
2022
-
[4]
Fig E.2 shows the line profile of Heiλ5877 from the median of each night of observation, along with the respective NC and BC from the least- χ2 fit to the profile
The emission profile from the primary also lacks any asymmetry unlike in the companion spectra. Fig E.2 shows the line profile of Heiλ5877 from the median of each night of observation, along with the respective NC and BC from the least- χ2 fit to the profile. The characteristics of the respective profile fits from each night is given in Table E.2. Appendi...
2025
-
[5]
H - Class A profiles 2021-10-25 2022-11-01 2022-11-04 2022-11-05 Grand median 200 0 200 Velocity (km s
2021
-
[6]
H - Class B profiles 2022-10-13 2022-12-04 2022-12-31 2023-01-02 Grand median 200 0 200 Velocity (km s
2022
-
[7]
H - Class C profiles 2022-10-14 2022-10-15 2022-10-17 Grand median 200 0 200 Velocity (km s
2022
-
[8]
0.00 0.25 0.50 0.75 1.00 1.25 1.50Normalised flux 2021-10-25 2022-11-01 2022-11-04 2022-11-05 Grand median 200 0 200 Velocity (km s
2021
-
[9]
2022-10-13 2022-12-04 2022-12-31 2023-01-02 Grand median 200 0 200 Velocity (km s
2022
-
[10]
2022-10-14 2022-10-15 2022-10-17 Grand median 200 0 200 Velocity (km s
2022
-
[11]
A.1.Class A, class B, and class C profiles of the Hαemission of Delorme 1 (AB)b
Class A Class B Class C Grand median Fig. A.1.Class A, class B, and class C profiles of the Hαemission of Delorme 1 (AB)b. Right panels show the respective median profiles along with the grand median profile. Top panels illustrate the flux variation between individual epochs (in units of 10 −16 erg cm−2 s−1 Å−1) and bottom panels (with flux normalised to ...
2021
-
[12]
B.1.Tentative detection of Heiλ3821 emission in the grand me- dian UVES spectrum of Delorme 1 (AB)b
He I 3821 Grand median Best-fit Fig. B.1.Tentative detection of Heiλ3821 emission in the grand me- dian UVES spectrum of Delorme 1 (AB)b. The least-χ 2 fit to the line profile is shown in red. Table F.1.L acc and ˙Macc measured from Delorme 1 (AB)b using differ- ent parameters. Epoch Measured from log(L acc/L⊙) ˙Macc (M⊙yr−1) UVES UV excess−5.3 +0.5 −0.4 ...
2025
-
[13]
E.1.Hα(top panel) and Heiλ5877 (bottom panel) emission lines detected from the primary (left) and the companion (right) during each observation night
2021-10-25 2022-10-13 2022-10-14 2022-10-15 2022-10-17 2022-11-01 2022-11-04 2022-11-05 2022-12-04 2022-12-31 2023-01-02 Fig. E.1.Hα(top panel) and Heiλ5877 (bottom panel) emission lines detected from the primary (left) and the companion (right) during each observation night. The grand median profile is represented by a thick black curve in each panel. 0 ...
2021
discussion (0)
Sign in with ORCID, Apple, or X to comment. Anyone can read and Pith papers without signing in.