Recognition: unknown
A Study on the Resource Utilization and User Behavior on Titan Supercomputer
Pith reviewed 2026-05-09 18:58 UTC · model grok-4.3
The pith
Titan supercomputer logs show how projects, jobs, nodes, GPUs and memory relate, plus seasonal patterns and a utilization forecast model.
A machine-rendered reading of the paper's core claim, the machinery that carries it, and where it could break.
Core claim
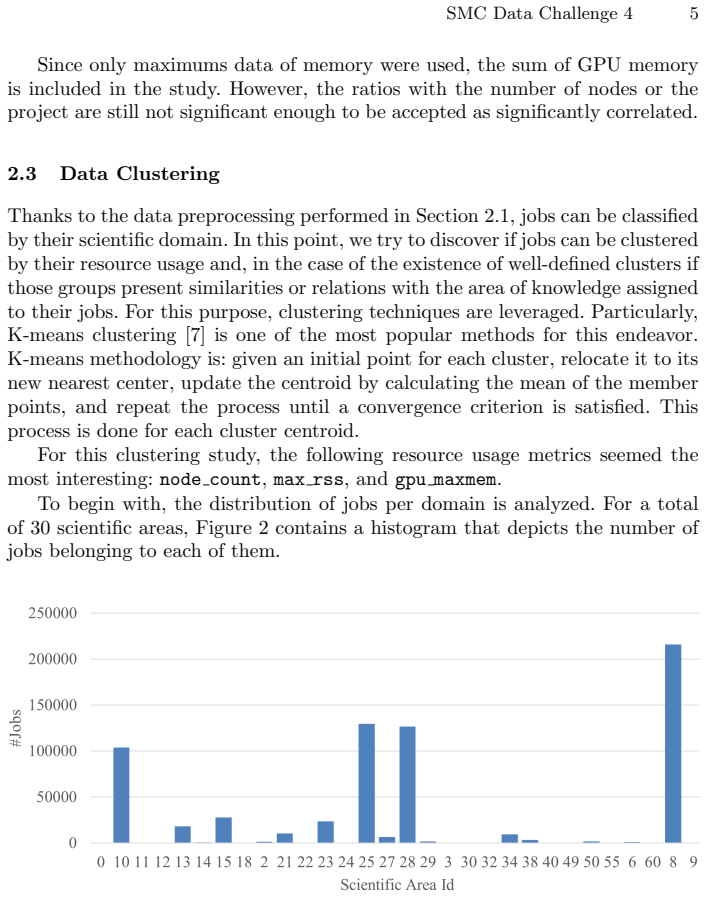
Examination of Titan logs reveals patterns in workload distribution and resource usage. Data science methods demonstrate connections among projects, jobs, nodes, GPUs, and memory, expose seasonality in usage, and produce a predictive model for forecasting supercomputer utilization.
What carries the argument
Correlations, clustering, and neural networks applied to system logs, GPU traces, and project data to extract inter-resource relationships and generate utilization forecasts.
Load-bearing premise
The Titan logs contain enough unbiased information to reveal generalizable relationships through correlations, clustering, and neural networks without overfitting or unstated selection steps.
What would settle it
Running the same correlation, clustering, and neural network pipeline on a fresh set of Titan logs or on logs from another supercomputer and checking whether the identified relationships and forecast accuracy remain consistent.
Figures


read the original abstract
Understanding HPC facilities users' behaviors and how computational resources are requested and utilized is not only crucial for the cluster productivity but also essential for designing and constructing future exascale HPC systems. This paper tackles Challenge 4, 'Analyzing Resource Utilization and User Behavior on Titan Supercomputer', of the 2021 Smoky Mountains Conference Data Challenge. Specifically, we dig deeper inside the records of Titan to discover patterns and extract relationships. This paper explores the workload distribution and usage patterns from resource manager system logs, GPU traces, and scientific areas information collected from the Titan supercomputer. Furthermore, we want to know how resource utilization and user behaviors change over time. Using data science methods, such as correlations, clustering, or neural networks, our findings allow us to investigate how projects, jobs, nodes, GPUs and memory are related. We provide insights about seasonality usage of resources and a predictive model for forecasting utilization of Titan Supercomputer. In addition, the described methodology can be easily adopted in other HPC clusters.
Editorial analysis
A structured set of objections, weighed in public.
Referee Report
Summary. The paper analyzes job logs, GPU traces, and scientific area data from the Titan supercomputer to explore workload distribution, relationships among projects/jobs/nodes/GPUs/memory, seasonality in resource usage, and a predictive model for utilization forecasting. It applies standard data-science techniques (correlations, k-means clustering with silhouette scores, and a simple feed-forward neural network) and positions the methodology as adaptable to other HPC systems. This is framed as a contribution to the 2021 Smoky Mountains Conference Data Challenge.
Significance. If the reported patterns and model hold, the work supplies concrete, dataset-specific insights into real-world HPC utilization that could aid schedulers and exascale design. The explicit feature extraction from traces and provision of basic hold-out numbers for the forecaster are positive; however, as an observational data-challenge study without parameter-free derivations or falsifiable predictions beyond the specific logs, its broader impact is incremental rather than transformative.
major comments (1)
- [predictive model section] The predictive-model section provides only a high-level description of the feed-forward network and aggregated daily utilization; no architecture details (layers, hidden units), training hyperparameters, or exact hold-out metrics (e.g., MAE, RMSE on which time window) are stated. This directly limits assessment of whether the forecasting claim is supported beyond a baseline fit.
minor comments (2)
- [data description] Clarify the exact time span and any filtering rules applied to the Titan logs before feature extraction; this would strengthen reproducibility.
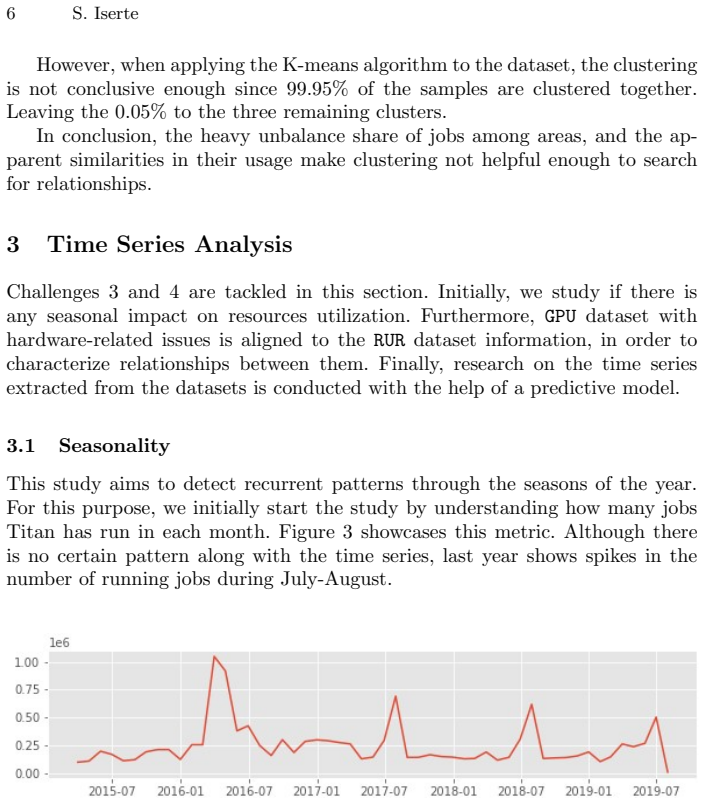
- [seasonality analysis] The abstract claims 'insights about seasonality' but the main text should explicitly link the clustering or correlation results to specific seasonal patterns with quantitative support.
Simulated Author's Rebuttal
We thank the referee for the constructive feedback on our manuscript. We address the major comment below and agree that additional details are needed to strengthen the predictive model section.
read point-by-point responses
-
Referee: [predictive model section] The predictive-model section provides only a high-level description of the feed-forward network and aggregated daily utilization; no architecture details (layers, hidden units), training hyperparameters, or exact hold-out metrics (e.g., MAE, RMSE on which time window) are stated. This directly limits assessment of whether the forecasting claim is supported beyond a baseline fit.
Authors: We agree with the referee that the predictive-model section in the current manuscript is described at a high level only. The text does not specify the feed-forward network architecture (number of layers or hidden units), training hyperparameters, or exact hold-out metrics such as MAE and RMSE for a defined time window. In the revised manuscript we will expand this section to include these details: the network structure, activation functions, optimizer and learning rate, number of epochs, and the precise performance numbers (MAE, RMSE) on the hold-out set together with the exact time window used for evaluation. This will allow readers to assess the forecasting results more rigorously. revision: yes
Circularity Check
No significant circularity; observational analysis only
full rationale
The manuscript is an empirical study of Titan logs using standard data-science pipelines (feature extraction from job/GPU traces, k-means clustering with silhouette validation, and a simple feed-forward neural network trained on daily aggregates with hold-out evaluation). No equations, ansatzes, or uniqueness theorems are invoked. The reported correlations, seasonality patterns, and utilization forecasts are direct outputs of the applied algorithms on the input traces; they do not reduce to the inputs by construction or via self-citation chains. The work is therefore self-contained as observational analysis.
Axiom & Free-Parameter Ledger
Reference graph
Works this paper leans on
-
[1]
Patel, Z
T. Patel, Z. Liu, R. Kettimuthu, P. Rich, W. Allcock, D. Tiwari, Job Characteris- tics on Large-Scale Systems: Long-Term Analysis, Quantification, and Implications, in: SC20: International Conference for High Performance Computing, Networking, Storage and Analysis, 2020, pp. 1–17
2020
-
[2]
S. Dash, A. K. Paul, F. Wang, S. Oral, T. Integration, SMC Data Challenge 2021: Analyzing Resource Utilization and User Behavior on Titan Supercomputer (2021). URL https://smc-datachallenge.ornl.gov/wp-content/uploads/2021/05/C4-SMC DataChallenge 2021.pdf
2021
-
[3]
Top500 the list, https://www.top500.org, accessed: 2021-08-04
2021
-
[4]
URL https://www.olcf.ornl.gov/wp-content/themes/olcf/titan/Titan Debuts.pdf
Oak Ridge National Laboratory, ORNL Debuts Titan Supercomputer (2012). URL https://www.olcf.ornl.gov/wp-content/themes/olcf/titan/Titan Debuts.pdf
2012
-
[5]
F. Wang, S. Oral, S. Sen, N. Imam, Learning from Five-year Resource-Utilization Data of Titan System, Proceedings - IEEE International Conference on Cluster Computing, ICCC 2019-Septe (2019). doi:10.1109/CLUSTER.2019.8891001
-
[6]
Ostrouchov, D
G. Ostrouchov, D. Maxwell, R. A. Ashraf, C. Engelmann, M. Shankar, J. H. Rogers, GPU Lifetimes on Titan Supercomputer: Survival Analysis and Reliability, Inter- national Conference for High Performance Computing, Networking, Storage and Analysis, SC 2020-November (2020)
2020
-
[7]
X. Jin, J. Han, K-Means Clustering, Springer US, Boston, MA, 2010, pp. 563–564
2010
-
[8]
R. B. Cleveland, W. S. Cleveland, J. E. McRae, I. Terpenning, Stl: A seasonal-trend decomposition, J. Off. Stat 6 (1) (1990) 3–73
1990
-
[9]
D. P. Kingma, J. L. Ba, Adam: A Method for Stochastic Optimization, 3rd Inter- national Conference on Learning Representations, ICLR 2015 - Conference Track Proceedings (2015) 1–15arXiv:1412.6980. 2 https://innova.gva.es/va/web/ciencia/a-programa-i-d-i/-/asset publisher/jMe1U DRYZMHO/content/iv-subvenciones-para-la-contratacion-de-personal-investigado r-e...
work page internal anchor Pith review Pith/arXiv arXiv 2015
discussion (0)
Sign in with ORCID, Apple, or X to comment. Anyone can read and Pith papers without signing in.