Recognition: unknown
High-pressure magnetic transition in iron observed via diamond quantum sensing
Pith reviewed 2026-05-09 15:05 UTC · model grok-4.3
The pith
NV centers fabricated on diamond anvil surfaces enable imaging of iron's stray magnetic field up to 30 GPa and reveal the alpha-epsilon transition.
A machine-rendered reading of the paper's core claim, the machinery that carries it, and where it could break.
Core claim
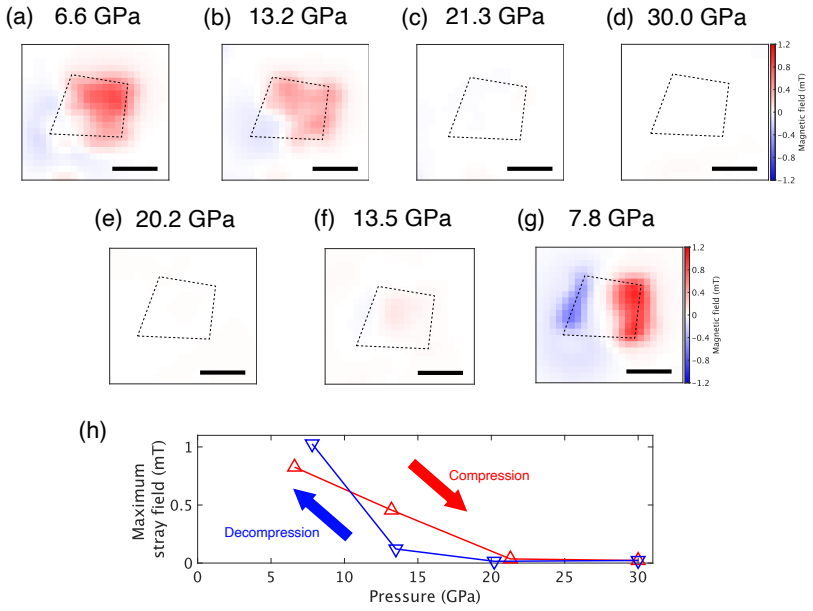
By fabricating an ensemble of NV centers directly on the anvil diamond surface, we enable precise magnetic measurements under high pressure. In this work, we employ this NV ensemble to image the stray magnetic field of iron up to 30 GPa, enabling the observation of the magnetic transition (α-ε transition) in iron.
What carries the argument
The NV-center ensemble fabricated on the diamond-anvil surface, which converts local magnetic fields into optically readable signals for stray-field imaging.
If this is right
- Magnetometry becomes possible inside diamond anvil cells without inserting conventional probes.
- Changes in stray field directly mark the loss of ferromagnetism during the alpha-to-epsilon transition.
- The same sensor geometry can be reused for repeated pressure cycles on the same sample.
- Spatial maps of the field reveal how the transition propagates across the sample area.
Where Pith is reading between the lines
- The approach could be extended to map magnetic domains or phase boundaries in other ferromagnetic or antiferromagnetic materials under compression.
- Combining the NV images with simultaneous electrical or optical measurements on the same cell would give multi-property data at high pressure.
- If the NV layer is made thinner or patterned, the technique might resolve finer spatial features of the transition front.
Load-bearing premise
The NV centers stay functional under pressure and any drop in the measured stray field is caused by the iron sample losing its magnetism rather than by sensor damage or setup changes.
What would settle it
The stray-field image from the iron sample shows no clear reduction near the accepted 10-15 GPa transition pressure, or the NV optical signal disappears before 30 GPa is reached.
Figures


read the original abstract
Diamond quantum sensors offer high precision and spatial resolution as magnetic probes, making them promising for a wide range of applications. While diamond anvil cells (DACs) can generate extremely high pressures, techniques for magnetometry under such conditions remain limited. By fabricating an ensemble of NV centers directly on the anvil diamond surface, we enable precise magnetic measurements under high pressure. In this work, we employ this NV ensemble to image the stray magnetic field of iron up to 30 GPa, enabling the observation of the magnetic transition ($\alpha$-$\varepsilon$ transition) in iron.
Editorial analysis
A structured set of objections, weighed in public.
Referee Report
Summary. The manuscript reports the fabrication of an NV-center ensemble directly on the surface of a diamond anvil to enable magnetic imaging inside a diamond anvil cell. Using this sensor, the authors image the stray magnetic field produced by an iron sample as pressure is increased to 30 GPa and claim to observe the α–ε magnetic transition through changes in the measured field.
Significance. If the central observation is robust, the work provides a practical route to high-resolution, in-situ magnetometry at pressures previously inaccessible to quantum sensors. This capability would be valuable for studying pressure-driven magnetic phase transitions in condensed-matter systems.
major comments (2)
- [Results / data analysis] The data-analysis procedure (results section) fits NV ODMR spectra to extract |B| while holding the zero-field splitting D fixed at its ambient-pressure value. Because dD/dP ≈ +1.5 MHz/GPa, any uncorrected pressure-induced shift in D produces a systematic error in the inferred stray field that peaks near the known α–ε transition pressure (~13–15 GPa). No in-situ reference measurement or pressure-dependent Hamiltonian recalibration is described to isolate sample magnetism from sensor response.
- [Abstract and Results] No quantitative data, error bars, pressure-calibration details, or explicit criteria for identifying the transition (e.g., a step in |B| or a change in spatial pattern) are provided in the abstract or main text. Without these, the central claim that the observed field change corresponds to the α–ε transition cannot be independently verified.
minor comments (2)
- [Figures] Figure captions should explicitly state the pressure at which each image was acquired and whether any post-processing (e.g., background subtraction) was applied.
- [Methods] The manuscript would benefit from a short methods paragraph describing the NV ensemble fabrication process and the ODMR acquisition parameters used at each pressure point.
Simulated Author's Rebuttal
We thank the referee for their careful reading of the manuscript and for highlighting these important points regarding data analysis and presentation. We address each major comment below and will revise the manuscript to incorporate the suggested improvements.
read point-by-point responses
-
Referee: [Results / data analysis] The data-analysis procedure (results section) fits NV ODMR spectra to extract |B| while holding the zero-field splitting D fixed at its ambient-pressure value. Because dD/dP ≈ +1.5 MHz/GPa, any uncorrected pressure-induced shift in D produces a systematic error in the inferred stray field that peaks near the known α–ε transition pressure (~13–15 GPa). No in-situ reference measurement or pressure-dependent Hamiltonian recalibration is described to isolate sample magnetism from sensor response.
Authors: We acknowledge that the original manuscript did not explicitly describe the pressure dependence of the zero-field splitting D or provide an in-situ recalibration procedure. In the revised manuscript, we will add a dedicated subsection in the Results on data analysis that incorporates the known linear pressure shift dD/dP ≈ +1.5 MHz/GPa from the literature. We will also detail our ruby R1-line fluorescence measurements for in-situ pressure calibration and show the recalibrated |B| values after applying the pressure-dependent Hamiltonian correction. This will demonstrate that the observed change near 14 GPa exceeds any residual systematic error from the D shift. revision: yes
-
Referee: [Abstract and Results] No quantitative data, error bars, pressure-calibration details, or explicit criteria for identifying the transition (e.g., a step in |B| or a change in spatial pattern) are provided in the abstract or main text. Without these, the central claim that the observed field change corresponds to the α–ε transition cannot be independently verified.
Authors: We agree that the abstract and main text lacked sufficient quantitative details for independent verification. In the revision, we will expand the abstract to include key numbers such as the pressure at which the transition is observed, the magnitude of the stray-field drop, and typical error estimates. In the Results section, we will add error bars to all |B| plots, provide explicit pressure-calibration details (ruby fluorescence shifts with uncertainties), and state the identification criteria, e.g., a >30% drop in average |B| accompanied by a change from dipolar to more uniform spatial pattern at 13–15 GPa, with the exact pressure value and statistical significance from the data. revision: yes
Circularity Check
Experimental observation with no circular derivation chain
full rationale
This is an experimental paper describing fabrication of NV ensembles on diamond anvils and direct imaging of iron's stray magnetic field up to 30 GPa to observe the α-ε transition. No mathematical derivations, parameter fits presented as predictions, self-citations forming load-bearing premises, or ansatzes smuggled via prior work are present in the abstract or described methods. The result rests on empirical data collection and interpretation rather than any self-referential equation chain or fitted input renamed as output. The skeptic concern about pressure-dependent D is a potential experimental confound, not a circularity in any derivation.
Axiom & Free-Parameter Ledger
axioms (1)
- domain assumption NV centers in diamond can be used as magnetic sensors whose response is known from prior literature
Reference graph
Works this paper leans on
-
[1]
Conventional superconductivity at 203 kelvin at high pressures in the sulfur hydride system,
A. P. Drozdov, M. I. Eremets, I. A. Troyan, V. Ksenofontov, and S. I. Shylin, “Conventional superconductivity at 203 kelvin at high pressures in the sulfur hydride system,”Nature, vol. 525, pp. 73–76, Sep 2015
2015
-
[2]
Crystal structure of the superconducting phase of sulfur hydride,
M. Einaga, M. Sakata, T. Ishikawa, K. Shimizu, M. I. Eremets, A. P. Drozdov, I. A. Troyan, N. Hirao, and Y. Ohishi, “Crystal structure of the superconducting phase of sulfur hydride,”Nature Physics, vol. 12, pp. 835–838, Sep 2016
2016
-
[3]
Superconductivity at 250 K in lanthanum hydride under high pressures,
A. P. Drozdov, P. P. Kong, V. S. Minkov, S. P. Besedin, M. A. Kuzovnikov, S. Mozaffari, L. Balicas, F. F. Balakirev, D. E. Graf, V. B. Prakapenka, E. Green- berg, D. A. Knyazev, M. Tkacz, and M. I. Eremets, “Superconductivity at 250 K in lanthanum hydride under high pressures,”Nature, vol. 569, pp. 528–531, May 2019
2019
-
[4]
Evidence for superconductivity above 260 K in lanthanum superhydride at megabar pressures,
M. Somayazulu, M. Ahart, A. K. Mishra, Z. M. Geballe, M. Baldini, Y. Meng, V. V. Struzhkin, and R. J. Hemley, “Evidence for superconductivity above 260 K in lanthanum superhydride at megabar pressures,”Phys. Rev. Lett., vol. 122, p. 027001, Jan 2019
2019
-
[5]
High-temperature superconductivity in hydrides: Experimental evi- dence and details,
M. I. Eremets, V. S. Minkov, A. P. Drozdov, P. P. Kong, V. Ksenofontov, S. I. Shylin, S. L. Bud’ko, R. Prozorov, F. F. Balakirev, D. Sun, S. Mozaffari, and L. Balicas, “High-temperature superconductivity in hydrides: Experimental evi- dence and details,”Journal of Superconductivity and Novel Magnetism, vol. 35, pp. 965–977, Apr 2022
2022
-
[6]
Review: high pressure gener- ation techniques beyond the limit of conventional diamond anvils,
T. Yagi, T. Sakai, H. Kadobayashi, and T. Irifune, “Review: high pressure gener- ation techniques beyond the limit of conventional diamond anvils,”High Pressure Research, vol. 40, no. 1, pp. 148–161, 2020
2020
-
[7]
High-sensitivity diamond magne- tometer with nanoscale resolution,
J. M. Taylor, P. Cappellaro, L. Childress, L. Jiang, D. Budker, P. R. Hemmer, A. Yacoby, R. Walsworth, and M. D. Lukin, “High-sensitivity diamond magne- tometer with nanoscale resolution,”Nature Physics, vol. 4, pp. 810–816, Oct 2008
2008
-
[8]
Scanning magnetic field microscope with a diamond single-spin sensor,
C. L. Degen, “Scanning magnetic field microscope with a diamond single-spin sensor,”Applied Physics Letters, vol. 92, p. 243111, 06 2008
2008
-
[9]
Nanoscale magnetic sensing with an individual electronic spin in diamond,
J. R. Maze, P. L. Stanwix, J. S. Hodges, S. Hong, J. M. Taylor, P. Cappellaro, L. Jiang, M. V. G. Dutt, E. Togan, A. S. Zibrov, A. Yacoby, R. L. Walsworth, and M. D. Lukin, “Nanoscale magnetic sensing with an individual electronic spin in diamond,”Nature, vol. 455, pp. 644–647, Oct 2008
2008
-
[10]
Nanoscale imaging magnetome- try with diamond spins under ambient conditions,
G. Balasubramanian, I. Y. Chan, R. Kolesov, M. Al-Hmoud, J. Tisler, C. Shin, C. Kim, A. Wojcik, P. R. Hemmer, A. Krueger, T. Hanke, A. Leitenstorfer, R. Bratschitsch, F. Jelezko, and J. Wrachtrup, “Nanoscale imaging magnetome- try with diamond spins under ambient conditions,”Nature, vol. 455, pp. 648–651, Oct 2008. 13
2008
-
[11]
Nanoscale imaging and control of domain-wall hopping with a nitrogen-vacancy center microscope,
J.-P. Tetienne, T. Hingant, J.-V. Kim, L. H. Diez, J.-P. Adam, K. Garcia, J.-F. Roch, S. Rohart, A. Thiaville, D. Ravelosona, and V. Jacques, “Nanoscale imaging and control of domain-wall hopping with a nitrogen-vacancy center microscope,” Science, vol. 344, no. 6190, pp. 1366–1369, 2014
2014
-
[12]
High- speed domain wall racetracks in a magnetic insulator,
S. V´ elez, J. Schaab, M. S. W¨ ornle, M. M¨ uller, E. Gradauskaite, P. Welter, C. Gut- gsell, C. Nistor, C. L. Degen, M. Trassin, M. Fiebig, and P. Gambardella, “High- speed domain wall racetracks in a magnetic insulator,”Nature Communications, vol. 10, p. 4750, Oct 2019
2019
-
[13]
Ac- curate magnetic field imaging using nanodiamond quantum sensors enhanced by machine learning,
M. Tsukamoto, S. Ito, K. Ogawa, Y. Ashida, K. Sasaki, and K. Kobayashi, “Ac- curate magnetic field imaging using nanodiamond quantum sensors enhanced by machine learning,”Scientific Reports, vol. 12, p. 13942, Sep 2022
2022
-
[14]
Temperature dependence of the nitrogen-vacancy magnetic resonance in diamond,
V. M. Acosta, E. Bauch, M. P. Ledbetter, A. Waxman, L.-S. Bouchard, and D. Budker, “Temperature dependence of the nitrogen-vacancy magnetic resonance in diamond,”Phys. Rev. Lett., vol. 104, p. 070801, Feb 2010
2010
-
[15]
Nanometre-scale thermometry in a living cell,
G. Kucsko, P. C. Maurer, N. Y. Yao, M. Kubo, H. J. Noh, P. K. Lo, H. Park, and M. D. Lukin, “Nanometre-scale thermometry in a living cell,”Nature, vol. 500, pp. 54–58, Aug 2013
2013
-
[16]
Nanodiamond quantum thermometry assisted with machine learning,
K. Yamamoto, K. Ogawa, M. Tsukamoto, Y. Ashida, K. Sasaki, and K. Kobayashi, “Nanodiamond quantum thermometry assisted with machine learning,”Applied Physics Express, vol. 18, p. 025001, feb 2025
2025
-
[17]
Enabling quantum sensing under extreme pressure: Nitrogen-vacancy magnetometry up to 130 GPa,
A. Hilberer, L. Toraille, C. Dailledouze, M.-P. Adam, L. Hanlon, G. Weck, M. Schmidt, P. Loubeyre, and J.-F. m. c. Roch, “Enabling quantum sensing under extreme pressure: Nitrogen-vacancy magnetometry up to 130 GPa,”Phys. Rev. B, vol. 107, p. L220102, Jun 2023
2023
-
[18]
Electronic properties and metrology applications of the diamond nv− center under pressure,
M. W. Doherty, V. V. Struzhkin, D. A. Simpson, L. P. McGuinness, Y. Meng, A. Stacey, T. J. Karle, R. J. Hemley, N. B. Manson, L. C. L. Hollenberg, and S. Prawer, “Electronic properties and metrology applications of the diamond nv− center under pressure,”Phys. Rev. Lett., vol. 112, p. 047601, Jan 2014
2014
-
[19]
Megabar pressure sensing and magnetic phase imaging by [111]- oriented nitrogen-vacancy centers in diamond,
D. Mai, C. Zhong, Z. Wang, H. Wang, X. Sun, R. Dai, Z. Wang, and Z. Zhang, “Megabar pressure sensing and magnetic phase imaging by [111]- oriented nitrogen-vacancy centers in diamond,”Journal of Applied Physics, vol. 138, p. 045901, 07 2025
2025
-
[20]
GPa pressure imaging using nanodiamond quantum sensors,
R. Suda, K. Uriu, K. Yamamoto, M. Sasaki, K. Sasaki, M. Einaga, K. Shimizu, and K. Kobayashi, “GPa pressure imaging using nanodiamond quantum sensors,” Journal of the Physical Society of Japan, vol. 94, no. 12, p. 124707, 2025
2025
-
[21]
Magnetic measurements on micrometer-sized samples under high pressure using designed nv centers,
M. Lesik, T. Plisson, L. Toraille, J. Renaud, F. Occelli, M. Schmidt, O. Salord, A. Delobbe, T. Debuisschert, L. Rondin, P. Loubeyre, and J.-F. Roch, “Magnetic measurements on micrometer-sized samples under high pressure using designed nv centers,”Science, vol. 366, no. 6471, pp. 1359–1362, 2019
2019
-
[22]
Imaging stress and magnetism at high pressures using a nanoscale quantum sensor,
S. Hsieh, P. Bhattacharyya, C. Zu, T. Mittiga, T. J. Smart, F. Machado, B. Ko- brin, T. O. H¨ ohn, N. Z. Rui, M. Kamrani, S. Chatterjee, S. Choi, M. Zaletel, V. V. Struzhkin, J. E. Moore, V. I. Levitas, R. Jeanloz, and N. Y. Yao, “Imaging stress and magnetism at high pressures using a nanoscale quantum sensor,”Science, vol. 366, no. 6471, pp. 1349–1354, 2019
2019
-
[23]
Imaging the meissner effect in hydride superconductors using quantum sensors,
P. Bhattacharyya, W. Chen, X. Huang, S. Chatterjee, B. Huang, B. Kobrin, Y. Lyu, T. J. Smart, M. Block, E. Wang, Z. Wang, W. Wu, S. Hsieh, H. Ma, S. Mandyam, B. Chen, E. Davis, Z. M. Geballe, C. Zu, V. Struzhkin, R. Jeanloz, J. E. Moore, T. Cui, G. Galli, B. I. Halperin, C. R. Laumann, and N. Y. Yao, “Imaging the meissner effect in hydride superconductors...
2024
-
[24]
Hysteresis in the high pressure transformation of bcc- to hcp-iron,
R. D. Taylor, M. P. Pasternak, and R. Jeanloz, “Hysteresis in the high pressure transformation of bcc- to hcp-iron,”Journal of Applied Physics, vol. 69, pp. 6126– 6128, 04 1991
1991
-
[25]
State-selective intersystem crossing in nitrogen-vacancy centers,
M. L. Goldman, M. W. Doherty, A. Sipahigil, N. Y. Yao, S. D. Bennett, N. B. Manson, A. Kubanek, and M. D. Lukin, “State-selective intersystem crossing in nitrogen-vacancy centers,”Phys. Rev. B, vol. 91, p. 165201, Apr 2015
2015
-
[26]
Imaging magnetic transition of magnetite to megabar pressures using quantum sensors in diamond anvil cell,
M. Wang, Y. Wang, Z. Liu, G. Xu, B. Yang, P. Yu, H. Sun, X. Ye, J. Zhou, A. F. Goncharov, Y. Wang, and J. Du, “Imaging magnetic transition of magnetite to megabar pressures using quantum sensors in diamond anvil cell,”Nature Com- munications, vol. 15, p. 8843, Oct 2024
2024
-
[27]
Specific volume measurements of Cu, Mo, Pd, and Ag and calibration of the ruby R1 fluores- cence pressure gauge from 0.06 to 1 Mbar,
H. K. Mao, P. M. Bell, J. W. Shaner, and D. J. Steinberg, “Specific volume measurements of Cu, Mo, Pd, and Ag and calibration of the ruby R1 fluores- cence pressure gauge from 0.06 to 1 Mbar,”Journal of Applied Physics, vol. 49, pp. 3276–3283, 06 1978. 15
1978
discussion (0)
Sign in with ORCID, Apple, or X to comment. Anyone can read and Pith papers without signing in.