Recognition: unknown
Prospects for Observing Galaxy Spectral Energy Distribution from the Radio to the far-Infrared in the Era of Next-Generation Radio Telescopes
Pith reviewed 2026-05-09 18:32 UTC · model grok-4.3
The pith
Next-generation radio telescopes can detect radio to far-infrared SEDs of galaxies with stellar masses above 10^9 solar masses at any redshift up to 20.
A machine-rendered reading of the paper's core claim, the machinery that carries it, and where it could break.
Core claim
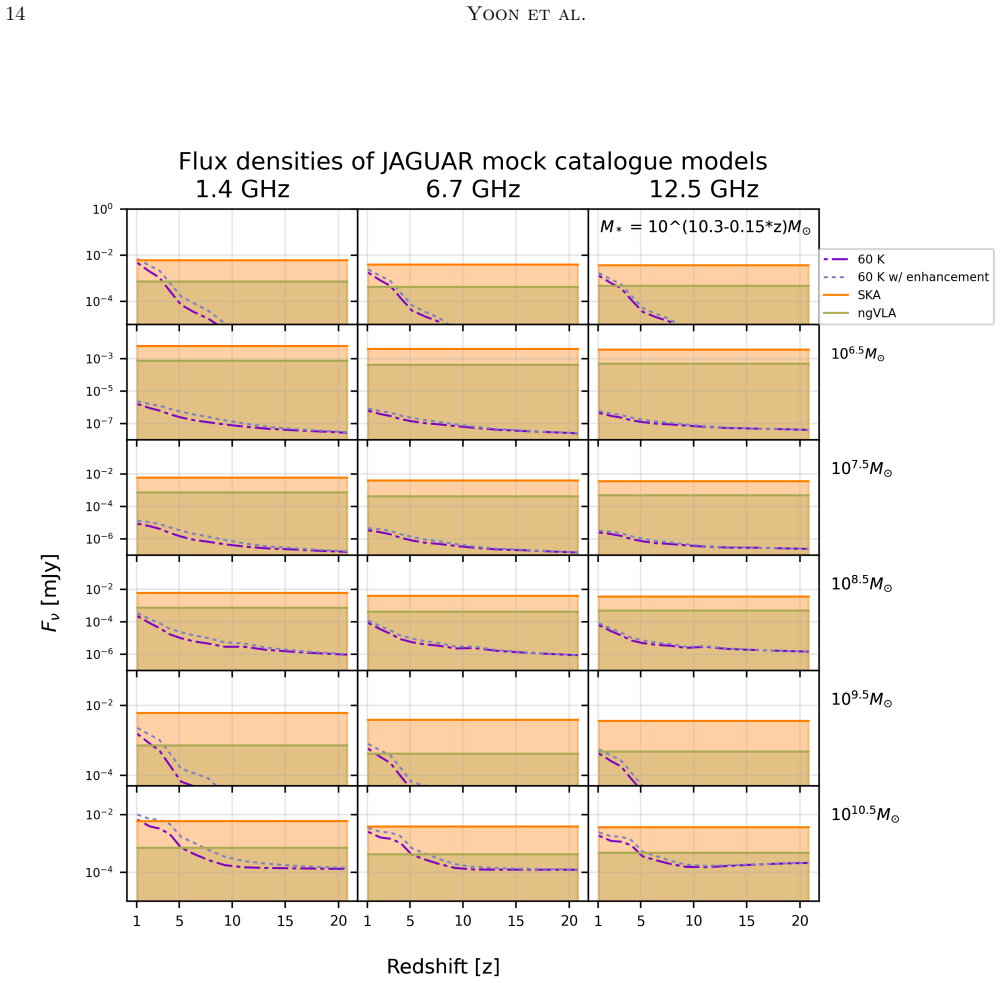
The central claim is that simulated flux density evolution shows massive galaxies with stellar mass at least 10^10 solar masses remain detectable at any redshift in frequencies above 90 GHz, the ngVLA high-frequency band near 100 GHz can detect galaxies with stellar mass at least 10^9 solar masses almost independently of redshift, and the SKA low-frequency window below 1 GHz can detect dusty star-forming galaxies with stellar mass at least 10^10 solar masses up to redshifts 5 to 7. The anomalous microwave emission component is insignificant in the SEDs of galaxies beyond the local universe at redshifts greater than 0.1.
What carries the argument
Energy-balanced panchromatic SED models extended from UV to radio wavelengths, combined with the radio-IR correlation and CMB corrections, to compute observable flux densities at telescope frequencies for different galaxy populations.
If this is right
- Massive galaxies above 10^10 solar masses are detectable at any redshift in high-frequency bands above 90 GHz with facilities like ALMA and ngVLA.
- The ngVLA at approximately 100 GHz can detect galaxies down to 10^9 solar masses with little dependence on redshift.
- The SKA low-frequency band below 1 GHz reaches dusty star-forming galaxies with stellar masses above 10^10 solar masses up to the epoch of reionization.
- Anomalous microwave emission contributes negligibly to the SED for galaxies at redshifts greater than 0.1.
- Full radio-FIR SED sampling will support studies of galaxy formation and evolution at high redshift.
Where Pith is reading between the lines
- Radio observations could supply dust-independent star formation rate estimates for early galaxies that complement infrared data.
- Combining these detections with multi-wavelength surveys might test whether SED models calibrated locally apply at high redshift.
- Large radio surveys could build statistical samples of high-redshift galaxies selected by their radio continuum rather than optical brightness.
- This capability extends the reach of ALMA by covering lower frequencies where synchrotron emission dominates.
Load-bearing premise
The radio-infrared correlation and energy-balanced SED models remain valid for high-redshift galaxies whose magnetic fields, cosmic ray densities, and dust properties may differ from local calibrators.
What would settle it
A ngVLA survey at 100 GHz that detects no galaxies with stellar masses near 10^9 solar masses at redshifts 5 to 10, or measures radio flux densities that systematically fall below predictions scaled from their infrared luminosities.
Figures


read the original abstract
The superb sensitivity and angular resolution of the next-generation radio telescopes with combined frequency coverage of approximately over three orders of magnitude (100 MHz--100 GHz) will sample the radio and far-infrared (FIR) spectral energy distribution (SED) of galaxies and revolutionize the galaxy formation study at the epoch of re-ionization and beyond. We present a prospect of observing the radio--FIR continuum SEDs of galaxies in the redshift of up to $z\approx 20$ based on an ensemble of the simulated `energy balanced' panchromatic SED (from UV to FIR) extended to the radio. For `realistic' populations of UV star-forming galaxies and dusty star-forming galaxies, we simulate their SEDs by accounting for the CMB effect and the radio--IR correlation. The flux density evolution of the UV-bright star-forming galaxies and the dusty star-forming galaxies at the selected observing frequencies covered by the current (ALMA) and next generation (SKA and ngVLA) radio-millimeter telescopes, suggest that massive galaxies (M$_* \gtrsim 10^{10}$M$_{\odot}$) are detectable at any redshift ($0<z<20$) in high frequency ($\nu>90$GHz). In particular, when operating, the ngVLA high-frequency ($\approx 100$ GHz) band is capable of detecting galaxies with M$_* \gtrsim 10^{9}$M$_{\odot}$ almost independently from redshift and the SKA low-frequency observing window ($\lesssim1$ GHz) has sufficient sensitivity to detect M$_* \gtrsim 10^{10}$M$_{\odot}$ dusty star-forming galaxies up to the epoch of reionization ($z=5\sim7$). We also show that the brightness of anomalous microwave emission (AME) in the galaxy SED is insignificant if the galaxies are beyond the local Universe (e.g., $z\gtrsim 0.1$).
Editorial analysis
A structured set of objections, weighed in public.
Referee Report
Summary. The paper claims that next-generation radio telescopes (SKA and ngVLA) with frequency coverage from ~100 MHz to 100 GHz will enable detailed sampling of galaxy radio-FIR SEDs up to z≈20. Using ensembles of simulated energy-balanced panchromatic SEDs (UV to FIR) extended to radio wavelengths, the authors incorporate CMB effects and the radio-IR correlation to model flux-density evolution for UV star-forming galaxies and dusty star-forming galaxies. They conclude that massive galaxies (M* ≳ 10^10 M⊙) are detectable at any redshift (0<z<20) in high-frequency bands (ν>90 GHz); specifically, ngVLA at ≈100 GHz can detect M* ≳ 10^9 M⊙ galaxies nearly independently of redshift, while SKA at ≲1 GHz has sufficient sensitivity to detect M* ≳ 10^10 M⊙ dusty star-forming galaxies up to z=5–7. The work also finds anomalous microwave emission (AME) to be insignificant for z≳0.1.
Significance. If the underlying extrapolations hold, the forecasts provide useful guidance for survey design with SKA and ngVLA, highlighting how their combined frequency coverage can probe galaxy populations during the epoch of reionization. The approach of extending energy-balanced SED templates with CMB corrections follows standard techniques in the field and offers a broad view across UV-bright and dusty galaxy populations. The explicit statement that AME becomes negligible at modest redshifts is a clear, falsifiable prediction that could be tested with early ngVLA data.
major comments (2)
- [Abstract and flux-density evolution results] The central detection thresholds (ngVLA ~100 GHz for M* ≳ 10^9 M⊙ independent of z; SKA ≲1 GHz for M* ≳ 10^10 M⊙ dusty galaxies to z~7) are computed by extending local radio-IR correlations to high redshift while applying only CMB corrections. No sensitivity runs are shown for plausible high-z variations in q_IR, magnetic-field strength, cosmic-ray density, or dust emissivity that would rescale the radio continuum relative to the FIR. Because flux densities are derived directly from these fixed models, even modest deviations at z>5 would shift the minimum detectable stellar mass by factors of several and remove the claimed redshift independence (see abstract and the flux-density evolution results).
- [Simulation methodology and results sections] The manuscript states that the radio-IR correlation and energy-balanced SED models are used to generate the predictions, yet it provides no quantitative validation of these templates against existing high-z radio or sub-mm data, nor error propagation on the assumed correlation parameters. This omission is load-bearing for the claimed detection prospects at z=5–7 and beyond.
minor comments (2)
- [Abstract] The abstract refers to 'realistic' populations of UV star-forming and dusty star-forming galaxies without specifying the exact stellar-mass functions, star-formation histories, or dust attenuation parameters adopted in the simulations.
- [Throughout] Notation for frequency bands is occasionally inconsistent (e.g., 'high frequency (ν>90 GHz)' versus '≈100 GHz'); a single table summarizing the exact frequency windows for ALMA, SKA, and ngVLA would improve clarity.
Simulated Author's Rebuttal
We thank the referee for their constructive and detailed comments, which have prompted us to strengthen the robustness of our forecasts. We agree that the original manuscript would benefit from explicit sensitivity tests and quantitative validation against observations. We have revised the paper accordingly by adding these elements, as explained in the point-by-point responses below.
read point-by-point responses
-
Referee: [Abstract and flux-density evolution results] The central detection thresholds (ngVLA ~100 GHz for M* ≳ 10^9 M⊙ independent of z; SKA ≲1 GHz for M* ≳ 10^10 M⊙ dusty galaxies to z~7) are computed by extending local radio-IR correlations to high redshift while applying only CMB corrections. No sensitivity runs are shown for plausible high-z variations in q_IR, magnetic-field strength, cosmic-ray density, or dust emissivity that would rescale the radio continuum relative to the FIR. Because flux densities are derived directly from these fixed models, even modest deviations at z>5 would shift the minimum detectable stellar mass by factors of several and remove the claimed redshift independence (see abstract and the flux-density evolution results).
Authors: We agree that the lack of sensitivity runs to high-redshift variations in the radio-IR correlation parameters is a limitation of the submitted version. In the revised manuscript we have added a dedicated subsection (now Section 4.3) that explores variations in q_IR (±0.2 dex around the local value, consistent with the observed scatter), magnetic-field strength (factor of 2), and cosmic-ray density (factor of 2). These are motivated by theoretical expectations for high-z galaxies. The new analysis shows that while the precise stellar-mass threshold can shift by up to a factor of ~3, the core result—that ngVLA at ~100 GHz detects M* ≳ 10^9 M⊙ galaxies with little redshift dependence—remains valid within the explored range. We have updated the abstract and the flux-density evolution figures to include shaded uncertainty bands reflecting these variations, and we have tempered the language to emphasize that the redshift independence holds under standard assumptions. revision: yes
-
Referee: [Simulation methodology and results sections] The manuscript states that the radio-IR correlation and energy-balanced SED models are used to generate the predictions, yet it provides no quantitative validation of these templates against existing high-z radio or sub-mm data, nor error propagation on the assumed correlation parameters. This omission is load-bearing for the claimed detection prospects at z=5–7 and beyond.
Authors: We acknowledge that the original submission lacked direct quantitative validation and error propagation. We have now added a validation subsection (Section 3.2) that compares our simulated radio and sub-mm fluxes against published ALMA and VLA measurements for UV-selected and dusty star-forming galaxies at 2 < z < 6. The models reproduce the observed continuum levels within the 0.2–0.3 dex scatter of the radio-IR correlation. In addition, we have implemented Monte Carlo error propagation by drawing the correlation parameters from their observed distributions and re-running the SED library; the resulting 1σ uncertainty envelopes are now shown as shaded regions in all flux-density evolution plots. These additions directly address the robustness of the z = 5–7 detection forecasts. revision: yes
Circularity Check
No significant circularity; detection forecasts follow directly from external radio-IR correlation and SED templates
full rationale
The paper constructs simulated panchromatic SEDs by extending literature energy-balanced models to radio frequencies using the established radio-IR correlation (plus CMB correction), then computes flux densities at SKA/ngVLA bands for given galaxy populations. No equation or step within the manuscript reduces a claimed detection threshold to a parameter fitted inside the paper, nor does any load-bearing premise rest on a self-citation whose validity is defined by the present work. The redshift-independent detectability statements are straightforward numerical consequences of applying fixed external scalings; they are not tautological with the inputs.
Axiom & Free-Parameter Ledger
axioms (2)
- domain assumption The radio-IR correlation holds at high redshifts with the same normalization and scatter as locally
- domain assumption Energy-balanced UV-to-FIR SED templates remain applicable to galaxies at z up to 20
Reference graph
Works this paper leans on
-
[1]
Adams, N. J., Conselice, C. J., Ferreira, L., et al. 2023, MNRAS, 518, 4755, doi: 10.1093/mnras/stac3347 Ali-Ha¨ ımoud, Y., Hirata, C. M., & Dickinson, C. 2009, MNRAS, 395, 1055, doi: 10.1111/j.1365-2966.2009.14599.x
-
[2]
An, F., Vaccari, M., Best, P. N., et al. 2024, MNRAS, 528, 5346, doi: 10.1093/mnras/stae364 Arrabal Haro, P., Dickinson, M., Finkelstein, S. L., et al. 2023, arXiv e-prints, arXiv:2303.15431, doi: 10.48550/arXiv.2303.15431
-
[3]
Atek, H., Shuntov, M., Furtak, L. J., et al. 2023a, MNRAS, 519, 1201, doi: 10.1093/mnras/stac3144
-
[4]
2023, MNRAS, 524, 5486, doi: 10.1093/mnras/stad1998
Atek, H., Chemerynska, I., Wang, B., et al. 2023b, MNRAS, 524, 5486, doi: 10.1093/mnras/stad1998
-
[5]
Bakx, T. J. L. C., Zavala, J. A., Mitsuhashi, I., et al. 2023, MNRAS, 519, 5076, doi: 10.1093/mnras/stac3723
-
[6]
Bakx, T. J. L. C., Algera, H. S. B., Jolly, J.-B., et al. 2026, MNRAS, 546, staf2284, doi: 10.1093/mnras/staf2284
-
[7]
S., Fatigoni, S., Murgia, M., et al
Battistelli, E. S., Fatigoni, S., Murgia, M., et al. 2019, ApJL, 877, L31, doi: 10.3847/2041-8213/ab21de
-
[8]
2018, MNRAS, 477, 552, doi: 10.1093/mnras/sty552
Vallini, L. 2018, MNRAS, 477, 552, doi: 10.1093/mnras/sty552
-
[9]
Bell, E. F. 2003, ApJ, 586, 794, doi: 10.1086/367829
-
[10]
Blain, A. W., & Longair, M. S. 1993, MNRAS, 264, 509, doi: 10.1093/mnras/264.2.509
-
[11]
Frayer, D. T. 2002, PhR, 369, 111, doi: 10.1016/S0370-1573(02)00134-5
-
[12]
2025, A&A, 698, A275, doi: 10.1051/0004-6361/202554194
Bondi, M., Prandoni, I., Magliocchetti, M., et al. 2025, A&A, 698, A275, doi: 10.1051/0004-6361/202554194
-
[13]
CIGALE: a python Code Investigating GALaxy Emission
Boquien, M., Burgarella, D., Roehlly, Y., et al. 2019, A&A, 622, A103, doi: 10.1051/0004-6361/201834156
-
[14]
Dust attenuation curves at z = 4.4-5.5
Boquien, M., Buat, V., Burgarella, D., et al. 2022, A&A, 663, A50, doi: 10.1051/0004-6361/202142537
-
[15]
Brandenburg, A., & Subramanian, K. 2005, PhR, 417, 1, doi: 10.1016/j.physrep.2005.06.005 22Yoon et al. Mchar(z) 6≤ M<7 7≤ M<8 8≤ M<9 9≤ M<10 10≤ M<11 Figure 10.Each group of four panels shows a 2-D histogram overlaid with the fits to the four physical parameters of the galaxies in each mass bin of the JAGUAR catalog. The orange lines indicate the median v...
-
[16]
Braun, R., Bonaldi, A., Bourke, T., Keane, E., & Wagg, J. 2019, arXiv e-prints, arXiv:1912.12699, doi: 10.48550/arXiv.1912.12699
-
[17]
Bruzual, G., & Charlot, S. 2003, MNRAS, 344, 1000, doi: 10.1046/j.1365-8711.2003.06897.x
-
[18]
A&A677, 88 (2023) https://doi.org/10.1051/ 0004-6361/202346159 arXiv:2302.07256 [astro-ph.GA]
Bunker, A. J., Saxena, A., Cameron, A. J., et al. 2023, arXiv e-prints, arXiv:2302.07256, doi: 10.48550/arXiv.2302.07256
-
[19]
Casey, C. M. 2012, MNRAS, 425, 3094, doi: 10.1111/j.1365-2966.2012.21455.x
-
[20]
Casey, C. M., Akins, H. B., Shuntov, M., et al. 2023, arXiv e-prints, arXiv:2308.10932, doi: 10.48550/arXiv.2308.10932
-
[21]
2022, ApJL, 938, L15, doi: 10.3847/2041-8213/ac94d0
Castellano, M., Fontana, A., Treu, T., et al. 2022, ApJL, 938, L15, doi: 10.3847/2041-8213/ac94d0
-
[22]
2024, ApJ, 972, 143, doi: 10.3847/1538-4357/ad5f88
Castellano, M., Napolitano, L., Fontana, A., et al. 2024, ApJ, 972, 143, doi: 10.3847/1538-4357/ad5f88
-
[23]
Chabrier, G. 2003, PASP, 115, 763, doi: 10.1086/376392
-
[24]
Charlot, S., & Fall, S. M. 2000, ApJ, 539, 718, doi: 10.1086/309250
-
[25]
Sandstrom, K. M. 2025, MNRAS, 537, 1518, doi: 10.1093/mnras/staf118
-
[26]
Cochrane, R. K., Kondapally, R., Best, P. N., et al. 2023, MNRAS, 523, 6082, doi: 10.1093/mnras/stad1602
-
[27]
Condon, J. J. 1992, ARA&A, 30, 575, doi: 10.1146/annurev.aa.30.090192.003043
-
[28]
Condon, J. J., & Yin, Q. F. 1990, ApJ, 357, 97, doi: 10.1086/168894
-
[29]
2026, A&A, 705, A258, doi: 10.1051/0004-6361/202557211 da Cunha, E., Charlot, S., & Elbaz, D
Correia, L., Bot, C., Chastenet, J., et al. 2026, A&A, 705, A258, doi: 10.1051/0004-6361/202557211 da Cunha, E., Charlot, S., & Elbaz, D. 2008, MNRAS, 388, 1595, doi: 10.1111/j.1365-2966.2008.13535.x da Cunha, E., Groves, B., Walter, F., et al. 2013, ApJ, 766, 13, doi: 10.1088/0004-637X/766/1/13
-
[30]
Delvecchio, I., Daddi, E., Sargent, M. T., et al. 2021, A&A, 647, A123, doi: 10.1051/0004-6361/202039647
-
[31]
2018, NewAR, 80, 1, doi: 10.1016/j.newar.2018.02.001
Dickinson, C., Ali-Ha¨ ımoud, Y., Barr, A., et al. 2018, NewAR, 80, 1, doi: 10.1016/j.newar.2018.02.001
-
[32]
Donnan, C. T., McLeod, D. J., McLure, R. J., et al. 2023, MNRAS, 520, 4554, doi: 10.1093/mnras/stad471
-
[33]
Draine, B. T. 2011, Physics of the Interstellar and Intergalactic Medium
2011
-
[34]
Draine, B. T., & Lazarian, A. 1998, ApJ, 508, 157, doi: 10.1086/306387
-
[35]
J., Willott, C., Alberts, S., et al
Eisenstein, D. J., Willott, C., Alberts, S., et al. 2023, arXiv e-prints, arXiv:2306.02465, doi: 10.48550/arXiv.2306.02465
-
[36]
2025a, A&A, 694, A215, doi: 10.1051/0004-6361/202452368
Ferrara, A., Carniani, S., di Mascia, F., et al. 2025a, A&A, 694, A215, doi: 10.1051/0004-6361/202452368
-
[37]
2025b, A&A, 694, A286, doi: 10.1051/0004-6361/202452707
Ferrara, A., Pallottini, A., & Sommovigo, L. 2025b, A&A, 694, A286, doi: 10.1051/0004-6361/202452707
-
[38]
Finkelstein, S. L., Bagley, M. B., Arrabal Haro, P., et al. 2022, ApJL, 940, L55, doi: 10.3847/2041-8213/ac966e
-
[39]
Franco, M., Akins, H. B., Casey, C. M., et al. 2024, ApJ, 973, 23, doi: 10.3847/1538-4357/ad5e6a
-
[40]
Fujimoto, S., Finkelstein, S. L., Burgarella, D., et al. 2023, ApJ, 955, 130, doi: 10.3847/1538-4357/aceb67
-
[41]
J., Shuntov, M., Atek, H., et al
Furtak, L. J., Shuntov, M., Atek, H., et al. 2023, MNRAS, 519, 3064, doi: 10.1093/mnras/stac3717
-
[42]
A., Mac Low, M.-M., Korpi-Lagg, M
Gent, F. A., Mac Low, M.-M., Korpi-Lagg, M. J., & Singh, N. K. 2023, ApJ, 943, 176, doi: 10.3847/1538-4357/acac20
-
[43]
2024, ApJ, 962, 26, doi: 10.3847/1538-4357/ad1519
Gentile, F., Talia, M., Behiri, M., et al. 2024, ApJ, 962, 26, doi: 10.3847/1538-4357/ad1519
-
[44]
Gim, H. B., Yun, M. S., Owen, F. N., et al. 2019, ApJ, 875, 80, doi: 10.3847/1538-4357/ab1011 Gonz´ alez-L´ opez, J., Novak, M., Decarli, R., et al. 2020, ApJ, 897, 91, doi: 10.3847/1538-4357/ab765b
-
[45]
Hale, C. L., Heywood, I., Jarvis, M. J., et al. 2025, MNRAS, 536, 2187, doi: 10.1093/mnras/stae2528
-
[46]
Harikane, Y., Nakajima, K., Ouchi, M., et al. 2023, arXiv e-prints, arXiv:2304.06658, doi: 10.48550/arXiv.2304.06658
-
[47]
Harris, C. R., Millman, K. J., van der Walt, S. J., et al. 2020, Nature, 585, 357, doi: 10.1038/s41586-020-2649-2
-
[48]
Haskell, P., Smith, D. J. B., Cochrane, R. K., Hayward, C. C., & Angl´ es-Alc´ azar, D. 2023, MNRAS, 525, 1535, doi: 10.1093/mnras/stad2315
-
[49]
E., Watson, D., Valentino, F., et al
Heintz, K. E., Watson, D., Valentino, F., et al. 2025, arXiv e-prints, arXiv:2510.07936, doi: 10.48550/arXiv.2510.07936
-
[50]
Helou, G., Soifer, B. T., & Rowan-Robinson, M. 1985, ApJL, 298, L7, doi: 10.1086/184556
-
[51]
2015, MNRAS, 449, 809, doi: 10.1093/mnras/stv287
Hensley, B., Murphy, E., & Staguhn, J. 2015, MNRAS, 449, 809, doi: 10.1093/mnras/stv287
-
[52]
Heywood, I., Murphy, E. J., Jim´ enez-Andrade, E. F., et al. 2021, ApJ, 910, 105, doi: 10.3847/1538-4357/abdf61
-
[53]
Hoang, T., & Tram, L. N. 2019, ApJ, 877, 36, doi: 10.3847/1538-4357/ab1845
-
[54]
Hoang, T., Tram, L. N., Lee, H., & Ahn, S.-H. 2019, Nature Astronomy, 3, 766, doi: 10.1038/s41550-019-0763-6
-
[55]
2025, PASA, 42, e071, doi: 10.1017/pasa.2025.10042
Hopkins, A., Kapinska, A., Marvil, J., et al. 2025, PASA, 42, e071, doi: 10.1017/pasa.2025.10042
-
[56]
Hunter, J. D. 2007, Computing in Science & Engineering, 9, 90, doi: 10.1109/MCSE.2007.55
-
[57]
Inami, H., Algera, H. S. B., Schouws, S., et al. 2022, MNRAS, 515, 3126, doi: 10.1093/mnras/stac1779
-
[58]
F., Capozziello, S., & Dainotti, M
Ivison, R. J., Alexander, D. M., Biggs, A. D., et al. 2010, MNRAS, 402, 245, doi: 10.1111/j.1365-2966.2009.15918.x 24Yoon et al
-
[59]
2018, ApJ, 866, 120, doi: 10.3847/1538-4357/aae0fa Jim´ enez-Andrade, E
Iyer, K., Gawiser, E., Dav´ e, R., et al. 2018, ApJ, 866, 120, doi: 10.3847/1538-4357/aae0fa Jim´ enez-Andrade, E. F., Murphy, E. J., Momjian, E., et al. 2024, ApJ, 972, 89, doi: 10.3847/1538-4357/ad5b5c Jim´ enez-Andrade, E. F., Murphy, E. J., Heywood, I., et al. 2021, ApJ, 910, 106, doi: 10.3847/1538-4357/abe876
-
[60]
Kazantsev, A. P. 1968, Soviet Journal of Experimental and Theoretical Physics, 26, 1031
1968
-
[61]
Kennicutt, R. C., & Evans, N. J. 2012, ARA&A, 50, 531, doi: 10.1146/annurev-astro-081811-125610
work page internal anchor Pith review doi:10.1146/annurev-astro-081811-125610 2012
-
[62]
Kulsrud, R. M., & Anderson, S. W. 1992, ApJ, 396, 606, doi: 10.1086/171743
-
[63]
Lacki, B. C., & Thompson, T. A. 2010, ApJ, 717, 196, doi: 10.1088/0004-637X/717/1/196
-
[64]
Latif, M. A., Aftab, A., Whalen, D. J., & Mezcua, M. 2025, A&A, 694, L14, doi: 10.1051/0004-6361/202453194
-
[65]
Latif, M. A., & Whalen, D. J. 2025, MNRAS, 537, 3448, doi: 10.1093/mnras/staf242
-
[66]
Leslie, S. K., Schinnerer, E., Liu, D., et al. 2020, ApJ, 899, 58, doi: 10.3847/1538-4357/aba044
-
[67]
Liang, L., Feldmann, R., Kereˇ s, D., et al. 2019, Monthly Notices of the Royal Astronomical Society, 489, 1397, doi: 10.1093/mnras/stz2134
-
[68]
2019, The Astrophysical Journal Supplement Series, 244, 30, doi: 10.3847/1538-4365/ab4194
Ma, J., Cooray, A., Nayyeri, H., et al. 2019, The Astrophysical Journal Supplement Series, 244, 30, doi: 10.3847/1538-4365/ab4194
-
[69]
Markov, V., Gallerani, S., Pallottini, A., et al. 2023, A&A, 679, A12, doi: 10.1051/0004-6361/202346723
-
[70]
Mauch, T., Cotton, W. D., Condon, J. J., et al. 2020, ApJ, 888, 61, doi: 10.3847/1538-4357/ab5d2d
-
[71]
& Dayal, P.\ 2023, , 526, 2196
Mauerhofer, V., & Dayal, P. 2023, MNRAS, 526, 2196, doi: 10.1093/mnras/stad2734
-
[72]
McKinney, J., Casey, C. M., Long, A. S., et al. 2025, ApJ, 979, 229, doi: 10.3847/1538-4357/ada357
-
[73]
McLure, R. J., Dunlop, J. S., Cullen, F., et al. 2018, MNRAS, 476, 3991, doi: 10.1093/mnras/sty522
-
[74]
Mitsuhashi, I., Harikane, Y., Bauer, F. E., et al. 2024a, ApJ, 971, 161, doi: 10.3847/1538-4357/ad5675
-
[75]
2024b, A&A, 690, A197, doi: 10.1051/0004-6361/202348782
Mitsuhashi, I., Tadaki, K.-i., Ikeda, R., et al. 2024b, A&A, 690, A197, doi: 10.1051/0004-6361/202348782
-
[76]
2024, ApJ, 963, 9, doi: 10.3847/1538-4357/ad1404
Morishita, T., Stiavelli, M., Chary, R.-R., et al. 2024, ApJ, 963, 9, doi: 10.3847/1538-4357/ad1404
-
[77]
Murphy, E. J. 2009, ApJ, 706, 482, doi: 10.1088/0004-637X/706/1/482
-
[78]
J., Dong, D., Momjian, E., et al
Murphy, E. J., Dong, D., Momjian, E., et al. 2018a, ApJS, 234, 24, doi: 10.3847/1538-4365/aa99d7
-
[79]
Murphy, E. J., Linden, S. T., Dong, D., et al. 2018b, ApJ, 862, 20, doi: 10.3847/1538-4357/aac5f5
-
[80]
Murphy, E. J., Helou, G., Condon, J. J., et al. 2010, ApJL, 709, L108, doi: 10.1088/2041-8205/709/2/L108
discussion (0)
Sign in with ORCID, Apple, or X to comment. Anyone can read and Pith papers without signing in.