Recognition: unknown
LiDAR based determination of spring constant using smartphones
Pith reviewed 2026-05-10 15:27 UTC · model grok-4.3
The pith
Smartphone LiDAR measures oscillation periods to determine spring constants that match theory.
A machine-rendered reading of the paper's core claim, the machinery that carries it, and where it could break.
Core claim
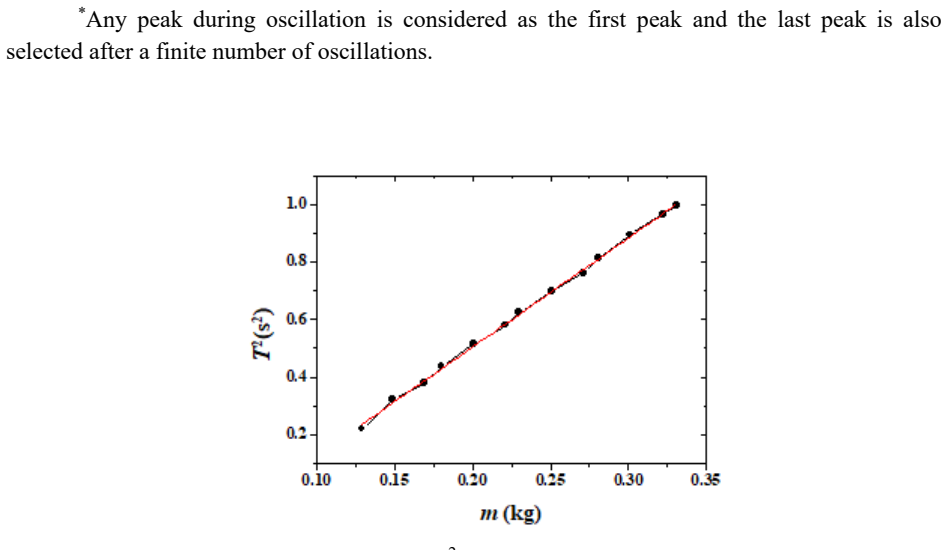
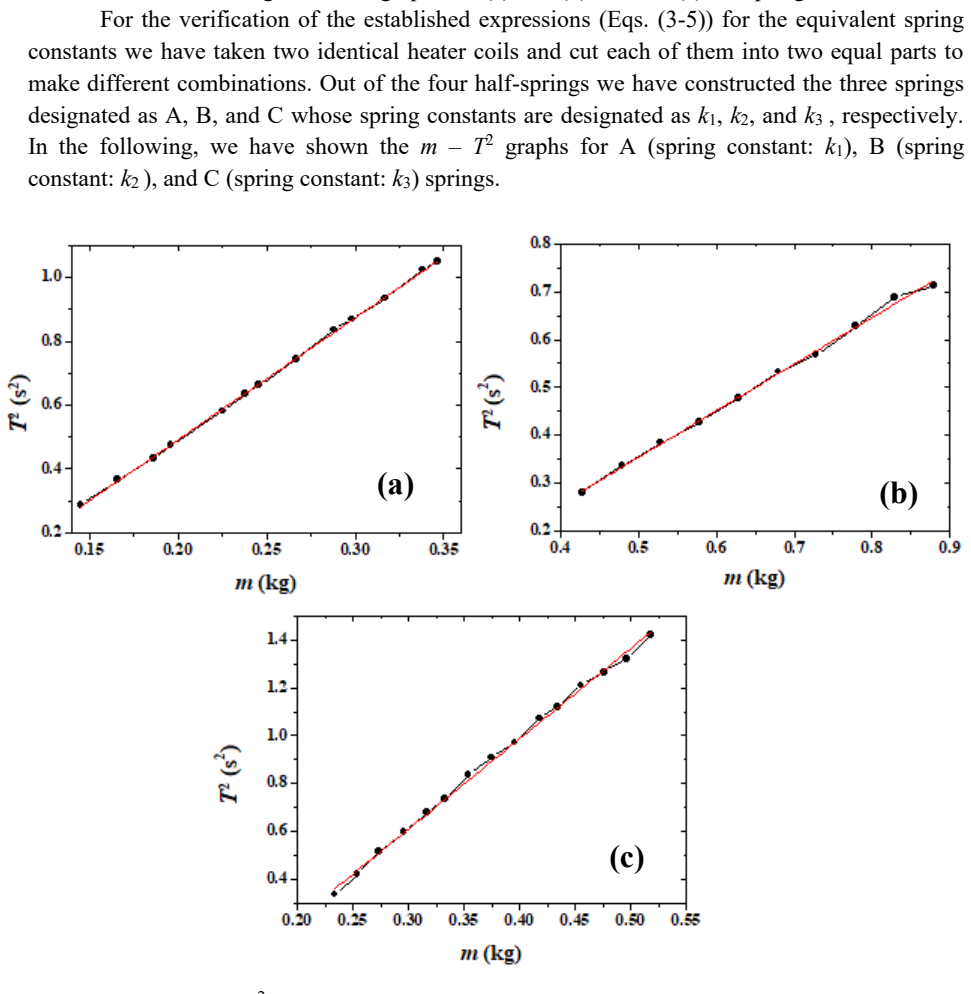
By recording the time-dependent displacement of the oscillating mass with the phone's LiDAR sensor, the period T is obtained directly; the spring constant k then follows from the relation k = 4π²m/T² for a known mass m. When this procedure is applied to several heater-coil springs and combinations, the measured k values lie within a few percent of the independently calculated theoretical stiffnesses.
What carries the argument
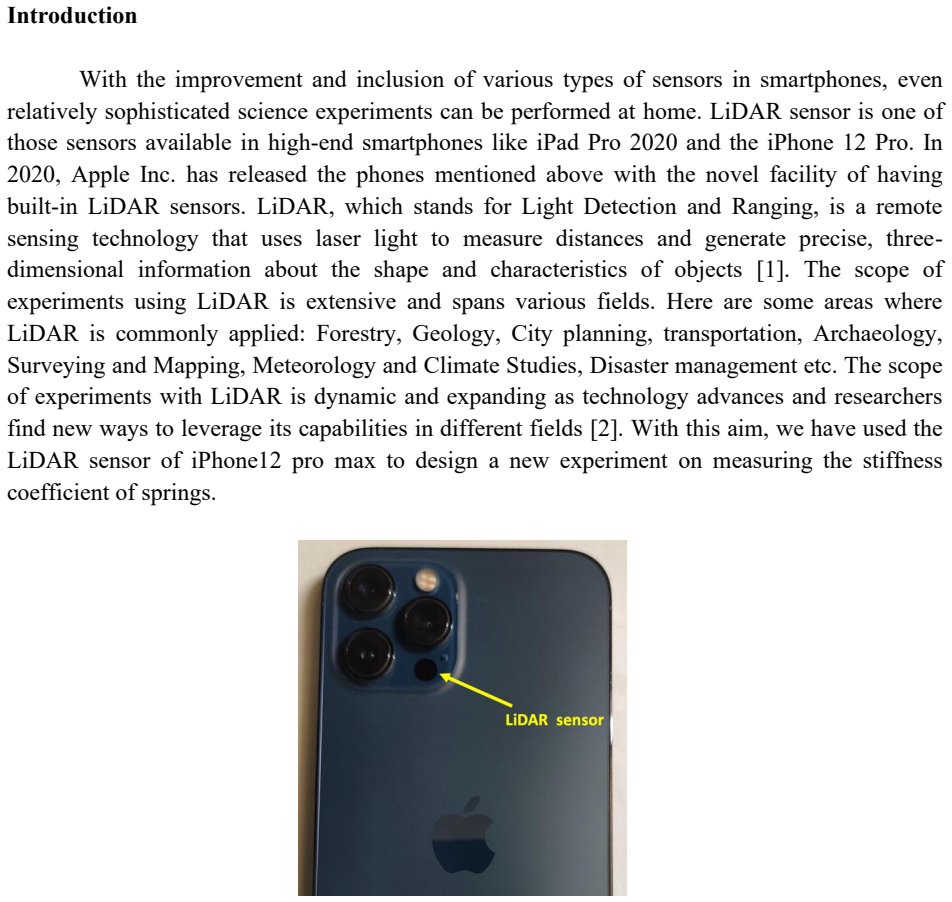
LiDAR sensor in the smartphone, accessed through the phyphox application, to record the periodic displacement of the attached mass and thereby determine the oscillation period.
If this is right
- High-school students can obtain quantitative spring-constant data without access to a physics laboratory.
- The same sensor-and-app combination works for multiple spring combinations, confirming the method is not limited to a single coil.
- The agreement between experiment and theory supports the use of consumer-grade distance sensors for other simple harmonic-motion experiments.
- No external power source or additional hardware is required beyond the phone and a hanging mass.
Where Pith is reading between the lines
- The approach could be adapted to measure effective spring constants in other everyday elastic objects such as rubber bands or foam.
- If the app logs raw position-time data, students could explore damping or nonlinear effects that the current period-only analysis omits.
- Widespread adoption would reduce the cost barrier for introductory mechanics labs in schools that lack dedicated equipment.
- The method supplies a concrete example of how a single smartphone sensor can replace an entire optical bench for displacement measurement.
Load-bearing premise
The LiDAR sensor must supply displacement data accurate enough to yield the true oscillation period without appreciable timing error or unaccounted damping.
What would settle it
A side-by-side comparison in which the same oscillation is recorded simultaneously by the phone LiDAR and by a calibrated laboratory displacement sensor; systematic deviation of the LiDAR-derived periods beyond the stated uncertainty would falsify the claim.
Figures

read the original abstract
A novel use of the LiDAR sensor of a smartphone in introductory physics experiments is discussed in this article. We have determined the spring constant for various combinations of springs using the LiDAR sensor of a smartphone through the phyphox application. An electrical heater coil is used as a spring, and the period of oscillation of a vertical spring-mass system is measured using a LiDAR sensor. The experimental values of spring constants agree with the theoretical values. A high school student can perform this simple experiment in a smart way at home.
Editorial analysis
A structured set of objections, weighed in public.
Referee Report
Summary. The manuscript describes a method for determining the spring constant of an electrical heater coil used as a spring in a vertical mass-spring system. The oscillation period is measured using the LiDAR sensor of a smartphone running the phyphox app, and the experimental spring constants (computed from the period via the standard SHO relation) are stated to agree with theoretical values. The work is positioned as a simple, accessible experiment suitable for high-school students at home.
Significance. If the experimental protocol were fully documented with quantitative data, error analysis, and validation against damping or sensor noise, the approach could provide a low-cost, smartphone-based alternative for introductory mechanics labs. The absence of any reported measurements, periods, masses, calculated k values, or uncertainty estimates in the current manuscript prevents assessment of whether the claimed agreement holds at the few-percent level typically expected in such experiments.
major comments (2)
- [Abstract] Abstract: The central claim that 'the experimental values of spring constants agree with the theoretical values' is unsupported by any data, tables, figures, error bars, sample sizes, or details of how the period T is extracted from the LiDAR time series. This directly undermines the soundness of the result, as the relation k = 4π²m/T² requires a measured T whose precision must be demonstrated to be better than the claimed agreement.
- The description of the LiDAR-based period measurement does not specify sampling rate, filtering, number of cycles averaged, or any correction for damping or air drag in the vertical heater-coil setup. These omissions are load-bearing because even small shifts in apparent T (a few percent) would invalidate the agreement claim without residual plots or uncertainty quantification.
minor comments (1)
- [Abstract] The abstract refers to 'various combinations of springs' while the method description focuses on a single heater coil; clarify whether multiple coils or added masses were tested and how combinations were formed.
Simulated Author's Rebuttal
We thank the referee for the thoughtful and detailed review of our manuscript. The comments highlight important areas where additional documentation and quantitative support will improve the clarity and rigor of the work. We address each major comment below and have prepared revisions to incorporate the requested details.
read point-by-point responses
-
Referee: [Abstract] Abstract: The central claim that 'the experimental values of spring constants agree with the theoretical values' is unsupported by any data, tables, figures, error bars, sample sizes, or details of how the period T is extracted from the LiDAR time series. This directly undermines the soundness of the result, as the relation k = 4π²m/T² requires a measured T whose precision must be demonstrated to be better than the claimed agreement.
Authors: We agree that the abstract claim requires explicit supporting evidence to be credible. The original manuscript focused on the method and qualitative agreement but did not include tabulated data or extraction details. In the revised version we will add a table reporting sample masses, measured periods (with standard deviations from multiple trials), computed k values, theoretical k values, and percentage differences. We will also include a figure of a representative LiDAR displacement time series with the fitting procedure used to extract T clearly annotated, along with a brief description of the period-determination algorithm. revision: yes
-
Referee: The description of the LiDAR-based period measurement does not specify sampling rate, filtering, number of cycles averaged, or any correction for damping or air drag in the vertical heater-coil setup. These omissions are load-bearing because even small shifts in apparent T (a few percent) would invalidate the agreement claim without residual plots or uncertainty quantification.
Authors: We accept that these technical parameters were omitted. The revised manuscript will state the LiDAR sampling rate employed in phyphox (approximately 20 Hz), note that no additional digital filtering beyond the app’s default was applied, and indicate that the period was obtained by averaging over 8–10 oscillation cycles. We will add a short paragraph discussing the low damping observed in the vertical heater-coil geometry and explain why a damping correction was not required for the reported precision; uncertainty estimates derived from repeated trials will be included, and a sample residual plot will be provided if space allows. revision: yes
Circularity Check
No circularity: direct experimental use of standard SHM formula
full rationale
The paper measures oscillation period T via smartphone LiDAR and phyphox, then computes experimental spring constant from the textbook relation k = 4π²m/T² for comparison against independent theoretical values (static deflection or coil properties). No step in the provided text reduces the result to a fitted parameter, self-definition, or self-citation chain; the derivation chain is a standard lab procedure whose output is falsifiable against external benchmarks and does not presuppose its own measured T.
Axiom & Free-Parameter Ledger
axioms (1)
- standard math The period T of a mass m attached to a spring with constant k follows T = 2π √(m/k) for small oscillations
Reference graph
Works this paper leans on
-
[1]
Luetzenburg G et al 2021 Evaluation of the Apple iPhone 12 Pro LiDAR for an Application in Geosciences Scientific Reports.11 22221
2021
-
[2]
Teach.60516–517
Bewersdorff A et al 2022 Measuring the speed of light in liquids with a smartphone Phys. Teach.60516–517
2022
-
[3]
Teach.19 404–405
Mills D S 1981 The spring and mass pendulum: An exercise in mathematical modeling Phys. Teach.19 404–405
1981
-
[4]
Educ.53 033002
Pili U 2018 A dynamic -based measurement of a spring constant with a smartphone light sensor Phys. Educ.53 033002
2018
-
[5]
Teach.57 198–199
Pili U et al 2019 Measuring a spring constant with a smartphone magnetic field sensor Phys. Teach.57 198–199
2019
-
[6]
Educ.56 035010
Gallitto A A et al 2021 Dynamic measurement of the elastic constant of an helicoidal spring by a smartphone Phys. Educ.56 035010
2021
-
[7]
Educ.58 043002
Pili U B 2023 Work-based measurement of k with a spring -mass system: a demo of the work done by a variable force Phys. Educ.58 043002
2023
-
[8]
Teach.54 138–141
Greene N R et al 2016 Finding the Effective Mass and Spring Constant of a Force Probe from Simple Harmonic Motion Phys. Teach.54 138–141
2016
-
[9]
Teach.4633
Serna J Det al 2011Studying springs in series using a single springPhys. Teach.4633
-
[10]
Educ.55065028
Coban A et al 2020 Determining of the spring constant using ArduinoPhys. Educ.55065028
2020
discussion (0)
Sign in with ORCID, Apple, or X to comment. Anyone can read and Pith papers without signing in.