Recognition: unknown
The Rise of Negative Earnings and Demand Shifting Investment
Pith reviewed 2026-05-08 17:06 UTC · model grok-4.3
The pith
An increase in the scale elasticity of demand explains the rise in firms reporting losses since 1980 and lowers GDP by 9 percent.
A machine-rendered reading of the paper's core claim, the machinery that carries it, and where it could break.
Core claim
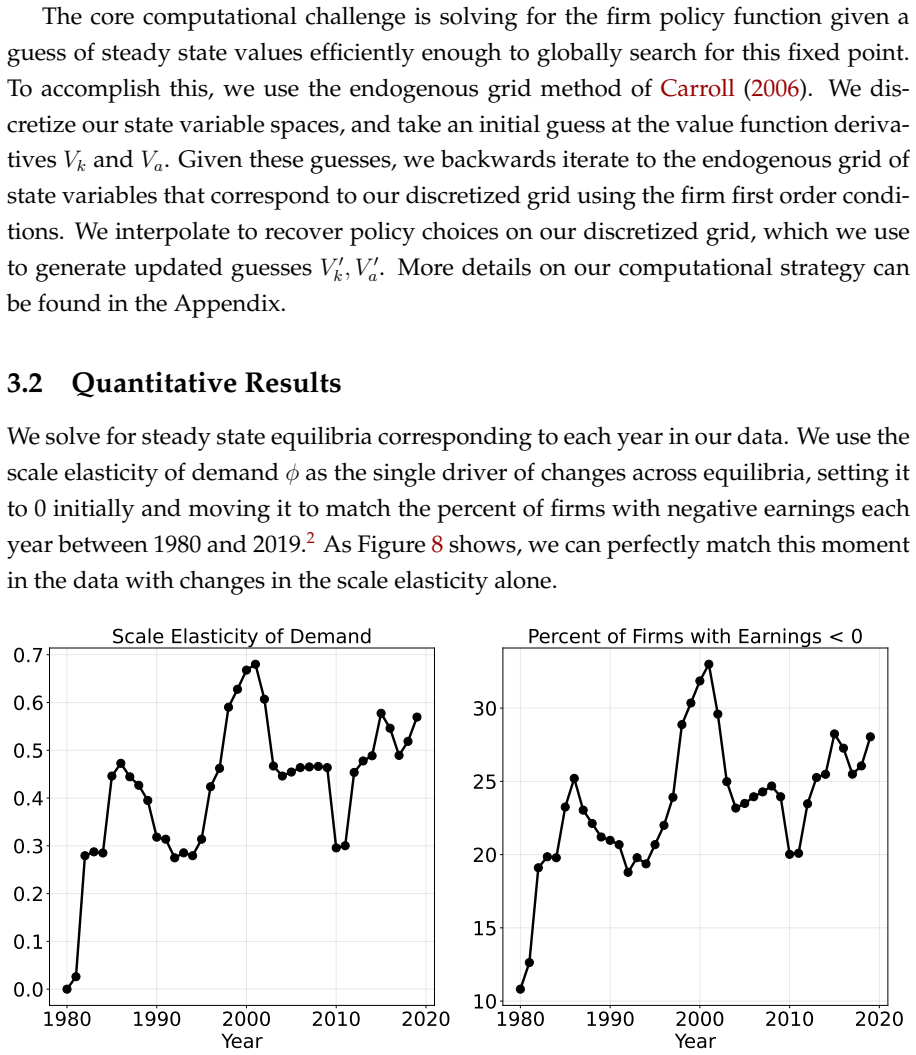
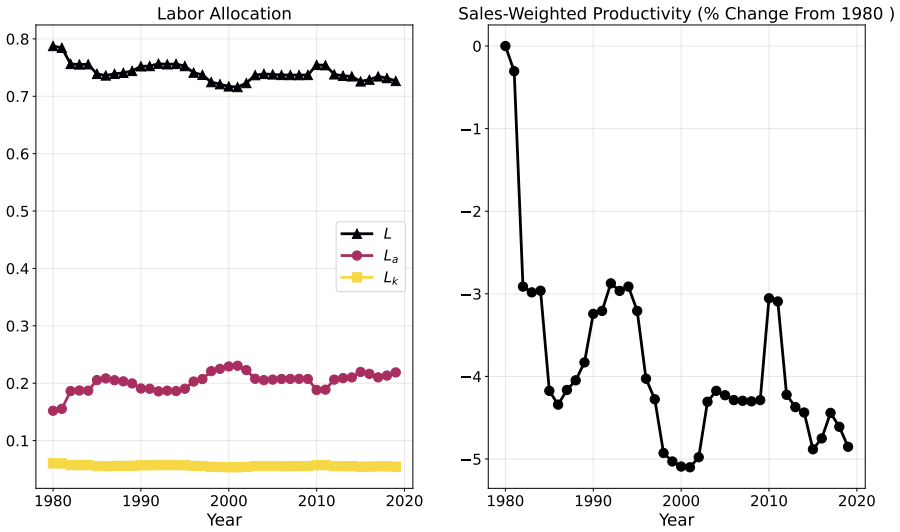
In a heterogeneous-firm model with supply and demand shifting investment, an increase in the scale elasticity of demand matches the secular rise in reported losses quantitatively and the increased persistence of losses, the spreading of the sales and earnings distribution, and the recomposition of firm spending qualitatively, with the resulting reallocation lowering GDP by 9.1 percent.
What carries the argument
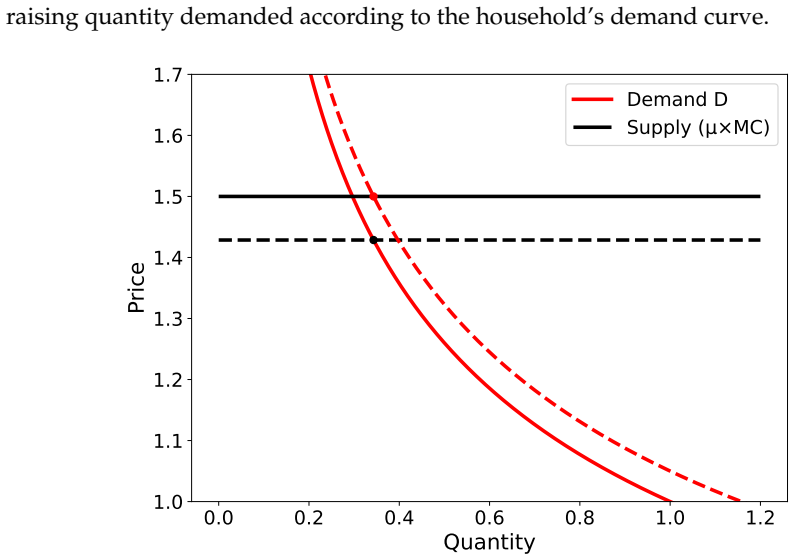
The scale elasticity of demand, which sets the relationship between the intensive margin (demand per customer) and extensive margin (number of customers) in a model where firms choose both supply and demand shifting investments.
If this is right
- Quantitatively reproduces the increase in the share of firms reporting losses.
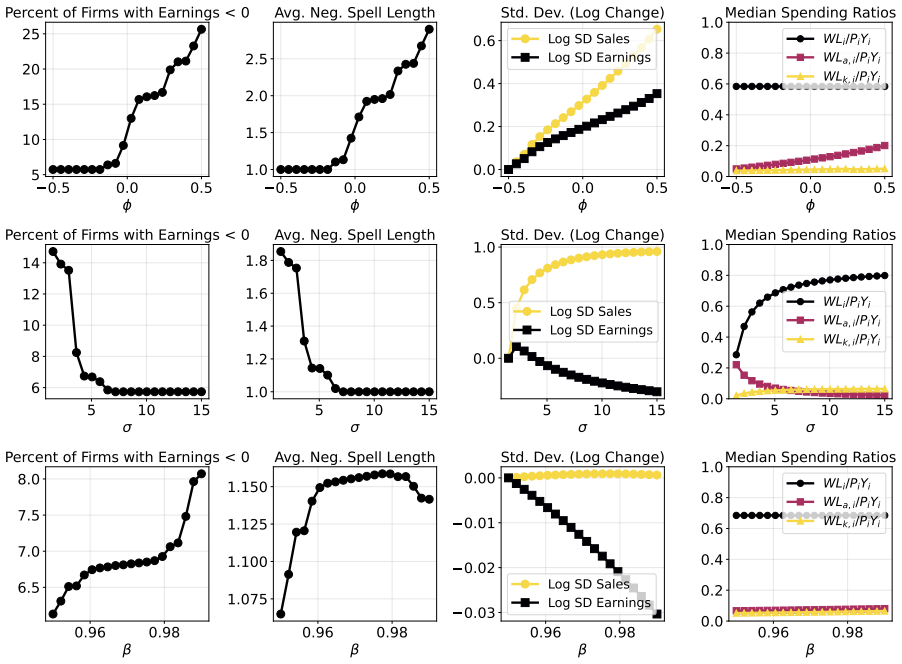
- Qualitatively accounts for higher persistence of losses, wider dispersion in sales and earnings, and the shift from production costs to SG&A expenses.
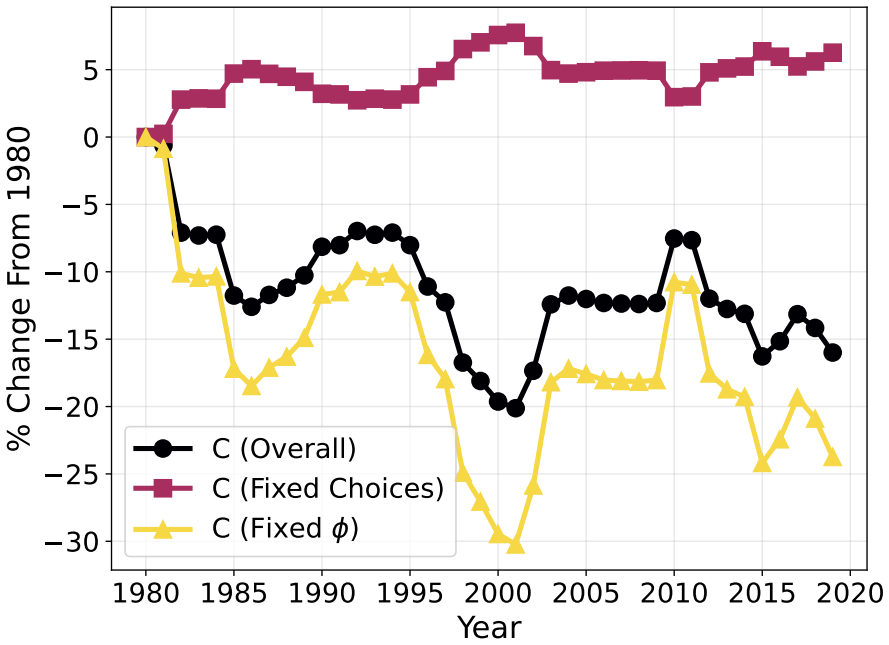
- Implies a 9.1 percent GDP reduction through reallocation of labor from goods and capital production and demand away from high-productivity firms.
Where Pith is reading between the lines
- Changes in how firms expand their customer base could affect aggregate productivity even if firm-level accounting identities remain unchanged.
- The framework suggests testing whether industries that rely more on demand-shifting activities exhibit stronger trends in loss persistence.
- Policies that alter the cost or return to expanding customer reach might have larger macroeconomic consequences than standard models predict.
Load-bearing premise
That a single exogenous rise in the scale elasticity of demand is the only change across steady states needed to produce the four observed trends in losses and spending.
What would settle it
Empirical evidence that the scale elasticity of demand has remained constant while other factors such as regulation or technological change account for the rise in losses without requiring this parameter shift.
Figures


read the original abstract
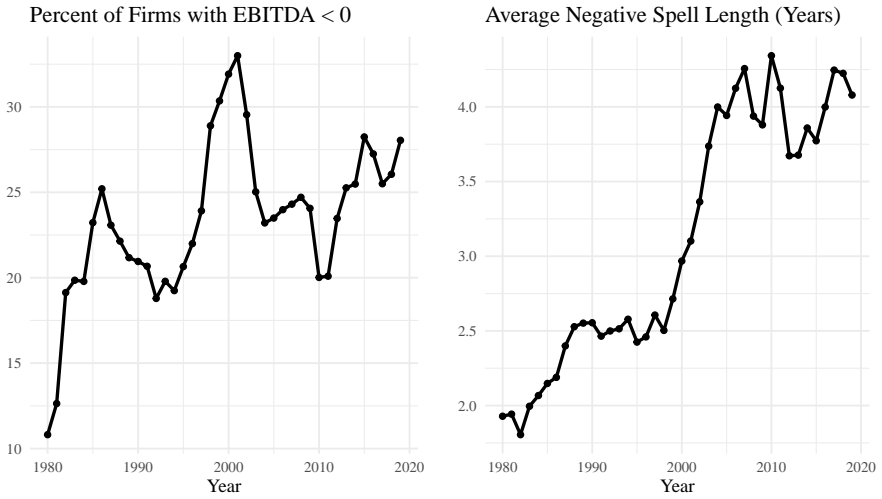
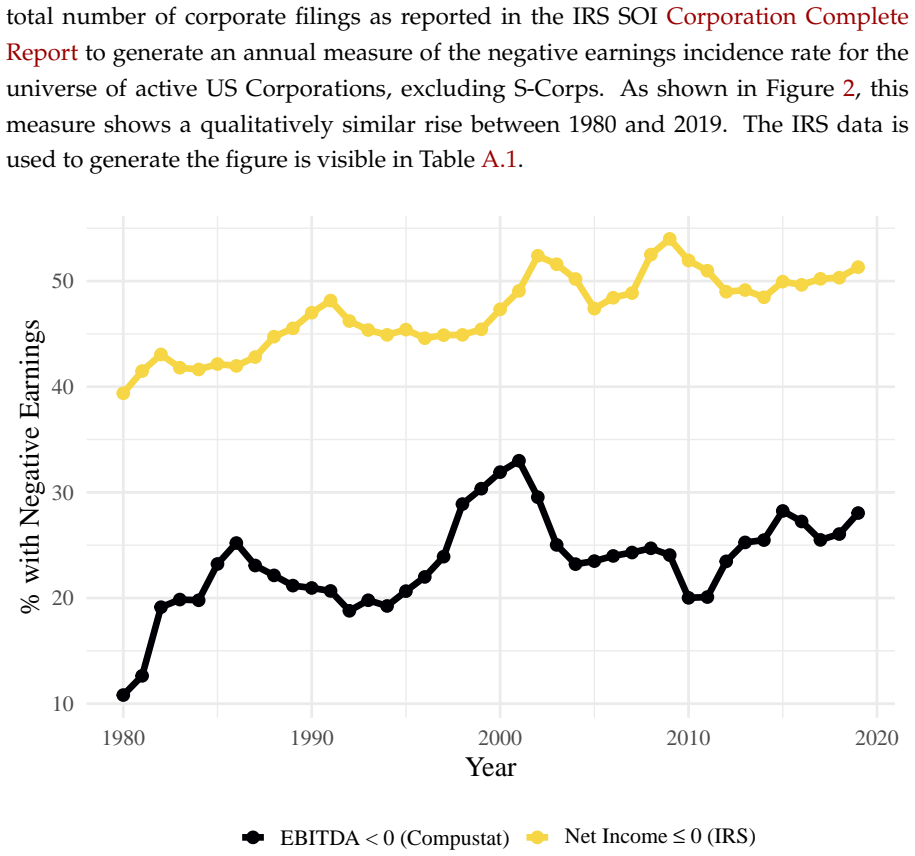
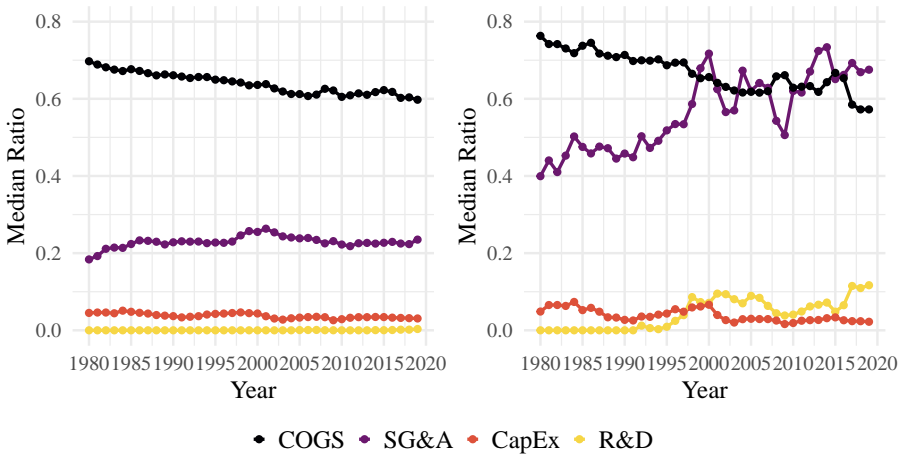
We document the rise of negative earnings between 1980 and 2019: a secular increase in the percent of firms reporting losses, both among public firms and in the broader universe of US corporations, and a secular increase in the persistence of losses year-to-year among public firms. This rise has occurred alongside a spreading of the sales and earnings distribution and a recomposition of firm spending away from production costs and traditional investment and towards sales general and administrative expenses. We rationalize these phenomena with a model of heterogenous firms engaging in supply and demand shifting investment. Our model includes a scale elasticity of demand determining the relationship between the intensive margin of demand (demand per customer) and the extensive margin of demand (number of customers). We are able to quantitatively match the rise in reported losses and qualitatively match (1) the increased persistence of losses, (2) the spreading of the sales and earning distribution and (3) the recomposition of firm spending with this parameter as the single driver of changes across steady state equilibria. The rise in the scale elasticity associated with the increase in reported losses has non-trivial aggregate implications: in our model it lowers GDP by -9.1% by reallocating labor away from goods and capital production and reallocating demand away from productive firms.
Editorial analysis
A structured set of objections, weighed in public.
Referee Report
Summary. The paper documents the rise in negative earnings among US firms from 1980 to 2019, including increases in the percent of firms reporting losses and their persistence, alongside spreading sales and earnings distributions and a shift in spending towards sales, general, and administrative expenses. It develops a model of heterogeneous firms that engage in supply and demand-shifting investment, featuring a scale elasticity of demand that governs the trade-off between intensive and extensive margins of demand. The model uses an increase in this scale elasticity as the sole driver to quantitatively match the rise in losses and qualitatively match the other three trends across steady-state equilibria, implying a 9.1% reduction in GDP through labor reallocation away from production and demand away from productive firms.
Significance. The paper provides a unified explanation for several secular trends in firm-level financials and spending patterns using a single parameter change in a heterogeneous-firm model. If the model structure and calibration are robust, it highlights non-trivial aggregate costs from increased demand-shifting behavior. The strength lies in linking micro trends to macro implications through demand margins, though the direct calibration to the loss rate limits independent validation.
major comments (2)
- [Abstract (calibration description)] The abstract states that the model quantitatively matches the rise in reported losses with the scale elasticity of demand as the single driver of changes across steady-state equilibria. Because this parameter is calibrated directly to the loss-rate moment, the quantitative match is by construction; the qualitative reproduction of loss persistence, sales/earnings dispersion, and the shift toward SGA spending therefore inherits the same steady-state mapping rather than providing independent evidence.
- [Aggregate implications] The reported -9.1% GDP effect is generated by the model's specific functional forms that translate the rise in scale elasticity into labor reallocation away from goods/capital production and demand away from productive firms. No robustness checks, alternative parameterizations, or counterfactuals with other contemporaneous shocks (e.g., productivity or competition) are reported to establish that the aggregate implication is not an artifact of the chosen calibration target and functional forms.
minor comments (1)
- [Abstract] The abstract could more explicitly state whether any other parameters or exogenous processes are allowed to vary across the two steady states or whether the scale elasticity is strictly the only change.
Simulated Author's Rebuttal
We thank the referee for the detailed and constructive comments. We address each major point below, acknowledging where the calibration is by construction while highlighting the model's unifying mechanism, and outlining revisions to strengthen the aggregate implications section.
read point-by-point responses
-
Referee: [Abstract (calibration description)] The abstract states that the model quantitatively matches the rise in reported losses with the scale elasticity of demand as the single driver of changes across steady-state equilibria. Because this parameter is calibrated directly to the loss-rate moment, the quantitative match is by construction; the qualitative reproduction of loss persistence, sales/earnings dispersion, and the shift toward SGA spending therefore inherits the same steady-state mapping rather than providing independent evidence.
Authors: We agree that the quantitative match to the rise in the loss rate is by construction, since the scale elasticity of demand is calibrated to this moment to match the 2019 steady state. The paper's contribution lies in showing that this single change, disciplined solely by the loss-rate target, generates qualitative matches to the other three trends (loss persistence, spreading distributions, and SGA recomposition) through the model's demand-shifting investment mechanism without additional free parameters. This provides evidence of the mechanism's consistency rather than independent quantitative validation for every moment. We will revise the abstract to clarify that the loss rate serves as the explicit calibration target while the remaining trends are out-of-sample qualitative predictions. revision: partial
-
Referee: [Aggregate implications] The reported -9.1% GDP effect is generated by the model's specific functional forms that translate the rise in scale elasticity into labor reallocation away from goods/capital production and demand away from productive firms. No robustness checks, alternative parameterizations, or counterfactuals with other contemporaneous shocks (e.g., productivity or competition) are reported to establish that the aggregate implication is not an artifact of the chosen calibration target and functional forms.
Authors: We acknowledge that the -9.1% GDP reduction arises from the interaction of the calibrated scale elasticity with the model's functional forms governing labor reallocation and demand shifting. To strengthen this claim, we will add a new subsection with robustness checks, including alternative demand function parameterizations, sensitivity to the elasticity of substitution, and counterfactuals that introduce other shocks (such as productivity declines or increased competition) while holding the scale elasticity fixed. These exercises will demonstrate that the aggregate costs are primarily driven by the demand margin rather than being an artifact of the baseline setup. revision: yes
Circularity Check
Scale elasticity calibrated directly to loss-rate rise makes qualitative matches and GDP effect consequences of the same steady-state mapping
specific steps
-
fitted input called prediction
[Abstract]
"We are able to quantitatively match the rise in reported losses and qualitatively match (1) the increased persistence of losses, (2) the spreading of the sales and earning distribution and (3) the recomposition of firm spending with this parameter as the single driver of changes across steady state equilibria."
The scale elasticity is explicitly chosen and adjusted as the single driver to quantitatively match the rise in reported losses. The qualitative matches to the other three trends are then generated by the identical steady-state mapping that was used for that calibration, so they are not independent out-of-sample predictions but direct implications of the fitted parameter.
full rationale
The paper selects the scale elasticity of demand as the sole exogenous driver and adjusts it to quantitatively reproduce the secular rise in reported losses across steady states. The claimed qualitative reproduction of loss persistence, sales/earnings dispersion, and spending recomposition then follows automatically from the model's steady-state equilibrium conditions under that calibrated parameter value. The -9.1% GDP reallocation result is likewise generated by the same calibrated equilibrium, with no independent micro evidence or alternative-shock counterfactual offered to establish that other contemporaneous changes are unnecessary. This matches the 'fitted input called prediction' pattern but does not extend to self-definition, self-citation chains, or imported uniqueness theorems.
Axiom & Free-Parameter Ledger
free parameters (1)
- scale elasticity of demand
axioms (2)
- domain assumption Firms are heterogeneous and can invest in either supply or demand shifting.
- domain assumption A scale elasticity governs the relationship between demand per customer and number of customers.
Reference graph
Works this paper leans on
-
[1]
ackerbergIdentificationPropertiesRecent2015 APACrefauthors Ackerberg, D A. , Caves, K. \ Frazer, G. APACrefauthors \ 2015 . Identification Properties of Recent Production Function Estimators Identification Properties of Recent Production Function Estimators . Econometrica 83 6 2411--2451 . APACrefDOI doi:10.3982/ECTA13408 APACrefDOI
-
[2]
, Drenik, A
afrouziConcentrationMarketPower2023 APACrefauthors Afrouzi, H. , Drenik, A. \ Kim, R. APACrefauthors \ 2025 . Concentration, Market Power , and Misallocation : The Role of Endogenous Customer Acquisition Concentration, Market Power , and Misallocation : The Role of Endogenous Customer Acquisition
2025
-
[3]
arkolakisMarketPenetrationCosts2010 APACrefauthors Arkolakis, C. APACrefauthors \ 2010 12 . Market Penetration Costs and the New Consumers Margin in International Trade Market Penetration Costs and the New Consumers Margin in International Trade . Journal of Political Economy 118 6 1151--1199 . APACrefDOI doi:10.1086/657949 APACrefDOI
-
[4]
autorFallLaborShare2020 APACrefauthors Autor, D. , Dorn, D. , Katz, L F. , Patterson, C. \ Van Reenen, J. APACrefauthors \ 2020 05 . The Fall of the Labor Share and the Rise of Superstar Firms * The Fall of the Labor Share and the Rise of Superstar Firms * . The Quarterly Journal of Economics 135 2 645--709 . APACrefDOI doi:10.1093/qje/qjaa004 APACrefDOI
-
[5]
bronnenbergMarketingInvestmentIntangible2022 APACrefauthors Bronnenberg, B J. , Dub \'e , J P. \ Syverson, C. APACrefauthors \ 2022 08 . Marketing Investment and Intangible Brand Capital Marketing Investment and Intangible Brand Capital . Journal of Economic Perspectives 36 3 53--74 . APACrefDOI doi:10.1257/jep.36.3.53 APACrefDOI
-
[6]
carrollMethodEndogenousGridpoints2006 APACrefauthors Carroll, C D. APACrefauthors \ 2006 06 . The Method of Endogenous Gridpoints for Solving Dynamic Stochastic Optimization Problems The method of endogenous gridpoints for solving dynamic stochastic optimization problems . Economics Letters 91 3 312--320 . APACrefDOI doi:10.1016/j.econlet.2005.09.013 APACrefDOI
-
[7]
crouzetEconomicsIntangibleCapital2022 APACrefauthors Crouzet, N. , Eberly, J C. , Eisfeldt, A L. \ Papanikolaou, D. APACrefauthors \ 2022 08 . The Economics of Intangible Capital The Economics of Intangible Capital . Journal of Economic Perspectives 36 3 29--52 . APACrefDOI doi:10.1257/jep.36.3.29 APACrefDOI
-
[8]
deloeckerMarkupsFirmLevelExport2012 APACrefauthors De Loecker, J. \ Warzynski, F. APACrefauthors \ 2012 05 . Markups and Firm-Level Export Status Markups and Firm-Level Export Status . American Economic Review 102 6 2437--2471 . APACrefDOI doi:10.1257/aer.102.6.2437 APACrefDOI
-
[9]
denisPersistentOperatingLosses2016 APACrefauthors Denis, D J. \ McKeon, S B. APACrefauthors \ 2016 . Persistent Operating Losses and Corporate Financial Policies Persistent Operating Losses and Corporate Financial Policies . SSRN Electronic Journal . APACrefDOI doi:10.2139/ssrn.2881584 APACrefDOI
-
[10]
, Duprez, C
Dhyne2023Belgian APACrefauthors Dhyne, E. , Duprez, C. \ Komatsu, T. APACrefauthors \ 2023 . The Belgian Business-to-Business Transactions Dataset 2002-2021 The Belgian business-to-business transactions dataset 2002-2021 \ NBB Working Paper \ 444 . Brussels National Bank of Belgium
2023
-
[11]
eisfeldtOrganizationCapitalCrossSection2013 APACrefauthors Eisfeldt, A L. \ Papanikolaou, D. APACrefauthors \ 2013 . Organization Capital and the Cross-Section of Expected Returns Organization Capital and the Cross-Section of Expected Returns . The Journal of Finance 68 4 1365--1406 . APACrefDOI doi:10.1111/jofi.12034 APACrefDOI
-
[12]
gourioCanIntangibleCapital2014 APACrefauthors Gourio, F. \ Rudanko, L. APACrefauthors \ 2014 05 . Can Intangible Capital Explain Cyclical Movements in the Labor Wedge ? Can Intangible Capital Explain Cyclical Movements in the Labor Wedge ? American Economic Review 104 5 183--188 . APACrefDOI doi:10.1257/aer.104.5.183 APACrefDOI
-
[13]
greenwoodYouWillMacroeconomic2025 APACrefauthors Greenwood, J. , Ma, Y. \ Yorukoglu, M. APACrefauthors \ 2025 05 . `` You Will :'' A Macroeconomic Analysis of Digital Advertising `` You Will :'' A Macroeconomic Analysis of Digital Advertising . Review of Economic Studies 92 3 1837--1881 . APACrefDOI doi:10.1093/restud/rdae067 APACrefDOI
-
[14]
heInvestingCustomerCapital2024 APACrefauthors He, B. , Mostrom, L I. \ Sufi, A. APACrefauthors \ 2024 11 . Investing in Customer Capital Investing in Customer Capital \ (Working Paper \ \ 33171). National Bureau of Economic Research . APACrefDOI doi:10.3386/w33171 APACrefDOI
-
[15]
\ Rogerson, R
hopenhaynJobTurnoverPolicy1993 APACrefauthors Hopenhayn, H. \ Rogerson, R. APACrefauthors \ 1993 . Job Turnover and Policy Evaluation : A General Equilibrium Analysis Job Turnover and Policy Evaluation : A General Equilibrium Analysis . Journal of Political Economy 101 5 915--938
1993
-
[16]
hsiehMisallocationManufacturingTFP2009a APACrefauthors Hsieh, C T. \ Klenow, P J. APACrefauthors \ 2009 11 . Misallocation and Manufacturing TFP in China and India * Misallocation and Manufacturing TFP in China and India * . The Quarterly Journal of Economics 124 4 1403--1448 . APACrefDOI doi:10.1162/qjec.2009.124.4.1403 APACrefDOI
-
[17]
\ Nord, L
hubmerInvestmentDemandDynamic APACrefauthors Hubmer, J. \ Nord, L. APACrefauthors \ 2026 12 . Investment in Demand and Dynamic Competition for Customers Investment in Demand and Dynamic Competition for Customers
2026
-
[18]
kahleUSPublicCorporation2017 APACrefauthors Kahle, K M. \ Stulz, R M. APACrefauthors \ 2017 08 . Is the US Public Corporation in Trouble ? Is the US Public Corporation in Trouble ? Journal of Economic Perspectives 31 3 67--88 . APACrefDOI doi:10.1257/jep.31.3.67 APACrefDOI
-
[19]
kwon100YearsRising2024 APACrefauthors Kwon, S Y. , Ma, Y. \ Zimmermann, K. APACrefauthors \ 2024 07 . 100 Years of Rising Corporate Concentration 100 Years of Rising Corporate Concentration . American Economic Review 114 7 2111--2140 . APACrefDOI doi:10.1257/aer.20220621 APACrefDOI
-
[20]
APACrefauthors \ 2003
melitzImpactTradeIntraIndustry2003 APACrefauthors Melitz, M J. APACrefauthors \ 2003 . The Impact of Trade on Intra-Industry Reallocations and Aggregate Industry Productivity The Impact of Trade on Intra-Industry Reallocations and Aggregate Industry Productivity . Econometrica 71 6 1695--1725
2003
-
[21]
petersIntangibleCapitalInvestmentq2017 APACrefauthors Peters, R H. \ Taylor, L A. APACrefauthors \ 2017 02 . Intangible Capital and the Investment-q Relation Intangible capital and the investment-q relation . Journal of Financial Economics 123 2 251--272 . APACrefDOI doi:10.1016/j.jfineco.2016.03.011 APACrefDOI
-
[22]
, Grassi, B
ridderHitchhikersGuideMarkup2022 APACrefauthors Ridder, M D. , Grassi, B. \ Morzenti, G. APACrefauthors \ 2022 07 . The Hitchhiker 's Guide to Markup Estimation The Hitchhiker 's Guide to Markup Estimation . Discussion Papers 2210
2022
discussion (0)
Sign in with ORCID, Apple, or X to comment. Anyone can read and Pith papers without signing in.