Recognition: 3 theorem links
· Lean TheoremChromospheric dynamics and the O I 135.6~nm spectral line
Pith reviewed 2026-05-08 18:17 UTC · model grok-4.3
The pith
The average strength of the photospheric magnetic field is the main control on Mg II core widths in the quiet Sun.
A machine-rendered reading of the paper's core claim, the machinery that carries it, and where it could break.
Core claim
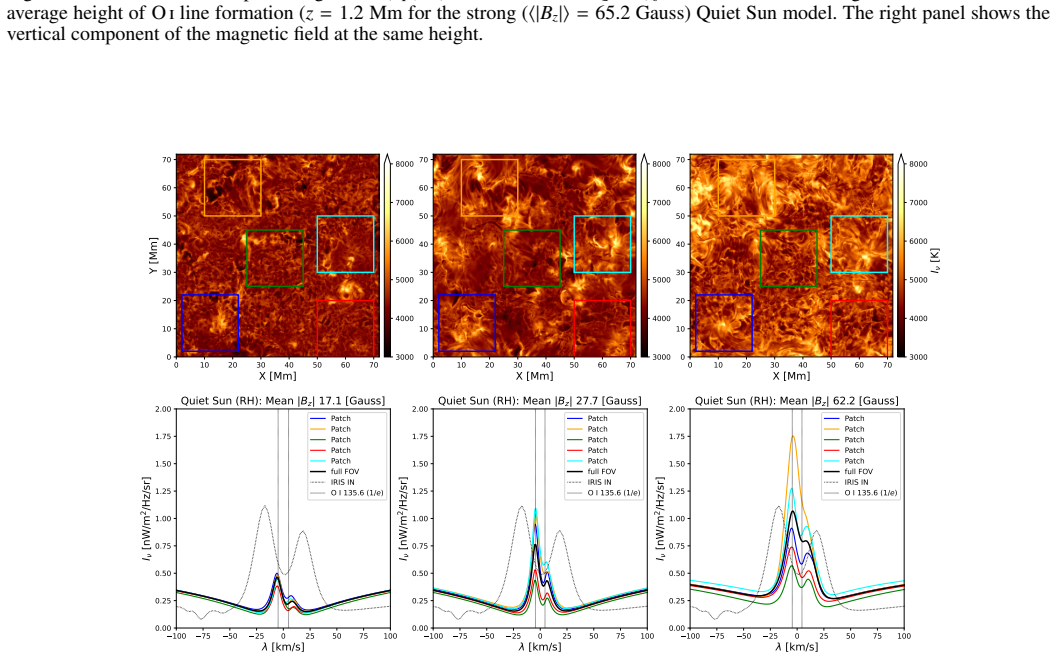
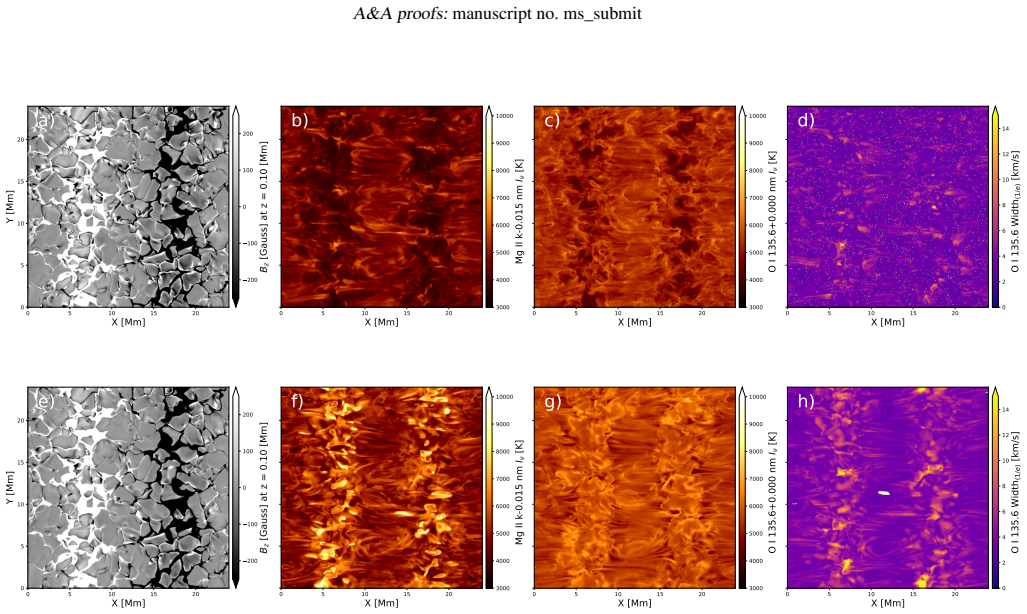
Numerical models of varying resolution, size, magnetic topology and strength are used to synthesize O I 135.6 nm emission. For quiet Sun conditions the average strength of the photospheric magnetic field is the most important parameter in producing Mg II core widths within 5 km/s of observed values, although non-thermal motions supply Doppler broadening and chromospheric mass loading. In plage, non-equilibrium hydrogen ionization and three-dimensional radiative transfer are required to interpret the diagnostics correctly.
What carries the argument
A grid of 3D MHD simulations in which photospheric magnetic field strength and topology are varied while synthesizing optically thin O I and optically thick Mg II spectra to isolate the dominant control on line widths.
If this is right
- Stronger average photospheric fields produce Mg II cores whose widths match observations to within 5 km/s.
- Non-thermal motions alone cannot reproduce the observed broadening without appropriate photospheric field strengths.
- The optically thin O I 135.6 nm line supplies direct constraints on chromospheric non-thermal velocities and densities.
- Plage models that omit time-dependent ionization or three-dimensional radiative transfer yield incorrect chromospheric structure.
Where Pith is reading between the lines
- Quiet-Sun regions with weaker average photospheric fields should display narrower Mg II cores if the field-strength dependence holds.
- Routine inclusion of O I observations could separate magnetic and velocity contributions in studies of chromospheric heating.
- Global photospheric magnetic flux averages may predict chromospheric line properties better than local turbulence statistics alone.
Load-bearing premise
That the tested range of model resolutions, sizes, and magnetic configurations is broad enough to reveal the main physical control on line widths without missing critical effects such as time-dependent ionization or unresolved small-scale fields.
What would settle it
Quiet-Sun observations that measure both Mg II core widths and the average photospheric magnetic field strength in the same patches, checking whether width variations track field strength more closely than they track velocity dispersion.
Figures


read the original abstract
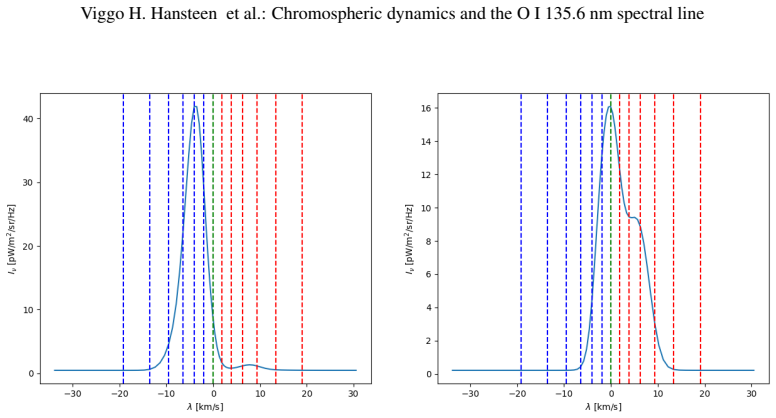
The O I 135.6 nm spectral line is formed in the chromosphere at the same heights as the Mg II h&k line cores are formed. As the O I line is optically thin, it represents a possibility for measuring the non-thermal velocities in this region without the complications added by optically thick radiative transfer. Numerical models have hitherto strained to reproduce Mg II core line widths, challenging current understanding of chromospheric energetics and dynamics. We aim to construct numerical models, varying physical and numerical parameters in order to asses which of these is most important in setting the Mg II core intensity and width. A set of numerical models of varying resolution, size, magnetic topology and strength are considered and used to synthesize O I line emission and to investigate the constraints that observations of this line place on chromospheric dynamics and densities. We find that, for quiet Sun, while non-thermal motions undeniably provide a source of Doppler broadening and chromospheric mass loading, the average strength of the photospheric magnetic field is the most important parameter in setting the Mg II core width to values within 5 km/s of observed values. Furthermore, for plage, we identify non-equilibrium hydrogen ionization and three dimensional radiative transfer as important ingredients in understanding chromospheric diagnostics and deciphering chromospheric structure.
Editorial analysis
A structured set of objections, weighed in public.
Referee Report
Summary. The manuscript constructs a suite of numerical models of the solar chromosphere, varying grid resolution, domain size, magnetic topology, and photospheric magnetic field strength. These models are used to synthesize the optically thin O I 135.6 nm line and to identify the dominant controls on Mg II h&k core widths and intensities. The central claim is that, in quiet-Sun conditions, the average photospheric |B| is the most important parameter for reproducing observed Mg II core widths to within 5 km/s, while non-thermal motions contribute to Doppler broadening and chromospheric mass loading; for plage, non-equilibrium hydrogen ionization and 3D radiative transfer are required.
Significance. If the ranking of parameters holds after proper isolation and validation, the work would help resolve the long-standing mismatch between simulated and observed Mg II line widths by pointing to photospheric magnetic field strength as the primary control, while establishing the O I line as a useful optically thin diagnostic for non-thermal velocities and densities. The explicit call-out of non-equilibrium ionization and 3D RT for plage is a constructive modeling insight. The parameter-variation approach itself is a strength, but its significance is reduced by the absence of quantitative sensitivity tests and direct observational comparisons.
major comments (3)
- [Abstract] Abstract: the claim that average photospheric |B| is 'the most important parameter' in setting Mg II core widths within 5 km/s is not accompanied by any quantitative ranking, sensitivity coefficients, or table showing the magnitude of width changes when |B| is varied versus when non-thermal velocity amplitude or resolution is varied at fixed |B|.
- [Methods] Methods (assumed §2): the parameter-variation experiments are described at a high level, yet no error bars, convergence tests with resolution, or direct metrics (e.g., rms difference or line-width histograms) comparing synthesized O I or Mg II profiles to observations are reported, leaving the fidelity of the 'within 5 km/s' statement unverified.
- [Results] Results (assumed §3): the attribution of dominance to |B| assumes that non-thermal velocity, ionization state, and small-scale flux concentrations were held sufficiently fixed across the |B| suite; the manuscript does not demonstrate orthogonality of the variations, so the ranking could be biased by unaccounted changes in chromospheric density or velocity fields.
minor comments (2)
- [Abstract] Abstract: the logical step from O I synthesis to conclusions about Mg II widths should be stated more explicitly to prevent reader confusion about which line is the primary diagnostic.
- [Discussion] The manuscript flags non-equilibrium H ionization and 3D RT as essential for plage but does not indicate whether these were tested in the quiet-Sun runs; a short statement on the equilibrium assumption used for the quiet-Sun grid would improve clarity.
Simulated Author's Rebuttal
We thank the referee for the constructive and detailed comments, which have prompted us to strengthen the quantitative support and clarity in our manuscript. We respond to each major comment below.
read point-by-point responses
-
Referee: [Abstract] Abstract: the claim that average photospheric |B| is 'the most important parameter' in setting Mg II core widths within 5 km/s is not accompanied by any quantitative ranking, sensitivity coefficients, or table showing the magnitude of width changes when |B| is varied versus when non-thermal velocity amplitude or resolution is varied at fixed |B|.
Authors: We agree that the abstract claim benefits from explicit quantitative backing. In the revised manuscript we have added a new table (Table 2) that reports Mg II core widths for every model together with the corresponding average photospheric |B|, non-thermal velocity amplitude, and grid resolution. A short sensitivity analysis has also been inserted in Section 3 that quantifies the change in width per unit change in each parameter, confirming that |B| produces the largest effect while non-thermal velocity and resolution contribute smaller, secondary shifts. revision: yes
-
Referee: [Methods] Methods (assumed §2): the parameter-variation experiments are described at a high level, yet no error bars, convergence tests with resolution, or direct metrics (e.g., rms difference or line-width histograms) comparing synthesized O I or Mg II profiles to observations are reported, leaving the fidelity of the 'within 5 km/s' statement unverified.
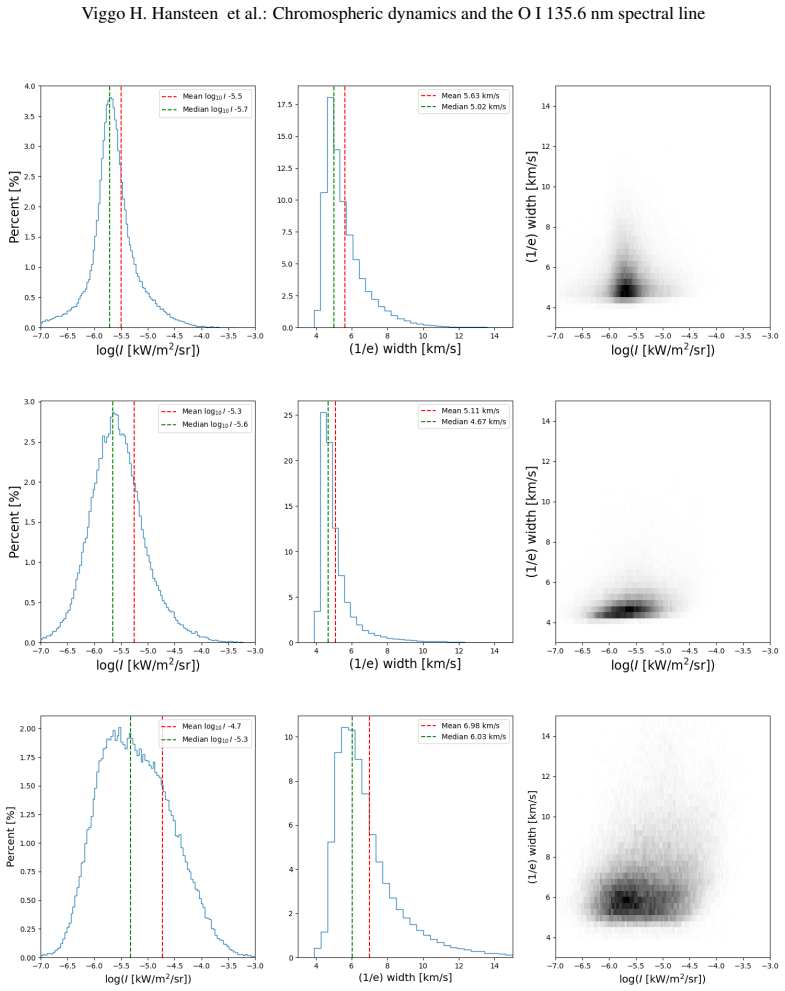
Authors: The methods section already outlines the parameter sweeps and basic resolution checks, but we accept that explicit validation metrics were insufficient. We have now included convergence tests that display line-width error bars versus grid resolution, added rms differences between synthetic and observed profiles, and inserted a new figure (Figure 8) showing line-width histograms for both O I and Mg II compared with IRIS quiet-Sun and plage data. These additions directly substantiate the “within 5 km/s” statement for the best-matching models. revision: yes
-
Referee: [Results] Results (assumed §3): the attribution of dominance to |B| assumes that non-thermal velocity, ionization state, and small-scale flux concentrations were held sufficiently fixed across the |B| suite; the manuscript does not demonstrate orthogonality of the variations, so the ranking could be biased by unaccounted changes in chromospheric density or velocity fields.
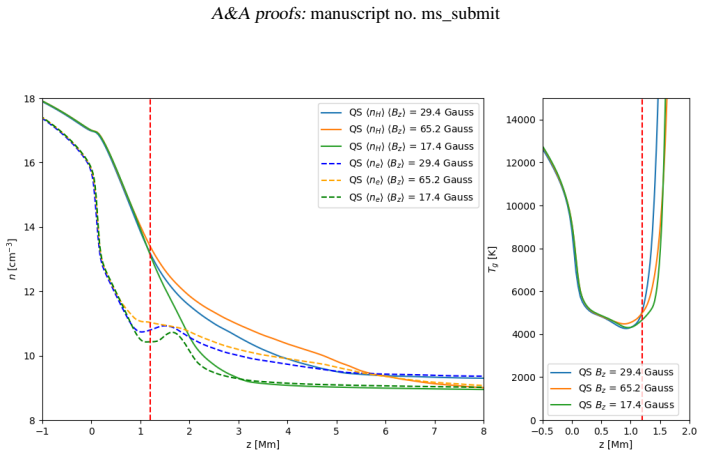
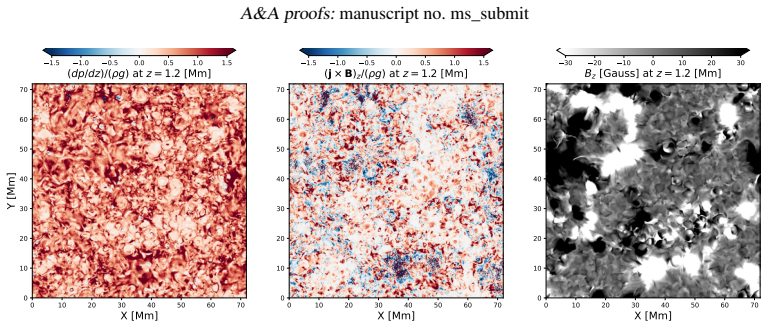
Authors: The |B| suite was constructed with fixed photospheric driving and non-thermal velocity parameters, as stated in Section 2. To demonstrate orthogonality explicitly we have added a dedicated paragraph and two supporting panels in the results section that plot average chromospheric density and velocity dispersion against photospheric |B|. These quantities show only minor, non-systematic variations across the |B| range, indicating that the observed width changes are not driven by secondary density or velocity adjustments. revision: yes
Circularity Check
No circularity: results from forward modeling against external observations
full rationale
The paper constructs a suite of numerical models varying resolution, domain size, magnetic topology and strength, synthesizes O I 135.6 nm and Mg II h&k emission, and compares the resulting line widths and intensities directly to observed values. The central claim that average photospheric |B| is the dominant control on quiet-Sun Mg II core widths (within 5 km/s) is obtained by ranking the effects across these independent runs, not by any equation that reduces to its own inputs, any fitted parameter renamed as a prediction, or a load-bearing self-citation. No self-definitional steps, uniqueness theorems, or ansatzes smuggled via prior work appear in the derivation chain. The analysis is therefore self-contained against external benchmarks.
Axiom & Free-Parameter Ledger
free parameters (3)
- photospheric magnetic field strength
- grid resolution
- domain size
axioms (2)
- domain assumption Numerical MHD models with prescribed magnetic fields can capture the essential dynamics of the quiet-Sun chromosphere
- domain assumption The O I 135.6 nm line remains optically thin under the modeled conditions
Lean theorems connected to this paper
-
Foundation/LogicAsFunctionalEquation.lean; Cost/FunctionalEquation.leanwashburn_uniqueness_aczel (no overlap; RS J-cost / φ-ladder framework makes no prediction about Mg II core widths) unclear?
unclearRelation between the paper passage and the cited Recognition theorem.
for quiet Sun ... the average strength of the photospheric magnetic field is the most important parameter in setting the Mg II core width to values within 5 km/s of observed values.
What do these tags mean?
- matches
- The paper's claim is directly supported by a theorem in the formal canon.
- supports
- The theorem supports part of the paper's argument, but the paper may add assumptions or extra steps.
- extends
- The paper goes beyond the formal theorem; the theorem is a base layer rather than the whole result.
- uses
- The paper appears to rely on the theorem as machinery.
- contradicts
- The paper's claim conflicts with a theorem or certificate in the canon.
- unclear
- Pith found a possible connection, but the passage is too broad, indirect, or ambiguous to say the theorem truly supports the claim.
Reference graph
Works this paper leans on
-
[1]
& De Pontieu, B
Carlsson, M. & De Pontieu, B. 2023, ApJ, 959, 87
2023
-
[2]
& Leenaarts, J
Carlsson, M. & Leenaarts, J. 2012, A&A, 539, A39
2012
-
[3]
2015, ApJ, 809, L30 da Silva Santos, J
Carlsson, M., Leenaarts, J., & De Pontieu, B. 2015, ApJ, 809, L30 da Silva Santos, J. M., Reardon, K., Cauzzi, G., et al. 2023, ApJ, 954, L35
2015
-
[4]
2016, A&A, 593, A93 De Pontieu, B., Title, A
Danilovic, S., van Noort, M., & Rempel, M. 2016, A&A, 593, A93 De Pontieu, B., Title, A. M., Lemen, J. R., et al. 2014, Sol. Phys., 289, 2733 Goši´c, M., Hansteen, V . H., Sainz Dalda, A., De Pontieu, B., & Rouppe van der V oort, L. H. M. 2025, ApJ, 990, 195
2016
-
[5]
V ., Carlsson, M., Hansteen, V
Gudiksen, B. V ., Carlsson, M., Hansteen, V . H., et al. 2011, A&A, 531, A154
2011
-
[6]
H., Martinez-Sykora, J., Carlsson, M., et al
Hansteen, V . H., Martinez-Sykora, J., Carlsson, M., et al. 2023, ApJ, 944, 131
2023
-
[7]
G., Kleint, L., Leenaarts, J., Sukhorukov, A
Judge, P. G., Kleint, L., Leenaarts, J., Sukhorukov, A. V ., & Vial, J.-C. 2020, ApJ, 901, 32
2020
-
[8]
& Carlsson, M
Leenaarts, J. & Carlsson, M. 2009, in Astronomical Society of the Pacific Conference Series, V ol. 415, The Second Hinode Science Meeting: Beyond Discovery-Toward Understanding, 87
2009
-
[9]
Leenaarts, J., Carlsson, M., Hansteen, V ., & Rutten, R. J. 2007, A&A, 473, 625
2007
-
[10]
Leenaarts, J., Pereira, T. M. D., Carlsson, M., Uitenbroek, H., & De Pontieu, B. 2013, ApJ, 772, 89
2013
-
[11]
& Carlsson, M
Lin, H.-H. & Carlsson, M. 2015, ApJ, 813, 34 Nóbrega-Siverio, D., Moreno-Insertis, F., Galsgaard, K., et al. 2023, ApJ, 958, L38
2015
-
[12]
A., Jones, E
Norton, A. A., Jones, E. H., Linton, M. G., & Leake, J. E. 2017, ApJ, 842, 3
2017
-
[13]
N., et al
Ondratschek, P., Przybylski, D., Smitha, H. N., et al. 2024, A&A, 692, A6
2024
-
[14]
Pereira, T. M. D. & Uitenbroek, H. 2015, A&A, 574, A3
2015
-
[15]
2014, ApJ, 789, 132
Rempel, M. 2014, ApJ, 789, 132
2014
-
[16]
H., Schou, J., Bush, R
Scherrer, P. H., Schou, J., Bush, R. I., et al. 2012, Sol. Phys., 275, 207
2012
-
[17]
2000, ApJ, 536, 465
Skartlien, R. 2000, ApJ, 536, 465
2000
-
[18]
2001, ApJ, 557, 389 Article number, page 19
Uitenbroek, H. 2001, ApJ, 557, 389 Article number, page 19
2001
discussion (0)
Sign in with ORCID, Apple, or X to comment. Anyone can read and Pith papers without signing in.