Recognition: 2 theorem links
A study of the kinematic and volumetric co-evolution of Earth-directed CMEs
Pith reviewed 2026-05-08 18:12 UTC · model grok-4.3
The pith
The second derivative of coronal mass ejection volume tracks both its acceleration and the associated flare's X-ray output
A machine-rendered reading of the paper's core claim, the machinery that carries it, and where it could break.
Core claim
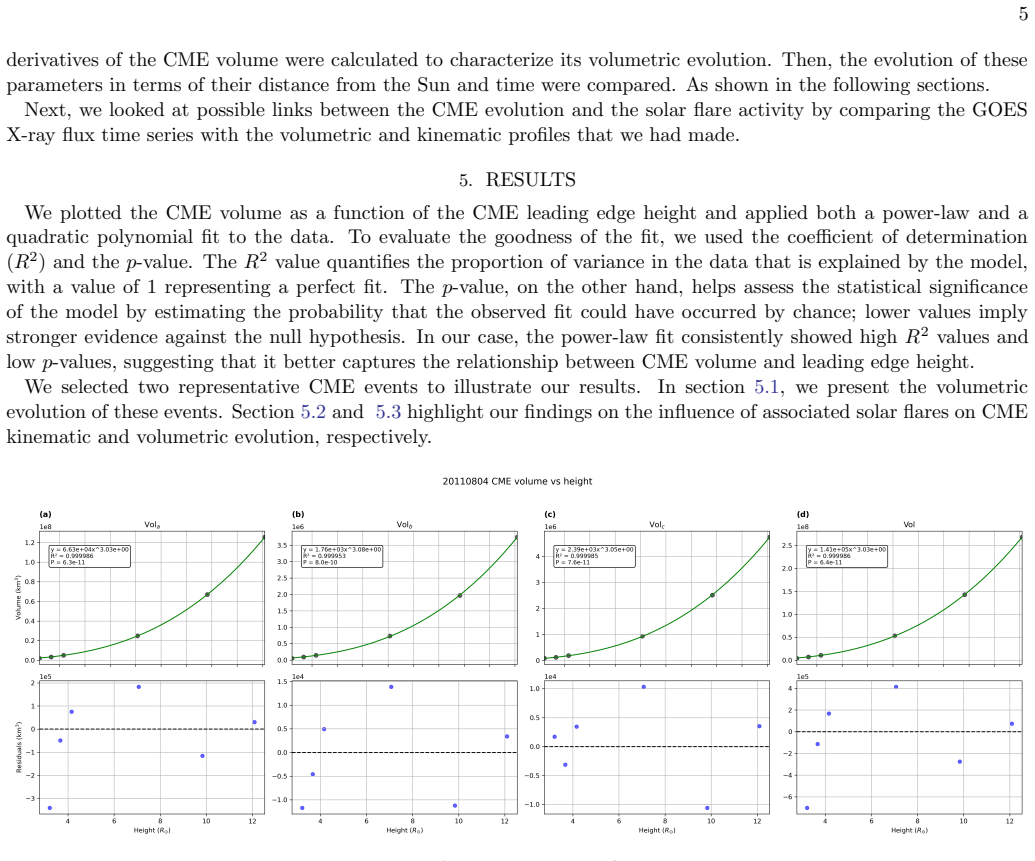
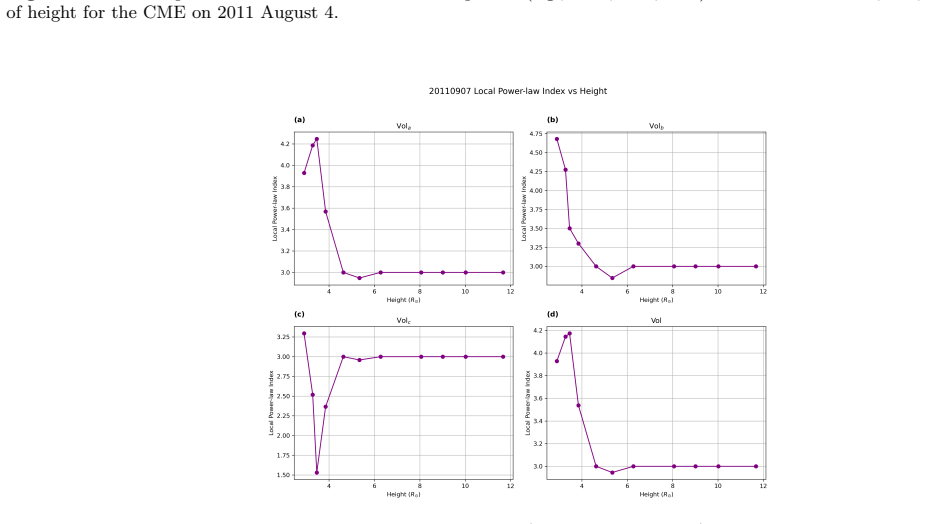
The study reconstructs ten flare-associated, Earth-directed CMEs in three dimensions with the Graduated Cylindrical Shell model and finds that their total volume follows a power-law relation with leading-edge height. The volume evolves through initial rapid overexpansion, a slowing phase, and eventual saturation, mirroring the three-phase kinematic evolution of CMEs. Critically, the second time derivative of the volume exhibits strong temporal correlation with the CME acceleration and the GOES soft X-ray flux of the flare, indicating that flare energy release influences CME expansion dynamics.
What carries the argument
The second-order time derivative of the CME volume, obtained from GCS model fits to multi-viewpoint coronagraph observations.
If this is right
- CME structural components such as the ellipsoidal front expand at different rates than the conical legs.
- The volumetric evolution follows an initial overexpansion followed by gradual reduction and saturation at higher heliocentric distances.
- Flare energy release plays a governing role in CME expansion dynamics.
Where Pith is reading between the lines
- The reported correlation suggests that flare observations alone might allow estimates of CME volumetric properties during the early expansion phase.
- This finding motivates targeted studies of how magnetic reconnection couples directly to flux-rope expansion rates.
- Extending the analysis to non-flare-associated CMEs could test whether the volume-acceleration link requires a flare or is a general feature of CMEs.
Load-bearing premise
The Graduated Cylindrical Shell model provides an accurate representation of the three-dimensional volume of CME flux ropes from the available multi-viewpoint observations without significant projection or selection biases.
What would settle it
Observations of a larger sample of CMEs where the second derivative of volume does not align temporally with acceleration peaks or X-ray flux maxima would falsify the reported correspondence.
Figures


read the original abstract
While flare-associated CMEs generally show a strong association between flare X-ray flux and CME kinematics, their volumetric evolution and its link to both kinematics and flare activity remains less explored. In this study, we investigate the volumetric and kinematic co-evolution of ten Earth-directed, flare-associated CMEs using multi-viewpoint observations from STEREO-A, STEREO-B, and SOHO. We perform 3D reconstructions of the CME flux ropes with the Graduated Cylindrical Shell (GCS) model and derive their geometrical parameters. We find that the total CME volume follows a power-law dependence on the leading edge height, and that different structural components expand at different rates, with the ellipsoidal front expanding faster than the conical legs. Furthermore, the volumetric evolution follows a multi-phase pattern: initial overexpansion, a gradual reduction in the expansion rate, and finally saturation at a higher heliocentric distance. This is similar to the well-established three-phase evolution of the CME kinematics. Notably, the second-order derivative of volume with time shows a strong temporal correlation with both CME acceleration and the GOES soft X-ray flux of the associated flare. This is the first study to report such a correspondence between volumetric evolution and flare timing, highlighting the role of flare energy release in governing CME expansion dynamics. Our findings motivate further studies into the coupling between magnetic reconnection and CME volumetric evolution in the corona.
Editorial analysis
A structured set of objections, weighed in public.
Referee Report
Summary. The manuscript analyzes ten Earth-directed, flare-associated CMEs observed from multiple viewpoints (STEREO-A/B and SOHO). Using Graduated Cylindrical Shell (GCS) 3D reconstructions, it derives geometrical parameters and reports that total CME volume follows a power-law dependence on leading-edge height, with the ellipsoidal front expanding faster than the conical legs. Volumetric evolution exhibits a three-phase pattern (initial overexpansion, reduced rate, saturation) analogous to established kinematic phases. The central result is a strong temporal correlation between the second time derivative of volume and both CME acceleration and the GOES soft X-ray flux of the associated flare, interpreted as evidence that flare energy release governs CME expansion dynamics.
Significance. If the reported volumetric-flare correlation is robust, the work would be significant for solar physics by providing the first direct observational link between CME volumetric evolution and flare timing. This extends prior kinematic-flare associations and motivates studies of magnetic reconnection's role in CME expansion, with potential implications for space-weather forecasting models that currently emphasize kinematics over volume changes.
major comments (3)
- [§3.2] §3.2 (GCS reconstruction procedure): The headline correlation between d²V/dt² and GOES SXR flux is obtained solely from volumes derived by fitting the GCS model (fixed cylindrical + conical geometry with linear height dependence) to the ten events. No propagation of GCS parameter uncertainties into the volume time series or its second derivative is shown, nor is there a comparison against alternative reconstruction techniques (e.g., FRiED or flux-rope fitting variants). This leaves open whether the reported temporal alignment is physical or an artifact of the imposed functional form.
- [§4.3] §4.3 and Table 2 (event sample): With only ten pre-selected Earth-directed, flare-associated events, the study lacks any quantitative assessment of selection effects or statistical significance of the correlations (e.g., Pearson r values, p-values, or bootstrap tests). The abstract and results sections provide no details on the initial event pool size or rejection criteria, undermining claims of a general physical correspondence.
- [§5.1] §5.1 (power-law and multi-phase claims): The reported power-law dependence of volume on leading-edge height and the three-phase volumetric evolution are presented without fitted exponents, uncertainties, or direct comparison to the kinematic three-phase model in the same events. This weakens the asserted analogy between volumetric and kinematic evolution.
minor comments (3)
- The abstract states 'strong temporal correlation' but the main text should explicitly report the quantitative correlation coefficients and any lag analysis between d²V/dt², acceleration, and GOES flux.
- Notation for the separate volume components (ellipsoidal front vs. conical legs) is introduced without a clear equation or diagram defining how total volume is computed from GCS parameters.
- Add references to prior GCS validation studies and three-phase kinematic literature in the introduction to better contextualize the volumetric findings.
Simulated Author's Rebuttal
We thank the referee for the thoughtful and constructive report. The comments highlight important areas for strengthening the analysis, particularly regarding methodological robustness, statistical rigor, and quantitative details. We address each major comment below and have revised the manuscript accordingly where feasible.
read point-by-point responses
-
Referee: [§3.2] The headline correlation between d²V/dt² and GOES SXR flux is obtained solely from volumes derived by fitting the GCS model (fixed cylindrical + conical geometry with linear height dependence) to the ten events. No propagation of GCS parameter uncertainties into the volume time series or its second derivative is shown, nor is there a comparison against alternative reconstruction techniques (e.g., FRiED or flux-rope fitting variants). This leaves open whether the reported temporal alignment is physical or an artifact of the imposed functional form.
Authors: We agree that explicit uncertainty propagation strengthens the result. In the revised manuscript we now propagate the reported GCS parameter uncertainties (height, half-angle, tilt, etc.) through the ellipsoidal volume formula to produce error bars on V(t) and d²V/dt²; the correlation with GOES SXR flux remains significant within these uncertainties. A systematic comparison with alternative reconstruction methods such as FRiED or other flux-rope fitting codes is beyond the scope of the present study, as it would require re-processing all events with different assumptions and is left for future work. We have added a brief discussion of this limitation in §3.2 while noting that GCS has been validated against other techniques for Earth-directed events in the literature. revision: partial
-
Referee: [§4.3] With only ten pre-selected Earth-directed, flare-associated events, the study lacks any quantitative assessment of selection effects or statistical significance of the correlations (e.g., Pearson r values, p-values, or bootstrap tests). The abstract and results sections provide no details on the initial event pool size or rejection criteria, undermining claims of a general physical correspondence.
Authors: We have expanded §4.3 and the methods section to document the initial event pool (25 Earth-directed CMEs identified from the CDAW and STEREO catalogs during 2010–2013 with clear multi-viewpoint coverage) and the rejection criteria (insufficient simultaneous STEREO-A/B/SOHO observations or missing GOES flare data). We now report Pearson correlation coefficients and associated p-values for the d²V/dt²–SXR and d²V/dt²–acceleration relations, together with bootstrap resampling results to assess robustness. While the final sample of ten events is necessarily limited by the requirement for high-quality multi-spacecraft data, the added statistical measures and selection transparency address the concern about over-generalization. revision: yes
-
Referee: [§5.1] The reported power-law dependence of volume on leading-edge height and the three-phase volumetric evolution are presented without fitted exponents, uncertainties, or direct comparison to the kinematic three-phase model in the same events. This weakens the asserted analogy between volumetric and kinematic evolution.
Authors: We have revised §5.1 to include the best-fit power-law exponents (V ∝ h^α) and their 1σ uncertainties obtained from weighted least-squares fits to each event. We also overlay the temporal boundaries of the three volumetric phases directly onto the kinematic profiles for the same ten events, demonstrating that the transitions occur at comparable heights. These quantitative additions make the claimed analogy between volumetric and kinematic evolution more precise and testable. revision: yes
Circularity Check
No significant circularity; empirical measurements from GCS reconstructions
full rationale
The paper derives volumetric time series and their second derivatives directly from 3D GCS fits to multi-viewpoint coronagraph data for ten events. The reported power-law dependence of volume on height, multi-phase expansion pattern, and temporal correlations with acceleration and GOES SXR flux are observational outcomes computed from the fitted geometrical parameters (leading-edge height, angular widths, etc.). No equations in the provided text reduce any claimed result to a fitted input by construction, nor do they invoke self-citations as load-bearing uniqueness theorems or ansatzes. The GCS model itself is a standard external tool; the correlations are not statistically forced by the fitting procedure but emerge from the data. The derivation chain remains self-contained and falsifiable against the underlying image measurements.
Axiom & Free-Parameter Ledger
free parameters (1)
- power-law exponent for volume versus leading-edge height
axioms (1)
- domain assumption The Graduated Cylindrical Shell (GCS) model accurately reconstructs the 3D geometry and volume of CME flux ropes from multi-viewpoint coronagraph images.
Reference graph
Works this paper leans on
-
[1]
2021, Space Weather, 19, e2021SW002873, doi: https://doi.org/10.1029/2021SW002873
Bauer, M., Amerstorfer, T., Hinterreiter, J., et al. 2021, Space Weather, 19, e2021SW002873, doi: https://doi.org/10.1029/2021SW002873
-
[2]
K., Gopalswamy, N., Tessema, S
Dagnew, F. K., Gopalswamy, N., Tessema, S. B., Akiyama, S., & Yashiro, S. 2022, ApJ, 936, 122, doi: 10.3847/1538-4357/ac8744 Gopalswamy., Yashiro., M¨ akel¨ a., Xie., & Akiyama. 2021, The Astrophysical Journal, 915, doi: 10.3847/1538-4357/ac004f
-
[3]
Gopalswamy, N., Akiyama, S., Yashiro, S., & Xie, H. 2018a, Journal of Atmospheric and Solar-Terrestrial Physics, 180, 35, doi: https://doi.org/10.1016/j.jastp.2017.06.004
-
[4]
Howard, R. A. 2001, Journal of Geophysical Research: Space Physics, 106, 29207, doi: https://doi.org/10.1029/2001JA000177
-
[5]
2013, Space Weather, 11, 661, doi: https://doi.org/10.1002/2013SW000945
Gopalswamy, N., M¨ akel¨ a, P., Xie, H., & Yashiro, S. 2013, Space Weather, 11, 661, doi: https://doi.org/10.1002/2013SW000945
-
[6]
2012, Space Science Reviews, 171, 23, doi: 10.1007/s11214-012-9890-4
Gopalswamy, N., Xie, H., Yashiro, S., et al. 2012, Space Science Reviews, 171, 23, doi: 10.1007/s11214-012-9890-4
-
[7]
2010, Sun and Geosphere, 5, 7
Gopalswamy, N., Yashiro, S., Michalek, G., et al. 2010, Sun and Geosphere, 5, 7
2010
-
[8]
2018b, The Astrophysical Journal Letters, 863, L39, doi: 10.3847/2041-8213/aad86c
Gopalswamy, N., Yashiro, S., M¨ akel¨ a, P., et al. 2018b, The Astrophysical Journal Letters, 863, L39, doi: 10.3847/2041-8213/aad86c
-
[9]
Harrison, R. A. 1995, A&A, 304, 585
1995
-
[10]
2019, CME volume calculation from 3D GCS reconstruction, doi: 10.48550/arXiv.1904.11418
Holzknecht, L., Temmer, M., Dumbovic, M., et al. 2019, CME volume calculation from 3D GCS reconstruction, doi: 10.48550/arXiv.1904.11418
-
[11]
Kay, C., & Chinchilla, T. 2021, Journal of Geophysical Research: Space Physics, 126, e2020JA028911, doi: https://doi.org/10.1029/2020JA028911
-
[12]
2022, Frontiers in Astronomy and Space Sciences, Volume 9 - 2022, doi: 10.3389/fspas.2022.974137
Kouloumvakos, A., Rodr´ ıguez-Garc´ ıa, L., Gieseler, J., et al. 2022, Frontiers in Astronomy and Space Sciences, Volume 9 - 2022, doi: 10.3389/fspas.2022.974137
-
[13]
Krall, J., & St. Cyr, O. C. 2006, The Astrophysical Journal, 652, 1740, doi: 10.1086/508337 14
-
[14]
2022, The Astrophysical Journal, 929, 11, doi: 10.3847/1538-4357/ac5909
Majumdar, S., Patel, R., & Pant, V. 2022, The Astrophysical Journal, 929, 11, doi: 10.3847/1538-4357/ac5909
-
[15]
Manchester, W., Kilpua, E. K. J., Liu, Y. D., et al. 2017, Space Science Reviews, 212, 1159, doi: 10.1007/s11214-017-0394-0
-
[16]
L., Taktakishvili, A., Pulkkinen, A., et al
Mays, M. L., Taktakishvili, A., Pulkkinen, A., et al. 2015, Solar Physics, 290, 1775, doi: 10.1007/s11207-015-0692-1
-
[17]
2025, The Astrophysical Journal, 982, 35, doi: 10.3847/1538-4357/adb84b Pomoell, & Poedts
Pattnaik, A., Micha lek, G., & Ravishankar, A. 2025, The Astrophysical Journal, 982, 35, doi: 10.3847/1538-4357/adb84b Pomoell, & Poedts. 2018, J. Space Weather Space Clim., 8, A35, doi: 10.1051/swsc/2018020
-
[18]
2019, Solar Physics, 294, 125, doi: 10.1007/s11207-019-1470-2
Ravishankar, A., & Micha lek, G. 2019, Solar Physics, 294, 125, doi: 10.1007/s11207-019-1470-2
-
[19]
2017, Solar Physics, 292, 118, doi: 10.1007/s11207-017-1137-9
Sachdeva, N., Subramanian, P., Vourlidas, A., & Bothmer, V. 2017, Solar Physics, 292, 118, doi: 10.1007/s11207-017-1137-9
-
[20]
Temmer, M., Veronig, A. M., Vrˇ snak, B., et al. 2008, The Astrophysical Journal, 673, L95, doi: 10.1086/527414
-
[21]
Temmer, M., Holzknecht, L., Dumbovi´ c, M., et al. 2021, Journal of Geophysical Research: Space Physics, 126, e2020JA028380, doi: https://doi.org/10.1029/2020JA028380
-
[22]
2011, The Astrophysical Journal Supplement Series, 194, 33, doi: 10.1088/0067-0049/194/2/33
Thernisien, A. 2011, The Astrophysical Journal Supplement Series, 194, 33, doi: 10.1088/0067-0049/194/2/33
-
[23]
Thernisien, A., Vourlidas, A., & Howard, R. A. 2009, Solar Physics, 256, 111, doi: 10.1007/s11207-009-9346-5
-
[24]
Vourlidas, A., Lynch, B. J., Howard, R. A., & Li, Y. 2013, Solar Physics, 284, 179, doi: 10.1007/s11207-012-0084-8 Vrˇ snak, B.,ˇZic, T., Vrbanec, D., et al. 2013, Solar Physics, 285, 295, doi: 10.1007/s11207-012-0035-4
-
[25]
Howard, R. A. 2005, Journal of Geophysical Research: Space Physics, 110, doi: https://doi.org/10.1029/2005JA011151
-
[26]
White, S. M. 2001, The Astrophysical Journal, 559, 452, doi: 10.1086/322405 15 APPENDIX T able 1.Flare-associated CMEs’ source region information Flare Onset Flare Location Flare Class CME Onset 2011-02-15 01:44 S20W10 X2.2 02:25 2011-03-07 13:44 N11E21 M2.0 14:40 2011-08-03 13:17 N17W29 M6.0 13:55 2011-08-04 03:41 N15W39 M9.3 04:10 2011-09-07 22:32 N15W3...
discussion (0)
Sign in with ORCID, Apple, or X to comment. Anyone can read and Pith papers without signing in.