Recognition: unknown
Evaluating the probative value of forensic gait analysis evidence using empirical data
Pith reviewed 2026-05-08 02:07 UTC · model grok-4.3
The pith
A likelihood ratio model for gait features produces misleading results in under 10 percent of comparisons when within-person variability is correctly specified.
A machine-rendered reading of the paper's core claim, the machinery that carries it, and where it could break.
Core claim
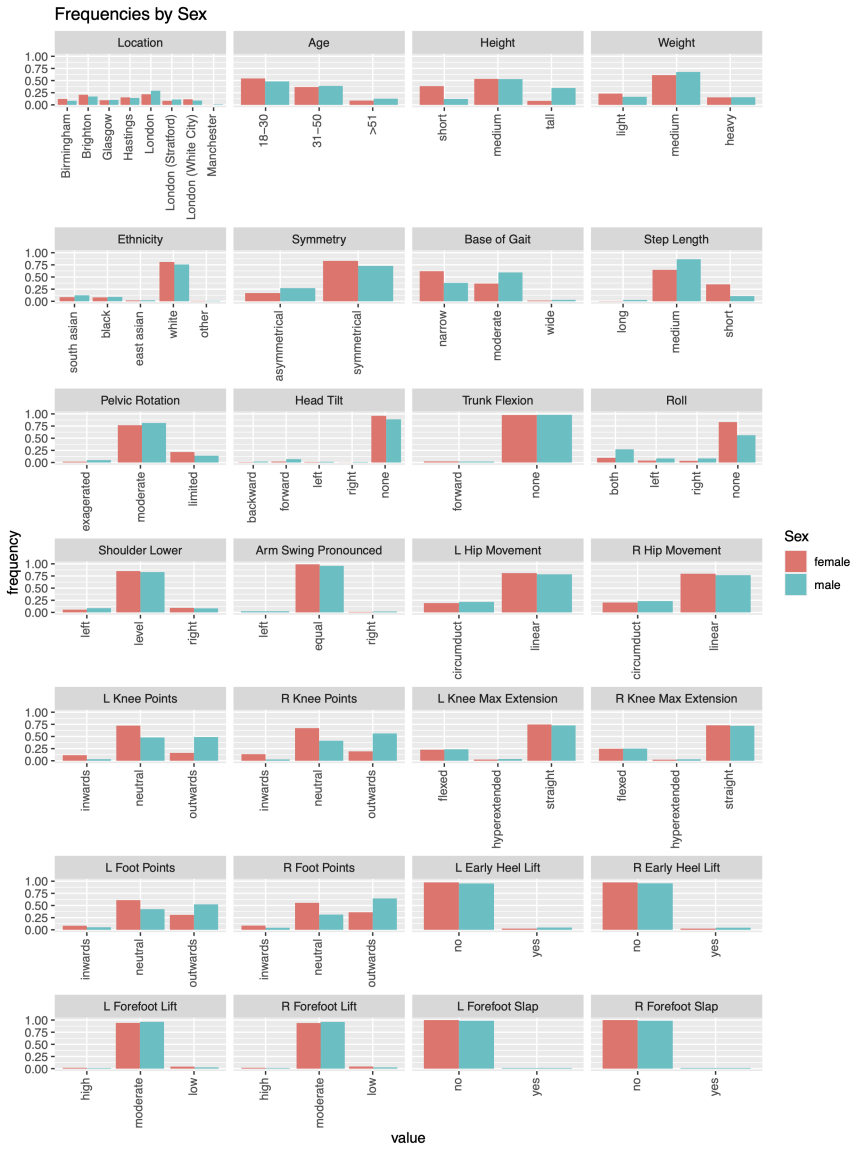
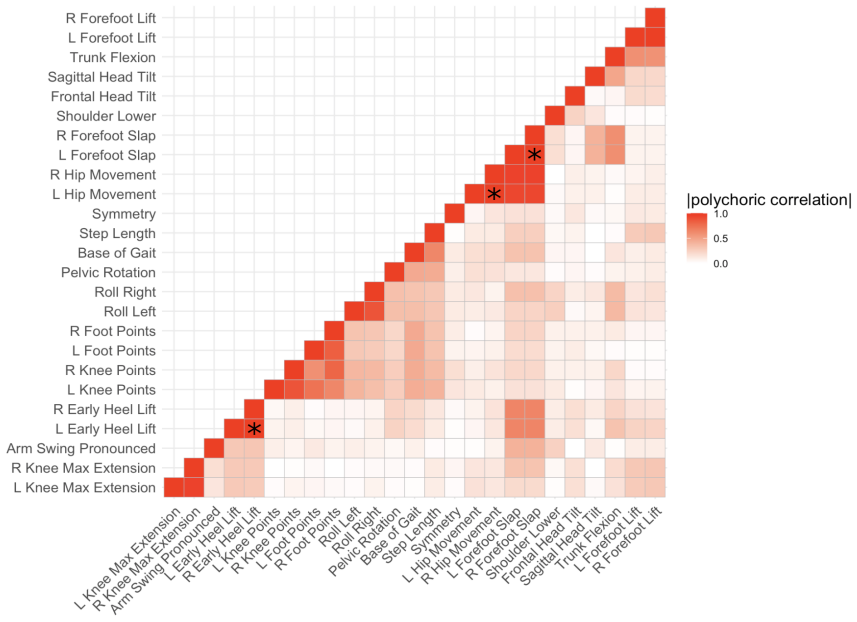
By recoding observed gait features as dichotomous variables and applying principal component analysis for dimension reduction, the authors build a likelihood ratio model that produces misleading likelihood ratios in less than 10 percent of comparisons when the first four principal components are used, on the condition that within-individual variability is correctly specified; correlations among features are high enough that they cannot be treated as independent contributors to the weight of evidence, and human expertise remains essential for judging whether differences in conditions account for any mismatch between reference and questioned footage.
What carries the argument
The likelihood ratio model obtained by converting gait features to binary variables and reducing dimensionality with principal component analysis.
Load-bearing premise
Within-individual variability in gait features is correctly specified inside the likelihood ratio model.
What would settle it
A fresh collection of gait comparisons in which within-individual variability matches the model's specification yet the rate of misleading likelihood ratios exceeds 10 percent would falsify the reported performance.
Figures


read the original abstract
Forensic gait analysis can aid the investigation of crimes through comparing features of gait captured in video footage. Modelling the probative value of gait evidence requires an understanding of the variation of features of gait between individuals in the population and within the same individuals. We address this question using a previously described population dataset and newly collected datasets with repeated observations of the same individuals on separate occasions. In addition to exploring the level of variability, correlation between features of gait, and the effect of demographic factors, we developed a likelihood ratio model through recoding features of gait as dichotomous variables and dimension reduction using PCA. High correlations between some features were observed, confirming that they should not contribute independently to the weight of evidence. The likelihood ratio model produced misleading likelihood ratios in less than 10% of the comparisons using the first four principal components. However, the risk increases when within-individual variability is mis-specified. Therefore, while the current model provides assistance to the judgement of gait experts, human expertise is indispensable to decide whether or not the difference in walking and/or recording conditions between the reference and questioned footage could have caused any observed differences in the features of gait. We discuss future directions in understanding the sources of the variability, improving statistical modelling and note the need to consider carefully how to select the relevant population for model fitting.
Editorial analysis
A structured set of objections, weighed in public.
Referee Report
Summary. The manuscript evaluates the probative value of forensic gait analysis evidence by combining a previously described population dataset with newly collected repeated-observation data from the same individuals. It quantifies between- and within-individual variability in gait features, examines correlations and demographic effects, and constructs a likelihood ratio model by recoding features as dichotomous variables followed by PCA dimension reduction. The central empirical result is that this LR model produces misleading likelihood ratios in less than 10% of comparisons when the first four principal components are retained. The authors note that performance degrades if within-individual variability is mis-specified and conclude that the model can assist but not replace human expert judgment on condition differences between reference and questioned footage.
Significance. If the reported performance holds, the work supplies one of the few empirical, data-driven quantifications of misleading rates for gait evidence, directly addressing a recognized gap in forensic statistics. Strengths include the use of repeated-observation datasets to estimate within-individual variance components and the explicit counting of misleading LRs rather than relying solely on theoretical derivations. These elements provide a concrete, falsifiable benchmark that could inform future validation studies. The explicit caveat about within-individual variability specification and the call for human oversight are appropriately cautious.
major comments (1)
- [Abstract and LR model section] Abstract and the section describing the likelihood ratio model: The claim that misleading LRs occur in less than 10% of comparisons (first four principal components) is obtained by fitting the model to the new repeated-observation datasets and then evaluating on held-out comparisons. The abstract states that the misleading rate rises when within-individual variability is mis-specified, yet no sensitivity analysis, bootstrap perturbation of the variance components, or alternative distributional assumptions are reported. Because the within-individual variance is estimated solely from these datasets and directly enters the LR numerator and denominator, any under-sampling of repeats or unmodeled condition effects would propagate into the very metric used to support the <10% figure. This is load-bearing for the central claim.
minor comments (2)
- [Methods] The methods description would benefit from explicit statements of data exclusion rules, the precise PCA implementation (including any scaling or centering steps), and the exact train/test split protocol used to compute the misleading-rate percentage.
- [Results] Table or figure reporting the misleading-rate results should include the total number of comparisons performed and the breakdown by same-source versus different-source pairs to allow readers to assess the base rate.
Simulated Author's Rebuttal
We thank the referee for their constructive and detailed review, which highlights both the strengths of our empirical approach and an important area for strengthening the robustness claims. We address the major comment point by point below.
read point-by-point responses
-
Referee: [Abstract and LR model section] Abstract and the section describing the likelihood ratio model: The claim that misleading LRs occur in less than 10% of comparisons (first four principal components) is obtained by fitting the model to the new repeated-observation datasets and then evaluating on held-out comparisons. The abstract states that the misleading rate rises when within-individual variability is mis-specified, yet no sensitivity analysis, bootstrap perturbation of the variance components, or alternative distributional assumptions are reported. Because the within-individual variance is estimated solely from these datasets and directly enters the LR numerator and denominator, any under-sampling of repeats or unmodeled condition effects would propagate into the very metric used to support the <10% figure. This is load-bearing for the central claim.
Authors: We agree that the robustness of the reported misleading LR rate to the specification of within-individual variability is central to the manuscript's main claim and that a formal sensitivity analysis was not included in the original submission. The current <10% figure derives from direct empirical evaluation on held-out comparisons drawn from the repeated-observation datasets, which already embed the observed within-individual variability. Nevertheless, to address the referee's concern directly, we will add an explicit sensitivity analysis in the revised manuscript. This will include scaling the estimated within-individual variance components by factors of 0.5, 0.75, 1.25 and 1.5, recomputing the misleading LR proportions for the first four principal components, and reporting the results in a new table or figure. We will also add a short discussion of possible unmodeled condition effects and data limitations. These changes will be reflected in the abstract, the likelihood ratio model section, and the discussion. revision: yes
Circularity Check
No significant circularity; empirical LR performance evaluated on separate repeated-observation data
full rationale
The paper fits a likelihood ratio model by recoding gait features as binary variables, applying PCA dimension reduction, and estimating between-individual variation from a prior population dataset plus within-individual variation from newly collected repeated observations. The central performance claim (<10% misleading LRs with first four PCs) is an empirical count obtained by applying the fitted model to comparisons drawn from those datasets. No equation reduces this count to a fitted parameter by construction, and the paper explicitly flags sensitivity to within-individual variability mis-specification rather than claiming the result is forced. No self-citation load-bearing steps, uniqueness theorems, or ansatz smuggling are present in the derivation chain. This is a standard empirical modeling workflow with acknowledged modeling assumptions.
Axiom & Free-Parameter Ledger
free parameters (2)
- Number of principal components retained
- Dichotomization thresholds for gait features
axioms (2)
- domain assumption The collected gait datasets adequately represent the relevant population for forensic comparisons.
- domain assumption Principal components capture the relevant variation after accounting for correlations between gait features.
Reference graph
Works this paper leans on
-
[1]
A review of the historical use and criti- cisms of gait analysis evidence
Michael Nirenberg, Wesley Vernon, and Ivan Birch. “A review of the historical use and criti- cisms of gait analysis evidence”. In:Science & Justice58.4 (2018), pp. 292–298.doi:10.1016/ j.scijus.2018.03.002
2018
-
[2]
Forensic Science Regulator.Forensic Science Regulator Codes of Practice and Conduct: De- velopment of Evaluative Opinions.https://assets.publishing.service.gov.uk/media/ 602407728fa8f5146f0769d9/FSR-C-118_Interpretation_Appendix_Issue_1__002_.pdf. 2021
2021
-
[3]
https : / / rss
The Inns of Court College of Advocacy and the Royal Statistical Society.Statistics and prob- ability for advocates: Understanding the use of statistical evidence in courts and tribunals. https : / / rss . org . uk / RSS / media / File - library / Publications / ICCA - RSS - guide - version-6-branded-171019-REV03-designed-covers.pdf. 2019
2019
-
[4]
The Royal Society and the Royal Society of Edinburgh.The use of statistics in legal proceedings a primer for courts.https://royalsociety.org/-/media/about-us/programmes/science- and-law/science-and-law-statistics-primer.pdf. 2020
2020
-
[5]
European Network of Forensic Science Institutes.ENFSI Guideline for Evaluative Reporting in Forensic Science. 2016
2016
-
[6]
Rami Abboud et al.Forensic Gait Analysis: a primer for courts. Ed. by Andrew Cubie, Tim Theologis, and Daniel Wolpert. Primers for courts. 2017
2017
-
[7]
Critical review of the use and scientific basis of forensic gait analysis
Nina M. van Mastrigt et al. “Critical review of the use and scientific basis of forensic gait analysis”. In:Forensic Sciences Research3.3 (2018), pp. 183–193.doi:10.1080/20961790. 2018.1503579
-
[8]
Forensic Gait Analysis and Recog- nition: Standards of Evidence Admissibility
Ioana Macoveciuc, Carolyn J. Rando, and Herv´ e Borrion. “Forensic Gait Analysis and Recog- nition: Standards of Evidence Admissibility”. In:Journal of Forensic Sciences64.5 (2019). eprint: https://onlinelibrary.wiley.com/doi/pdf/10.1111/1556-4029.14036, pp. 1294–1303.doi: 10.1111/1556-4029.14036
-
[9]
The repeatability and reproducibility of the Sheffield Features of Gait Tool
Ivan Birch et al. “The repeatability and reproducibility of the Sheffield Features of Gait Tool”. In:Science & Justice59.5 (2019), pp. 544–551.doi:10.1016/j.scijus.2019.04.001. 21
-
[11]
Ivan Birch et al. “The development of a tool for assessing the quality of closed circuit camera footage for use in forensic gait analysis”. In:Journal of Forensic and Legal Medicine20.7 (2013), pp. 915–917.doi:10.1016/j.jflm.2013.07.005
-
[12]
Bert Otten and Mickey Wiedemeijer.Forensic Gait Analysis Method Paper. Tech. rep. Contact: egbert.otten@umcg.nl. University Medical Center Groningen, University of Groningen, 2021
2021
-
[13]
Dilan Seckiner et al. “Forensic interpretation framework for body and gait analysis: feature extraction, frequency and distinctiveness”. In:Australian Journal of Forensic Sciences56.4 (2024), pp. 338–354.doi:10.1080/00450618.2022.2161636
-
[14]
Aiding the interpretation of forensic gait analysis: Development of a features of gait database
Ivan Birch, Claire Gwinnett, and Jeremy Walker. “Aiding the interpretation of forensic gait analysis: Development of a features of gait database”. In:Science & Justice56.6 (2016), pp. 426–430.doi:10.1016/j.scijus.2016.06.009
-
[15]
Effects of high heeled shoes on gait. A review
M. M. Wiedemeijer and E. Otten. “Effects of high heeled shoes on gait. A review”. In:Gait & Posture61 (2018), pp. 423–430.doi:10.1016/j.gaitpost.2018.01.036
-
[16]
The effect of viewing angle on observations of foot orientation in forensic gait analysis
Selina Reidy et al. “The effect of viewing angle on observations of foot orientation in forensic gait analysis”. In:Science & Justice60.6 (2020), pp. 504–511.doi:10.1016/j.scijus.2020. 06.005
-
[17]
The Development and Testing of a Forensic Interpretation Framework for use on Anthropometric and Morphological Data Collected During Stance and Gait
Dilan Seckiner. “The Development and Testing of a Forensic Interpretation Framework for use on Anthropometric and Morphological Data Collected During Stance and Gait”. PhD thesis. University of Technology Sydney, 2021
2021
-
[18]
Foot placement variables of pedestrians in community setting during curve walking
B. Bergsma et al. “Foot placement variables of pedestrians in community setting during curve walking”. In:Gait & Posture86 (2021), pp. 120–124.doi:10.1016/j.gaitpost.2021.03.017
-
[19]
The logical foundations of forensic science: towards reliable knowledge
Ian Evett. “The logical foundations of forensic science: towards reliable knowledge”. In:Philo- sophical Transactions of the Royal Society B: Biological Sciences370.1674 (2015), p. 20140263. doi:10.1098/rstb.2014.0263
-
[20]
Advancing a paradigm shift in evaluation of forensic evidence: The rise of forensic data science
Geoffrey Stewart Morrison. “Advancing a paradigm shift in evaluation of forensic evidence: The rise of forensic data science”. In:Forensic Science International: Synergy5 (2022), p. 100270. doi:https://doi.org/10.1016/j.fsisyn.2022.100270
-
[21]
Probative value of gait analysis
Graham Jackson and Ivan Birch. “Probative value of gait analysis”. In:Forensic Gait Analysis. Num Pages: 18. CRC Press, 2020
2020
-
[22]
Establishing the most appropriate databases for addressing source level propositions
C. Champod, I.W. Evett, and G. Jackson. “Establishing the most appropriate databases for addressing source level propositions”. In:Science & Justice44.3 (2004), pp. 153–164.doi: 10.1016/S1355-0306(04)71708-6
-
[23]
Biometric recognition by gait: A survey of modalities and features
Patrick Connor and Arun Ross. “Biometric recognition by gait: A survey of modalities and features”. In:Computer Vision and Image Understanding167 (2018), pp. 1–27.doi:10.1016/ j.cviu.2018.01.007
2018
-
[24]
Mathematical Contributions to the Theory of Evolution. VII. On the Correla- tion of Characters not Quantitatively Measurable
Karl Pearson. “Mathematical Contributions to the Theory of Evolution. VII. On the Correla- tion of Characters not Quantitatively Measurable”. In:Philosophical Transactions of the Royal Society of London. Series A, Containing Papers of a Mathematical or Physical Character195 (1900), pp. 1–405. 22
1900
-
[25]
Evaluation of Trace Evidence in the Form of Multivariate Data
C. G. G. Aitken and D. Lucy. “Evaluation of Trace Evidence in the Form of Multivariate Data”. In:Journal of the Royal Statistical Society. Series C (Applied Statistics)53.1 (2004). Publisher: [Wiley, Royal Statistical Society], pp. 109–122
2004
-
[26]
I. T. Jolliffe.Principal Component Analysis. Springer Series in Statistics. New York, NY: Springer New York, 1986.doi:10.1007/978-1-4757-1904-8
-
[27]
Stanislav Kolenikov and Gustavo Angeles.The use of discrete data in PCA: theory, simula- tions, and applications to socioeconomic indices. 2004
2004
-
[28]
R package version 2.2.5
William Revelle.psych: Procedures for Psychological, Psychometric, and Personality Research. R package version 2.2.5. Northwestern University. Evanston, Illinois, 2022
2022
-
[29]
R Foundation for Statistical Computing
R Core Team.R: A Language and Environment for Statistical Computing. R Foundation for Statistical Computing. Vienna, Austria, 2022
2022
-
[30]
Choosing the window width when estimating a density
B. W. Silverman. “Choosing the window width when estimating a density”. In:Biometrika 65.1 (1978), pp. 1–11.doi:10.1093/biomet/65.1.1
-
[31]
Information-Theoretical Assessment of the Performance of Likelihood Ratio Computation Methods
Daniel Ramos et al. “Information-Theoretical Assessment of the Performance of Likelihood Ratio Computation Methods”. In:Journal of Forensic Sciences58.6 (2013), pp. 1503–1518. doi:10.1111/1556-4029.12233
-
[32]
Facial Identification Scientific Working Group.Facial Comparison Overview and Methodology Guidelines v1.0. 2019
2019
-
[33]
Footwear Examination and Analysis
Denis Wesley Vernon and John A. DiMaggio. “Footwear Examination and Analysis”. In:Foren- sic Podiatry. 2nd ed. Num Pages: 34. CRC Press, 2017
2017
-
[34]
Kurt Varmuza and Peter Filzmoser.Introduction to Multivariate Statistical Analysis in Chemo- metrics. 1st ed. CRC Press, 2016.doi:10.1201/9781420059496
-
[35]
Federico Marini et al. “Analysis of variance of designed chromatographic data sets: The analysis of variance-target projection approach”. In:Journal of Chromatography A1405 (2015), pp. 94– 102.doi:10.1016/j.chroma.2015.05.060
-
[36]
Alyssa Allen, Mary R. Williams, and Michael E. Sigman. “Application of likelihood ratios and optimal decision thresholds in fire debris analysis based on a partial least squares discriminant analysis (PLS-DA) model”. In:Forensic Chemistry16 (2019), p. 100188.doi:10.1016/j. forc.2019.100188
work page doi:10.1016/j 2019
-
[37]
Forensic comparison of pyrograms using score-based likelihood ratios
Agnieszka Martyna, Grzegorz Zadora, and Daniel Ramos. “Forensic comparison of pyrograms using score-based likelihood ratios”. In:Journal of Analytical and Applied Pyrolysis133 (2018), pp. 198–215.doi:10.1016/j.jaap.2018.03.024
-
[38]
Probabilistic Evaluation of Handwriting Evidence: Likelihood Ratio for Authorship
Silvia Bozza et al. “Probabilistic Evaluation of Handwriting Evidence: Likelihood Ratio for Authorship”. In:Journal of the Royal Statistical Society Series C: Applied Statistics57.3 (2008), pp. 329–341.doi:10.1111/j.1467-9876.2007.00616.x. 23
discussion (0)
Sign in with ORCID, Apple, or X to comment. Anyone can read and Pith papers without signing in.