Recognition: 3 theorem links
· Lean TheoremBeyond Activation Alignment: The Geometry of Neural Sensitivity
Pith reviewed 2026-05-08 18:25 UTC · model grok-4.3
The pith
Neural representations aligned on global tasks can still differ in how they discriminate small local stimulus changes under noise.
A machine-rendered reading of the paper's core claim, the machinery that carries it, and where it could break.
Core claim
By summarizing each representation with the expected projected pullback of the Fisher metric over a stimulus subspace, the framework yields a regularized signature operator that minimally and completely captures expected discriminability for the induced family of local discrimination tasks; these signatures are compared on the SPD manifold using log-spectral distance to obtain the S-RAS score and its associated uniform certificate.
What carries the argument
The expected projected Fisher metric over the stimulus-coordinate subspace, which acts as the regularized signature operator for the family of local tasks and is compared via log-spectral distance on symmetric positive definite matrices to produce the Spectral Riemannian Alignment Score.
If this is right
- The method recovers corresponding layers between independently trained artificial networks.
- It supports class-conditional probes that transfer across networks.
- It produces controlled dissociations between standard and robustly trained networks.
- It detects stimulus-coordinate family effects in mouse visual cortex recordings from the Allen Brain Observatory.
Where Pith is reading between the lines
- Because the score supplies a uniform multiplicative bound over the lifted local-task family, it could be used to certify robustness margins when small input changes are known to matter.
- The same geometric construction might be applied to sequence models by defining stimulus subspaces over token embeddings or attention patterns.
- If the subspace choice is varied systematically, the resulting family of S-RAS matrices could serve as a fingerprint for how a network allocates sensitivity across different stimulus dimensions.
Load-bearing premise
The chosen stimulus-coordinate subspace together with the additive noise model for local perturbations correctly reflects the discrimination tasks of interest, and the resulting projected Fisher metric isolates sensitivity differences that global alignment measures do not already capture.
What would settle it
Two representations with high global alignment scores but substantially different S-RAS values would be shown to have identical performance on a battery of concrete local perturbation-discrimination tasks under the same noise model.
Figures


read the original abstract
Activation-alignment measures such as Representational Similarity Analysis (RSA), Canonical Correlation Analysis (CCA), and Centered Kernel Alignment (CKA) are widely used to compare biological and artificial neural representations. Recent theoretical work interprets many of these methods as assessing agreement between optimal linear readouts over broad families of global tasks. However, agreement at the level of global readouts does not determine how a system uses local stimulus evidence. Specifically, representations may align in activation space yet differ in their sensitivity to small perturbations. To address this challenge, we introduce a complementary framework based on local decodable information, which focuses on a representation's ability, under noise, to discriminate small perturbations within a specified stimulus-coordinate subspace. Building on Fisher information and local representation geometry, we summarize each representation using the expected projected pullback/Fisher metric over that subspace. This formulation induces a second-moment family of local discrimination tasks, for which the resulting operator provides a minimal, complete dataset-level summary of expected discriminability. We compare these regularized signatures using a log-spectral distance on the manifold of symmetric positive definite (SPD) matrices, yielding the Spectral Riemannian Alignment Score (S-RAS) and a uniform multiplicative certificate over the corresponding family of lifted task values. Empirically, this framework enables the recovery of corresponding layers across independently trained artificial neural networks, supports transferable class-conditional probes, reveals controlled dissociations between standard and robust training, and uncovers stimulus-coordinate family effects across mouse visual cortex using the Allen Brain Observatory static gratings dataset.
Editorial analysis
A structured set of objections, weighed in public.
Referee Report
Summary. The paper proposes a complementary framework to global activation-alignment measures (RSA, CCA, CKA) that focuses on local sensitivity to small perturbations within a stimulus-coordinate subspace. It summarizes each representation via the expected projected pullback/Fisher metric under additive noise, asserts that this induces a second-moment family of local discrimination tasks for which the operator is a minimal complete dataset-level summary, and defines the Spectral Riemannian Alignment Score (S-RAS) as the log-spectral distance on the SPD manifold, which supplies a uniform multiplicative certificate over the lifted task values. Empirical results are reported on layer recovery across ANNs, dissociations between standard and robust training, transferable probes, and stimulus-coordinate effects in mouse V1 from the Allen Brain Observatory gratings dataset.
Significance. If the modeling assumptions hold, the work supplies a principled geometric tool for quantifying local discriminability differences that global readout agreement measures miss, with the certificate property and dataset-level minimality as notable formal strengths. The empirical demonstrations on both artificial networks and biological data suggest practical utility for comparing representations across training regimes and species.
major comments (1)
- [Abstract / theoretical framework] Abstract and theoretical construction: the assertion that the projected Fisher metric 'provides a minimal, complete dataset-level summary of expected discriminability' and that the log-spectral distance yields a 'uniform multiplicative certificate over the corresponding family of lifted task values' depends on the chosen stimulus-coordinate subspace and additive Gaussian noise model accurately spanning the relevant local discrimination tasks. These are modeling choices whose mismatch would make the S-RAS distance uninformative about actual sensitivity differences; no first-principles derivation or robustness check to alternative subspaces/noise models is provided to support the minimality/completeness claim.
minor comments (1)
- [Method] The regularization strength for the signatures is listed as a free parameter; its effect on the claimed uniformity of the certificate and on empirical stability should be quantified or bounded.
Simulated Author's Rebuttal
We thank the referee for their positive summary of the work and for identifying this important point about the scope of the theoretical claims. We respond to the major comment below.
read point-by-point responses
-
Referee: [Abstract / theoretical framework] Abstract and theoretical construction: the assertion that the projected Fisher metric 'provides a minimal, complete dataset-level summary of expected discriminability' and that the log-spectral distance yields a 'uniform multiplicative certificate over the corresponding family of lifted task values' depends on the chosen stimulus-coordinate subspace and additive Gaussian noise model accurately spanning the relevant local discrimination tasks. These are modeling choices whose mismatch would make the S-RAS distance uninformative about actual sensitivity differences; no first-principles derivation or robustness check to alternative subspaces/noise models is provided to support the minimality/completeness claim.
Authors: We agree that the minimality, completeness, and certificate properties are established relative to the family of local discrimination tasks induced by second-moment statistics under the additive Gaussian noise model within the chosen stimulus subspace. The derivation proceeds by showing that expected discriminability for tasks in this family reduces to quadratic forms governed by the projected Fisher metric (via the local expansion of the log-likelihood ratio under Gaussian perturbations), making the metric a sufficient statistic for that family; this is a direct consequence of information-geometric properties of the Fisher metric as the local Hessian of KL divergence. The log-spectral distance on SPD matrices then supplies the uniform multiplicative bound on distortion of these quadratic forms. The manuscript states these relations in the theoretical framework, but we acknowledge that the text does not include explicit robustness checks against alternative noise models or subspaces. In the revision we will (i) add a clarifying paragraph in the introduction and discussion that explicitly delimits the claims to the stated modeling assumptions and (ii) include a supplementary robustness analysis on synthetic data using alternative noise distributions (e.g., Laplace) to verify that the main empirical conclusions remain qualitatively stable. This constitutes a partial revision. revision: partial
Circularity Check
No significant circularity detected in the derivation
full rationale
The paper constructs the projected Fisher metric and S-RAS directly from the definitions of local decodable information, Fisher information, pullback metrics, and the log-spectral distance on SPD matrices. The claim that the resulting operator is a minimal complete summary of expected discriminability follows from the induced second-moment family by the stated geometric construction, without any reduction to fitted parameters on target data, self-citation chains, or renaming of prior results as new derivations. No equations or steps equate a prediction to its own inputs by construction. The framework remains independent of the alignment scores it computes.
Axiom & Free-Parameter Ledger
free parameters (1)
- regularization strength for signatures
axioms (2)
- domain assumption Local perturbations are modeled with additive Gaussian noise whose covariance allows Fisher information to be well-defined.
- standard math The manifold of symmetric positive definite matrices with the log-spectral distance forms a valid metric space for comparing the summary operators.
invented entities (1)
-
Spectral Riemannian Alignment Score (S-RAS)
no independent evidence
Lean theorems connected to this paper
-
Foundation/AlphaCoordinateFixation.lean (cosh/log-coordinate cost in RS uses ratio symmetry x↔x⁻¹, not SPD/AIRM)CostAlphaLog / Jcost unclear?
unclearRelation between the paper passage and the cited Recognition theorem.
We compare lifted signatures with the affine-invariant Riemannian metric on S^k_++, d_AIRM(A,B) := ||log(A^{-1/2} B A^{-1/2})||_F
-
Foundation/ArithmeticFromLogic.lean (RS cost-uniqueness is washburn_uniqueness_aczel for J(x)=½(x+x⁻¹)−1; paper uses Fisher quadratic form, no ratio symmetry)washburn_uniqueness_aczel unclear?
unclearRelation between the paper passage and the cited Recognition theorem.
the projected expected Fisher operator F_{f,ψ,P,Σ} := E_{s∼ν}[P^⊤ J_{h_f}(s)^⊤ Σ^{-1} J_{h_f}(s) P] ... is exactly the minimal complete dataset-level summary of expected local discriminability.
What do these tags mean?
- matches
- The paper's claim is directly supported by a theorem in the formal canon.
- supports
- The theorem supports part of the paper's argument, but the paper may add assumptions or extra steps.
- extends
- The paper goes beyond the formal theorem; the theorem is a base layer rather than the whole result.
- uses
- The paper appears to rely on the theorem as machinery.
- contradicts
- The paper's claim conflicts with a theorem or certificate in the canon.
- unclear
- Pith found a possible connection, but the passage is too broad, indirect, or ambiguous to say the theorem truly supports the claim.
Reference graph
Works this paper leans on
-
[1]
L. F. Abbott and Peter Dayan. The effect of correlated variability on the accuracy of a population code.Neural Computation, 11(1):91–101, 1999. doi: 10.1162/089976699300016827
-
[2]
Allen Brain Observatory: Visual Coding—Static Gratings
Allen Institute for Brain Science. Allen Brain Observatory: Visual Coding—Static Gratings. https://observatory.brain-map.org/visualcoding/stimulus/static_ gratings, 2016. Accessed: 2026-04-30
2016
-
[3]
Simoncelli
Alexander Berardino, Johannes Ballé, Valero Laparra, and Eero P. Simoncelli. Eigen-distortions of hierarchical representations. InAdvances in Neural Information Processing Systems (NeurIPS), 2017
2017
-
[4]
Kosio Beshkov, Marianne Fyhn, Torkel Hafting, and Gaute T. Einevoll. Topological structure of population activity in mouse visual cortex encodes densely sampled stimulus rotations.iScience, 27(4):109370, 2024. doi: 10.1016/j.isci.2024.109370
-
[5]
Nicolas Brunel and Jean-Pierre Nadal. Mutual information, fisher information, and population coding.Neural Computation, 10(7):1731–1757, 1998. doi: 10.1162/089976698300017115
-
[6]
N Alex Cayco-Gajic and Arthur Pellegrino. Geometry-aware similarity metrics for neural representations on Riemannian and statistical manifolds.arXiv preprint arXiv:2603.28764, 2026
-
[7]
Reliability of cka as a similarity measure in deep learning.arXiv preprint arXiv:2210.16156(2022)
MohammadReza Davari, Stefan Horoi, Amine Natik, Guillaume Lajoie, Guy Wolf, and Eugene Belilovsky. On the reliability of cka as a similarity measure in deep learning.arXiv preprint arXiv:2210.16156, 2022
-
[8]
Peter Dayan and L. F. Abbott.Theoretical Neuroscience: Computational and Mathematical Modeling of Neural Systems. The MIT Press, Cambridge, MA, 2001
2001
-
[9]
Saskia E. J. de Vries, Jerome A. Lecoq, Michael A. Buice, et al. A large-scale standard- ized physiological survey reveals functional organization of the mouse visual cortex.Nature Neuroscience, 23:138–151, 2020. doi: 10.1038/s41593-019-0550-9
-
[10]
An image is worth 16x16 words: Transformers for image recognition at scale
Alexey Dosovitskiy, Lucas Beyer, Alexander Kolesnikov, Dirk Weissenborn, Xiaohua Zhai, Thomas Unterthiner, Mostafa Dehghani, Matthias Minderer, Georg Heigold, Sylvain Gelly, Jakob Uszkoreit, and Neil Houlsby. An image is worth 16x16 words: Transformers for image recognition at scale. InInternational Conference on Learning Representations, 2021. URL https:...
2021
-
[11]
Ecker, Philipp Berens, Georgios A
Alexander S. Ecker, Philipp Berens, Georgios A. Keliris, Matthias Bethge, Nikos K. Logothetis, and Andreas S. Tolias. The effect of noise correlations in populations of diversely tuned neurons. Journal of Neuroscience, 31(40):14272–14283, 2011. doi: 10.1523/JNEUROSCI.2539-11.2011
-
[12]
Harvey, Alex H
Jenelle Feather, David Lipshutz, Sarah E. Harvey, Alex H. Williams, and Eero P. Simoncelli. Discriminating image representations with principal distortions. InInternational Conference on Learning Representations (ICLR), 2025
2025
-
[13]
Green and John A
David M. Green and John A. Swets.Signal Detection Theory and Psychophysics. John Wiley & Sons, New York, 1966
1966
-
[14]
Harvey, David Lipshutz, and Alex H
Sarah E. Harvey, David Lipshutz, and Alex H. Williams. What representational similarity measures imply about decodable information.arXiv preprint arXiv:2411.08197, 2024. Also presented at UniReps 2024 workshop. 10
-
[15]
Deep residual learning for im- age recognition
Kaiming He, Xiangyu Zhang, Shaoqing Ren, and Jian Sun. Deep residual learning for im- age recognition. InProceedings of the IEEE Conference on Computer Vision and Pattern Recognition, pages 770–778, 2016
2016
-
[16]
Horn and Charles R
Roger A. Horn and Charles R. Johnson.Matrix Analysis. Cambridge University Press, second edition, 2012
2012
-
[17]
Similarity of neural network representations revisited
Simon Kornblith, Mohammad Norouzi, Honglak Lee, and Geoffrey Hinton. Similarity of neural network representations revisited. InInternational Conference on Machine Learning (ICML), pages 3519–3529. PMLR, 2019
2019
-
[18]
Representational similarity analysis—connecting the branches of systems neuroscience.Frontiers in Systems Neuroscience, 2:4, 2008
Nikolaus Kriegeskorte, Marieke Mur, and Peter A Bandettini. Representational similarity analysis—connecting the branches of systems neuroscience.Frontiers in Systems Neuroscience, 2:4, 2008
2008
-
[19]
Learning multiple layers of features from tiny images
Alex Krizhevsky. Learning multiple layers of features from tiny images. Techni- cal report, University of Toronto, 2009. URL https://www.cs.toronto.edu/~kriz/ learning-features-2009-TR.pdf
2009
-
[20]
Understanding image representations by measuring their equivariance and equivalence
Karel Lenc and Andrea Vedaldi. Understanding image representations by measuring their equivariance and equivalence. InProceedings of the IEEE Conference on Computer Vision and Pattern Recognition (CVPR), 2015
2015
-
[21]
Harvey, Alex H
David Lipshutz, Jenelle Feather, Sarah E. Harvey, Alex H. Williams, and Eero P. Simoncelli. Comparing the local information geometry of image representations.OpenReview preprint, 2024
2024
-
[22]
Towards deep learning models resistant to adversarial attacks
Aleksander Madry, Aleksandar Makelov, Ludwig Schmidt, Dimitris Tsipras, and Adrian Vladu. Towards deep learning models resistant to adversarial attacks. InInternational Conference on Learning Representations, 2018. URLhttps://openreview.net/forum?id=rJzIBfZAb
2018
-
[23]
A Riemannian framework for tensor computing.International Journal of Computer Vision, 2006
Xavier Pennec, Pierre Fillard, and Nicholas Ayache. A Riemannian framework for tensor computing.International Journal of Computer Vision, 2006
2006
-
[24]
Alexandre Pouget, Peter Dayan, and Richard S. Zemel. Information processing with population codes.Nature Reviews Neuroscience, 1(2):125–132, 2000. doi: 10.1038/35039062
-
[25]
SVCCA: Singu- lar vector canonical correlation analysis for deep learning dynamics and interpretability
Maithra Raghu, Justin Gilmer, Jason Yosinski, and Jascha Sohl-Dickstein. SVCCA: Singu- lar vector canonical correlation analysis for deep learning dynamics and interpretability. In Advances in Neural Information Processing Systems (NeurIPS), volume 30, 2017
2017
-
[26]
H. S. Seung and H. Sompolinsky. Simple models for reading neuronal population codes. Proceedings of the National Academy of Sciences, 90(22):10749–10753, 1993. doi: 10.1073/ pnas.90.22.10749
1993
-
[27]
Carsen Stringer, Marius Pachitariu, Nicholas Steinmetz, Matteo Carandini, and Kenneth D. Harris. High-dimensional geometry of population responses in visual cortex.Nature, 571: 361–365, 2019. doi: 10.1038/s41586-019-1346-5
-
[28]
Improving adversarial robustness requires revisiting misclassified examples
Yisen Wang, Difan Zou, Jinfeng Yi, James Bailey, Xingjun Ma, and Quanquan Gu. Improving adversarial robustness requires revisiting misclassified examples. InInternational Conference on Learning Representations, 2020. URL https://openreview.net/forum?id=rklOg6EFwS
2020
-
[29]
Xing, Laurent El Ghaoui, and Michael I
Hongyang Zhang, Yaodong Yu, Jiantao Jiao, Eric P. Xing, Laurent El Ghaoui, and Michael I. Jordan. Theoretically principled trade-off between robustness and accuracy. InProceedings of the 36th International Conference on Machine Learning, volume 97 ofProceedings of Machine Learning Research, pages 7472–7482. PMLR, 2019. URL https://proceedings. mlr.press/v...
2019
-
[30]
Simoncelli
Jingyang Zhou, Chanwoo Chun, Ajay Subramanian, and Eero P. Simoncelli. Comparing neural models using their perceptual discriminability predictions.Proceedings of Machine Learning Research (PMLR): UniReps Workshop, 2024. 11 A Theory details and proofs A.1 Derivation of local discriminability For the Gaussian discrimination task in Eq. (3), the two hypothes...
2024
-
[31]
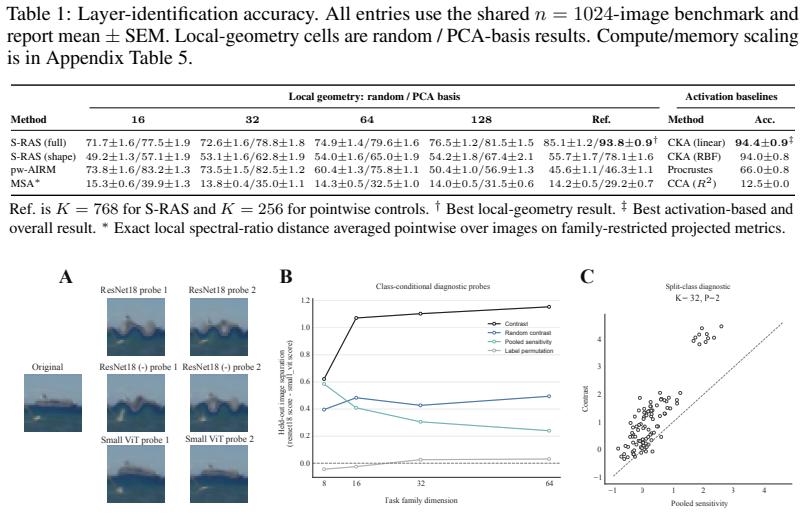
Random-contrast probes:random directions sampled in the same family and ranked by the same quadratic contrast criterion
-
[32]
Pooled-sensitivity probes:directions drawn from high-sensitivity directions under G(y) A,PK + G(y) B,PK and then ranked by the same contrast score within that restricted candidate set
-
[33]
baseline + Fisher
Label-permutation null:probes derived after randomly permuting discovery-set group labels, rebuilding the contrast from those permuted labels, and deriving probes from that null contrast. Main result.At the main setting ( K= 32 , two probes per side), contrast-derived probes achieve mean held-out image separation 1.10, compared with 0.43 for random-contra...
discussion (0)
Sign in with ORCID, Apple, or X to comment. Anyone can read and Pith papers without signing in.