Recognition: 3 theorem links
· Lean TheoremDo Venture Capitalists Beat Random Allocation?
Pith reviewed 2026-05-08 17:46 UTC · model grok-4.3
The pith
Venture capital portfolios perform indistinguishably from random allocation in high-multiple outcomes.
A machine-rendered reading of the paper's core claim, the machinery that carries it, and where it could break.
Core claim
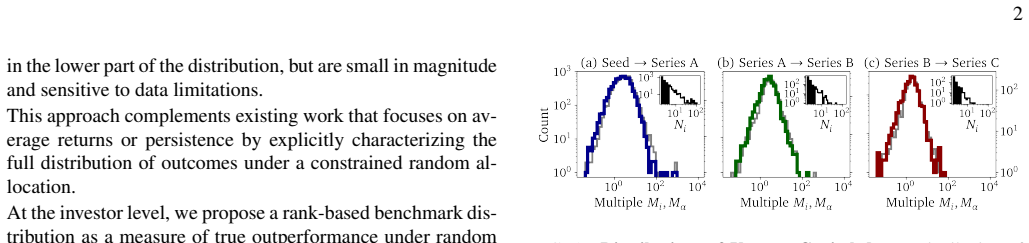
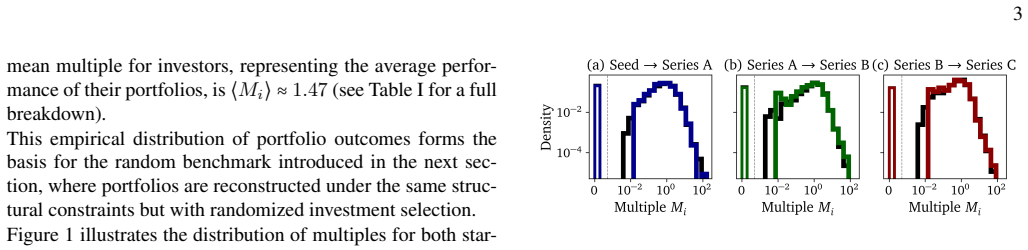
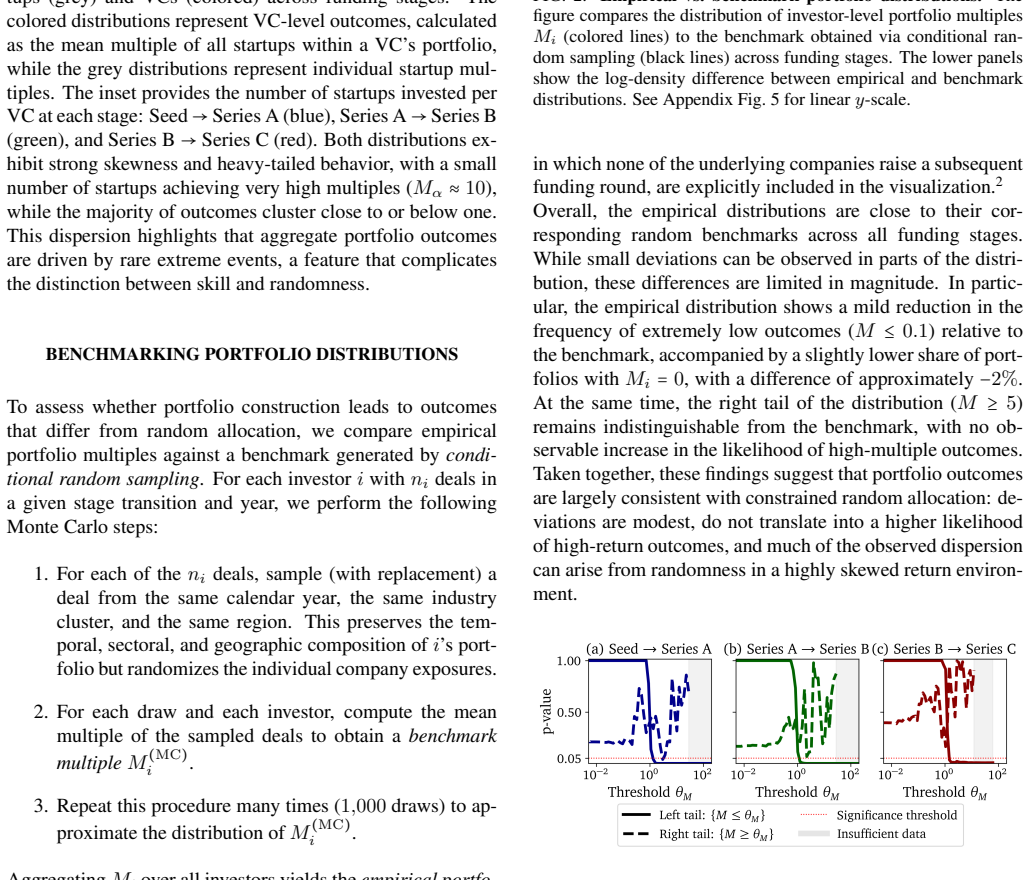
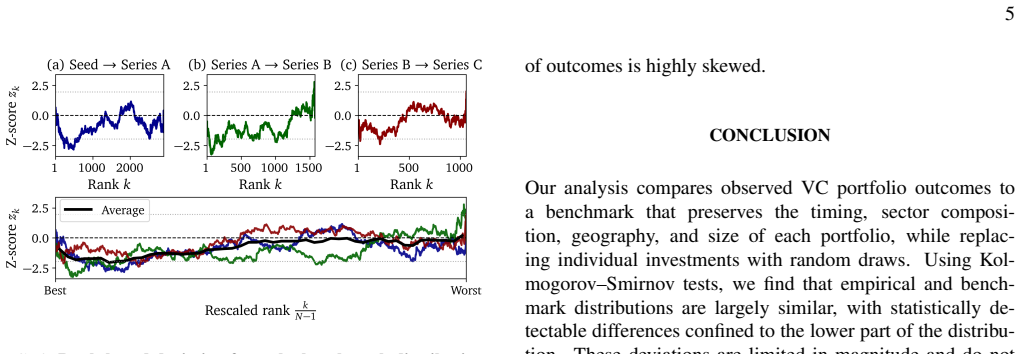
Across funding stages, empirical VC portfolio distributions appear remarkably close to their random benchmarks. The right tail remains statistically indistinguishable from random allocation, with no evidence that portfolio construction increases the probability of high-multiple outcomes. A rank-based benchmark further shows that even the best-performing portfolios do not exceed the outcomes expected for their rank under random sampling. The results suggest that VC portfolio outcomes are largely consistent with constrained random allocation.
What carries the argument
Constrained random benchmark that preserves timing, geography, sector composition, and portfolio size while randomizing individual company selection.
If this is right
- High-multiple outcomes occur at rates expected from random company selection given the constraints.
- Identifying skill in VC is difficult due to heavy-tailed return distributions.
- Even top-ranked portfolios align with random expectations for their position.
- A similar pattern of random-like performance appears for financial analysts predicting earnings.
Where Pith is reading between the lines
- The constrained randomization approach could test for skill in other high-variance investment settings.
- If the benchmark holds, VC returns may reflect market and timing exposure more than individual selection ability.
- Post-investment value-add by investors might explain returns even if initial company choice does not.
Load-bearing premise
The constrained random benchmark fully captures the null case of no skill by fixing timing and other traits while only randomizing company choice.
What would settle it
A statistically significant excess of high-multiple outcomes in real VC portfolios relative to the constrained random benchmarks, using a larger or updated dataset, would contradict the central finding.
Figures


read the original abstract
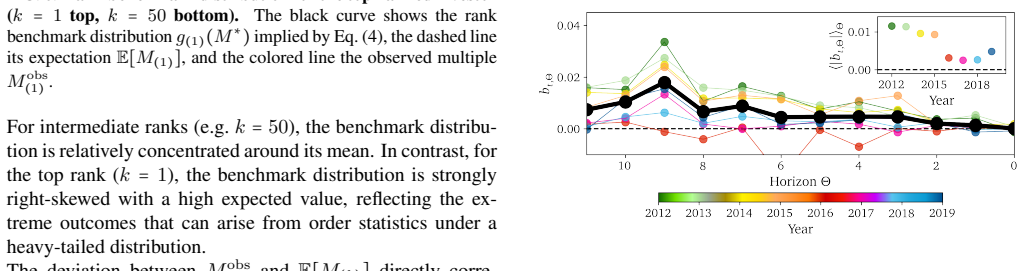
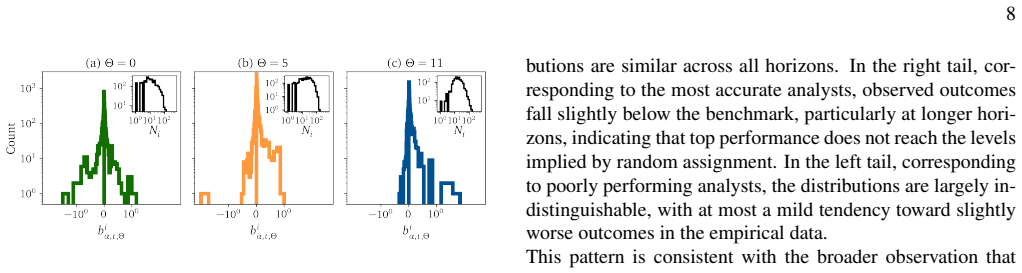
Venture capital outcomes are dominated by a small number of extreme successes, making it difficult to distinguish investor skill from favorable realizations in a highly skewed return distribution. We study this question by comparing empirical VC portfolios to a constrained random benchmark that preserves key portfolio characteristics, including timing, geography, sector composition, and portfolio size, while randomizing individual company selection. Across funding stages, empirical portfolio distributions appear remarkably close to their random benchmarks. We find no evidence that portfolio construction increases the probability of high-multiple outcomes: the right tail remains statistically indistinguishable from random allocation. Deviations in the lower part of the distribution are small and sensitive to the interpretation of zero outcomes, suggesting at most weak evidence of downside improvement. We further introduce a rank-based benchmark distribution to evaluate outperformance at each position in the cross-section. This analysis shows that even the best-performing portfolios do not exceed the outcomes expected for their rank under random sampling. Our results suggest that VC portfolio outcomes are largely consistent with constrained random allocation, highlighting the difficulty of identifying aggregate skill in heavy-tailed investment environments. A similar conclusion holds for the performance of financial analysts in predicting future earnings.
Editorial analysis
A structured set of objections, weighed in public.
Referee Report
Summary. The manuscript compares empirical distributions of venture capital portfolio multiples to a constrained random benchmark that preserves timing, geography, sector composition, portfolio size, and stage while randomizing individual company selection. It reports that right-tail outcomes (probability of high-multiple successes) are statistically indistinguishable from the random benchmark across funding stages, with no evidence that portfolio construction improves the likelihood of extreme successes. A supplementary rank-based permutation test shows that even the best observed portfolios do not exceed rank-conditional expectations under randomization. Lower-tail deviations are small and sensitive to zero-outcome coding. A parallel analysis reaches similar conclusions for financial analysts' earnings predictions.
Significance. If the empirical comparisons hold, the paper provides a rigorous test of skill versus luck in a heavy-tailed investment setting, with implications for understanding VC performance and active management more broadly. The constrained benchmark and rank-based approach offer a transparent way to isolate the effect of company selection while holding other portfolio features fixed, and the extension to analysts suggests the result may generalize to other high-uncertainty forecasting domains. Strengths include the use of an externally constructed null benchmark and explicit acknowledgment of sensitivity in lower-tail results.
minor comments (4)
- The methods section should provide the exact number of Monte Carlo simulations used to construct the random benchmark distributions and report standard errors or confidence bands around the tail probabilities to allow readers to assess the precision of the indistinguishability claim.
- The rank-based benchmark analysis (introduced to evaluate outperformance at each position) would benefit from a short formal definition or pseudocode showing how rank-conditional expectations are calculated under the permutation procedure.
- The brief extension to financial analysts' earnings predictions should include a short description of the data source, sample size, and exact benchmark construction used, so that the parallel conclusion can be evaluated independently.
- In the figures comparing empirical and benchmark distributions, add vertical lines or annotations at the top-decile threshold and ensure the random benchmark is plotted with sufficient contrast and any variability measures.
Simulated Author's Rebuttal
We thank the referee for the accurate and concise summary of our manuscript, which correctly captures our core finding that empirical VC portfolio outcomes are largely consistent with constrained random allocation and show no evidence of superior high-multiple outcomes. We appreciate the positive assessment of the constrained benchmark, the rank-based permutation test, and the extension to financial analysts, as well as the recommendation for minor revision. No specific major comments were raised in the report.
Circularity Check
No significant circularity; purely empirical benchmark comparison
full rationale
The manuscript is an empirical study that constructs a constrained random benchmark by preserving observed portfolio timing, geography, sector, size, and stage while resampling company identities from the data. The headline result follows directly from statistical comparison of the empirical right-tail distributions to this benchmark, with no equations, fitted parameters, or derivations that reduce the outcome to the inputs by construction. No self-citations are invoked as load-bearing uniqueness theorems or ansatzes; the rank-based permutation test is a standard resampling procedure applied to the same data. The analysis is self-contained against external data benchmarks and does not rely on prior author work to justify its central claim.
Axiom & Free-Parameter Ledger
Reference graph
Works this paper leans on
-
[1]
This preserves the tem- poral, sectoral, and geographic composition ofi’s port- folio but randomizes the individual company exposures
For each of then i deals, sample (with replacement) a deal from the same calendar year, the same industry cluster, and the same region. This preserves the tem- poral, sectoral, and geographic composition ofi’s port- folio but randomizes the individual company exposures
-
[2]
For each draw and each investor, compute the mean multiple of the sampled deals to obtain abenchmark multipleM (MC) i
-
[3]
Repeat this procedure many times (1,000draws) to ap- proximate the distribution ofM (MC) i . AggregatingM i over all investors yields theempirical portfo- lio distribution, while aggregatingM (MC) i over all investors and all Monte Carlo draws yields thebenchmark distribu- tion. Since the benchmark respects the size, year, and cluster composition of each ...
-
[4]
Jerdee and M
M. Jerdee and M. Newman, Luck, skill, and depth of compe- tition in games and social hierarchies, Science Advances10, eadn2654 (2024)
2024
-
[5]
M. C. Jensen, The performance of mutual funds in the period 1945–1964, Journal of Finance23, 389 (1968)
1945
-
[6]
M. M. Carhart, On persistence in mutual fund performance, Journal of Finance52, 57 (1997)
1997
-
[7]
E. F. Fama, Efficient capital markets: A review of theory and empirical work, Journal of Finance25, 383 (1970)
1970
-
[8]
E. F. Fama and K. R. French, Luck versus skill in the cross- section of mutual fund returns, Journal of Finance65, 1915 (2010)
1915
-
[9]
Barras, O
L. Barras, O. Scaillet, and R. Wermers, False discoveries in mutual fund performance: Measuring luck in estimated alphas, Journal of Finance65, 179 (2010)
2010
-
[10]
Kosowski, A
R. Kosowski, A. Timmermann, R. Wermers, and H. White, Can mutual fund “stars” really pick stocks? new evidence from a bootstrap analysis, Journal of Finance61, 2551 (2006)
2006
-
[11]
S. N. Kaplan and A. Schoar, Private equity performance: Re- turns, persistence, and capital flows, Journal of Finance60, 1791 (2005)
2005
-
[12]
Gompers, A
P. Gompers, A. Kovner, J. Lerner, and D. Scharfstein, Skill vs. luck in entrepreneurship and venture capital: Evidence from se- rial entrepreneurs, Journal of Financial Economics92, 1 (2006)
2006
-
[13]
Korteweg and M
A. Korteweg and M. Sørensen, Skill and luck in private equity performance, Journal of Financial Economics124, 535 (2017)
2017
-
[14]
Malladi, Skill and luck in hedge fund performance, Journal of Financial Economics (2020)
R. Malladi, Skill and luck in hedge fund performance, Journal of Financial Economics (2020)
2020
-
[15]
S. M. Hartzmark, Luck versus skill in the cross section of mu- tual fund returns, Journal of Finance (2016)
2016
-
[16]
Zajdenweber, ´Economie des extr ˆemes(Flammarion, 2000)
D. Zajdenweber, ´Economie des extr ˆemes(Flammarion, 2000)
2000
-
[17]
Gabaix, Power laws in economics and finance, Annual Re- view of Economics1, 255 (2009)
X. Gabaix, Power laws in economics and finance, Annual Re- view of Economics1, 255 (2009)
2009
-
[18]
Bouchaud and M
J.-P. Bouchaud and M. M ´ezard, Wealth condensation in a sim- ple model of economy, Physica A: Statistical Mechanics and its Applications282, 536 (2000)
2000
-
[19]
N. N. Taleb,The Black Swan: The Impact of the Highly Improb- able(Random House, 2007)
2007
-
[20]
Pluchino, A
A. Pluchino, A. E. Biondo, and A. Rapisarda, Talent vs luck: The role of randomness in success and failure, Advances in Complex Systems21, 1850014 (2018)
2018
-
[21]
Bernard, J.-P
M. Bernard, J.-P. Bouchaud, and P. Le Doussal, Mean-field the- ory for heterogeneous random growth with redistribution, Phys- ical Review E113, L032101 (2026)
2026
-
[22]
Guedj and J.-P
O. Guedj and J.-P. Bouchaud, Experts’ earning forecasts: bias, herding and gossamer information, International Journal of Theoretical and Applied Finance8, 933 (2005)
2005
-
[23]
crunchbase.com(2024), accessed: 2025-01-12
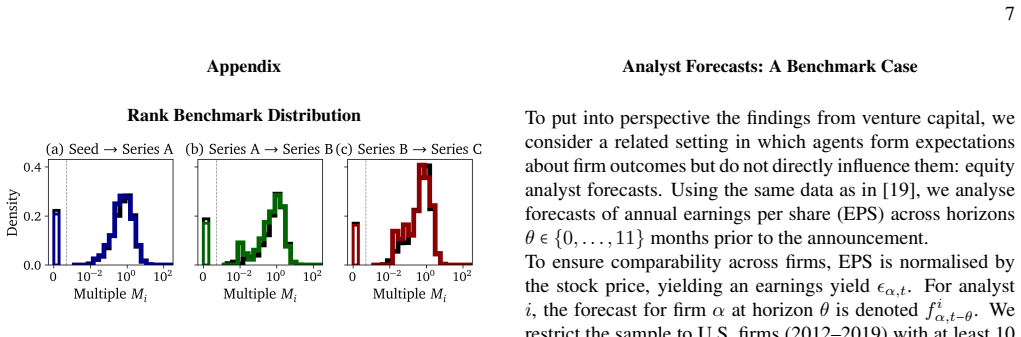
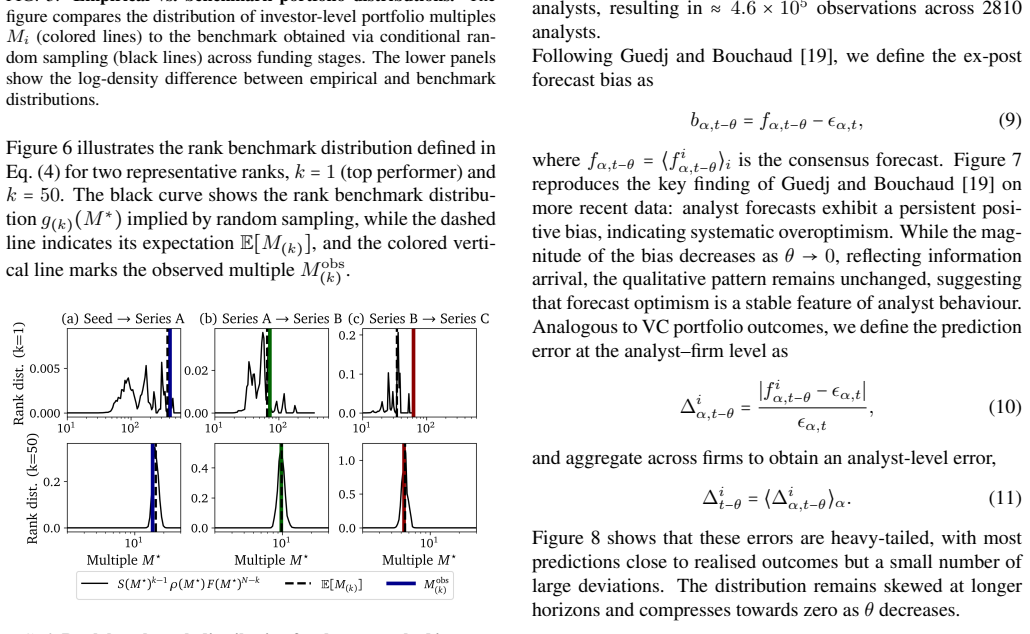
Crunchbase, Inc., Crunchbase dataset,https://www. crunchbase.com(2024), accessed: 2025-01-12. 7 Appendix Rank Benchmark Distribution FIG. 5.Empirical vs. benchmark portfolio distributions.The figure compares the distribution of investor-level portfolio multiples Mi (colored lines) to the benchmark obtained via conditional ran- dom sampling (black lines) a...
2024
discussion (0)
Sign in with ORCID, Apple, or X to comment. Anyone can read and Pith papers without signing in.