Recognition: 2 theorem links
Investigating the Effects of Bars on Star Formation and Nuclear Activity of Galaxies Using DESI Survey Data
Pith reviewed 2026-05-08 17:48 UTC · model grok-4.3
The pith
Bars in disk galaxies drive central star formation and black hole accretion by channeling gas inward, while helping to quench star formation in massive systems.
A machine-rendered reading of the paper's core claim, the machinery that carries it, and where it could break.
Core claim
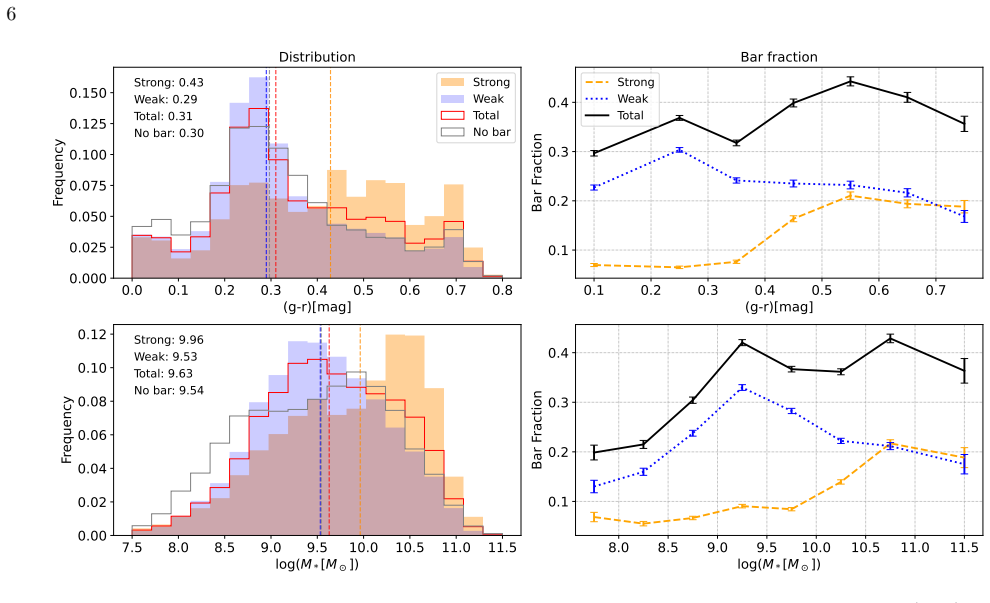
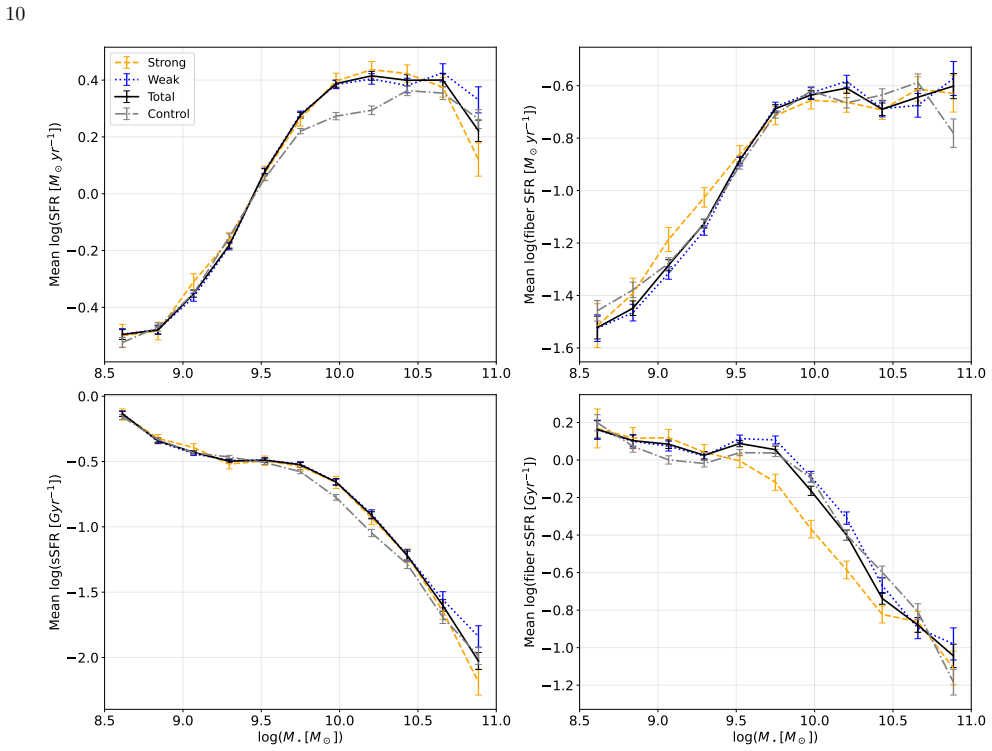
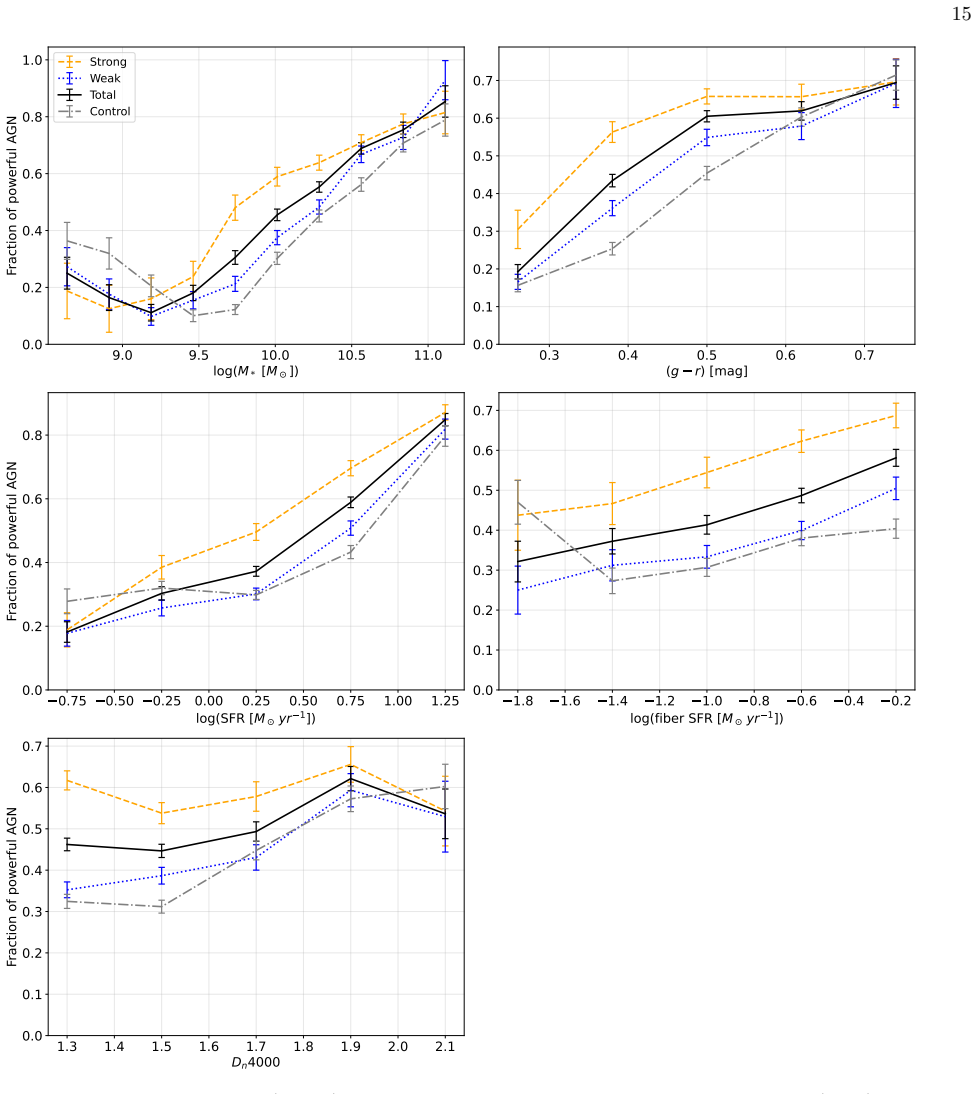
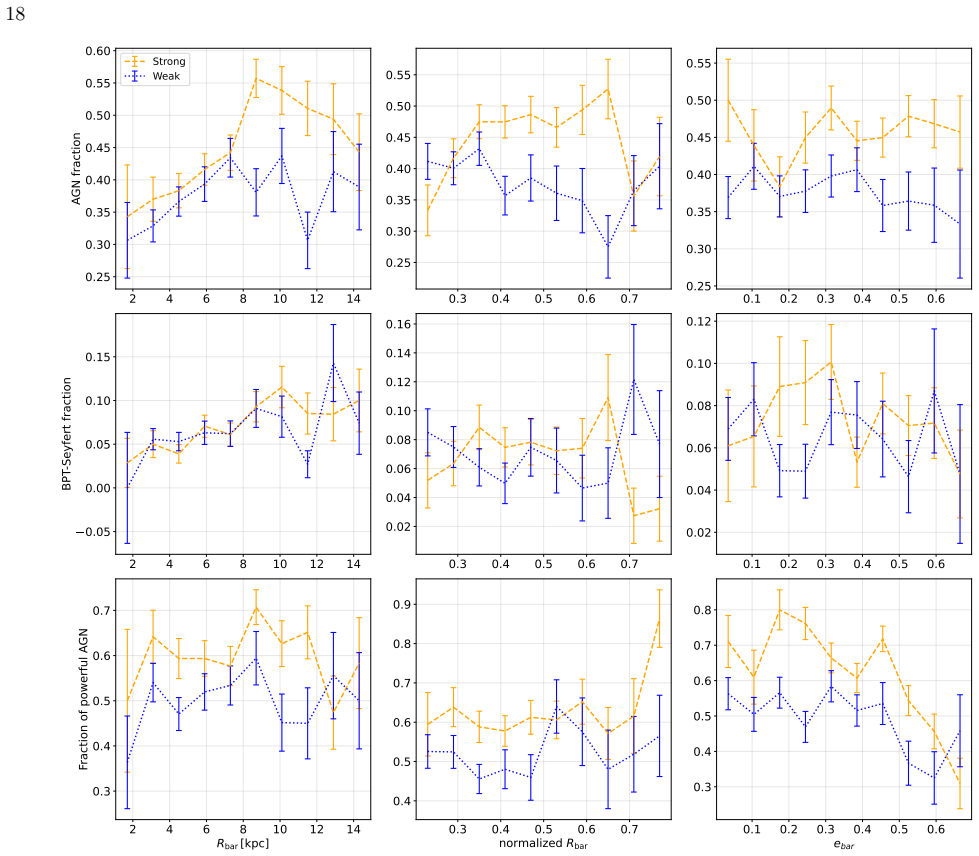
Using morphological classifications from Galaxy Zoo DESI, the analysis finds that barred galaxies exhibit a bimodal distribution in color-mass space, with strong bars enhancing central star formation in low-mass systems while reducing specific star formation rates in massive ones through accelerated gas consumption. Barred systems display a higher incidence of AGN activity, particularly powerful AGN in strongly barred galaxies, supporting the view that bars transport angular momentum and drive gas inflows to fuel both central star formation and supermassive black hole accretion alongside other evolutionary processes.
What carries the argument
Statistical comparison of strong-bar, weak-bar, and unbarred disk galaxies using DESI DR1 photometry and Galaxy Zoo DESI visual classifications to track differences in color-mass distribution, central and global star formation rates, metallicity, and AGN fractions.
If this is right
- Strong bars increase central star formation rates in low-mass galaxies.
- Strong bars lower specific star formation rates in massive galaxies by speeding up gas use.
- Barred galaxies show elevated AGN activity overall, with the highest fractions in strongly barred systems.
- The link between bars and nuclear activity appears indirect, as correlations with detailed bar structural parameters are weak.
- Bars operate together with other mechanisms in shaping overall galaxy evolution.
Where Pith is reading between the lines
- Galaxy formation models may need to treat bar-driven gas inflows as a standard channel for building central stellar mass and feeding black holes at low redshift.
- The reported color-mass bimodality could help explain why some disk galaxies transition to red sequences without requiring external triggers like mergers.
- Higher-resolution imaging or kinematic data could test whether the strength of observed inflows scales directly with bar strength in individual systems.
- The dual role of bars (trigger then quench) implies that the timing of bar formation relative to gas reservoir size determines whether a galaxy ends up star-forming or quenched.
Load-bearing premise
Galaxy Zoo DESI visual classifications correctly and without bias identify strong bars, weak bars, and unbarred disks, and the 0.01 to 0.05 redshift disk-galaxy sample contains no major selection effects that could produce the observed trends in color, star formation, or AGN activity.
What would settle it
Repeating the analysis with an independent automated bar-detection method on the same DESI sample and finding no significant differences in central star formation rates or AGN incidence between barred and unbarred galaxies would undermine the reported connections.
Figures


read the original abstract
We present a statistical analysis of the connections between galactic bars, star formation, and active galactic nucleus (AGN) activity using 33,201 disk galaxies (0.01 < z < 0.05) from DESI DR1 cross-matched with Galaxy Zoo DESI. Based on morphological classifications, we identify 3,508 strongly barred and 8,335 weakly barred systems. We find that barred galaxies exhibit a clear bimodal distribution in color-mass space: weak bars are preferentially found in bluer, lower-mass disks, whereas strong bars are more common in massive, redder systems. Strongly barred galaxies are on average more massive and metal-rich than unbarred systems. In addition, strong bars enhance central SFRs in low-mass galaxies but reduce sSFRs in massive systems, reflecting a dual role where bars initially trigger central star formation but eventually promote quenching by accelerating gas consumption. In terms of nuclear activity, barred galaxies display a higher incidence of AGN activity. The presence of a bar is also associated with an increased fraction of powerful AGN, with the highest proportions found in strongly barred systems. However, the correlations between AGN activity and detailed bar structural parameters are weak, suggesting that the link between bars and nuclear activity is indirect and regulated by multiple factors. Overall, our results support a scenario in which bars facilitate angular-momentum transport and gas inflow, thereby driving central star formation and fueling supermassive black hole accretion while operating alongside other processes that shape galaxy evolution.
Editorial analysis
A structured set of objections, weighed in public.
Referee Report
Summary. The manuscript analyzes 33,201 disk galaxies (0.01 < z < 0.05) from DESI DR1 cross-matched with Galaxy Zoo DESI morphologies. It identifies 3,508 strongly barred and 8,335 weakly barred systems and reports a bimodal color-mass distribution (weak bars in bluer low-mass disks, strong bars in redder massive systems), mass-dependent bar effects on star formation (enhanced central SFR in low-mass galaxies, reduced sSFR in massive ones), higher AGN incidence in barred galaxies, and an indirect link between bars and nuclear activity. The authors interpret the trends as support for bars driving angular-momentum transport and gas inflow while operating alongside other evolutionary processes.
Significance. If the reported trends prove robust after bias corrections, the work would add a large-sample observational constraint on the role of bars in central gas fueling, with implications for models of quenching and black-hole growth. The sample size from DESI DR1 is a clear asset for statistical power, though the absence of quantified controls limits immediate impact on consensus views of bar-driven evolution.
major comments (2)
- [Section 2] Section 2 (Data and Sample Selection): No vote-fraction thresholds, inter-classifier agreement metrics, or explicit tests for classification bias as a function of stellar mass, color, or inclination are described for the Galaxy Zoo DESI strong/weak bar labels. This is load-bearing for the central claims, as mass- or color-dependent classification systematics could artifactually generate the reported color-mass bimodality and the mass-dependent SFR trends.
- [Results] Results section (SFR and AGN trends): The dual role of bars (enhancing central SFR at low mass but suppressing sSFR at high mass) and the elevated AGN fraction are presented without reported error bars on the binned trends, without a control sample matched in environment or gas content, and without quantitative assessment of statistical significance after accounting for the mass-color correlation. These omissions prevent verification that the trends are physical rather than driven by unaccounted confounders.
minor comments (2)
- [Abstract] Abstract: The term 'powerful AGN' is used without a definition (e.g., specific luminosity or Eddington-ratio threshold); this should be stated explicitly when first introduced.
- [Results] Notation: The distinction between SFR and sSFR is clear in the text, but a brief reminder of the exact aperture or fiber-based measurement used for 'central SFR' would aid readability.
Simulated Author's Rebuttal
We thank the referee for the thoughtful and constructive report. The comments highlight important areas for improving methodological transparency and statistical robustness, which we address below. We will revise the manuscript accordingly to strengthen the presentation of our results on bar-driven evolution in the DESI sample.
read point-by-point responses
-
Referee: [Section 2] Section 2 (Data and Sample Selection): No vote-fraction thresholds, inter-classifier agreement metrics, or explicit tests for classification bias as a function of stellar mass, color, or inclination are described for the Galaxy Zoo DESI strong/weak bar labels. This is load-bearing for the central claims, as mass- or color-dependent classification systematics could artifactually generate the reported color-mass bimodality and the mass-dependent SFR trends.
Authors: We agree that explicit documentation of the classification criteria is essential. The Galaxy Zoo DESI bar labels follow the standard vote-fraction approach validated in the GZD survey papers, with strong bars defined by p_strong > 0.5 and weak bars by 0.2 < p_weak < 0.5 (exact thresholds will be stated). Inter-classifier agreement metrics are reported in the GZD data release documentation as high (>80% for bar features). In the revised Section 2, we will add a dedicated paragraph with these details plus explicit bias tests: we will bin the sample by stellar mass, color, and inclination and show that the strong/weak bar fractions remain consistent across bins, with no systematic trends that could drive the observed color-mass bimodality. These additions will confirm the trends are not classification artifacts. revision: yes
-
Referee: [Results] Results section (SFR and AGN trends): The dual role of bars (enhancing central SFR at low mass but suppressing sSFR at high mass) and the elevated AGN fraction are presented without reported error bars on the binned trends, without a control sample matched in environment or gas content, and without quantitative assessment of statistical significance after accounting for the mass-color correlation. These omissions prevent verification that the trends are physical rather than driven by unaccounted confounders.
Authors: We will add bootstrap-derived error bars to all binned trends and median relations in the revised figures. To address confounders, we will include mass- and color-matched control subsamples (unbarred vs. barred) and perform stratified analyses. While DESI DR1 provides limited direct gas content and full environmental metrics for the entire sample, we will report partial Spearman correlations that explicitly control for the mass-color correlation and include p-values for the reported SFR and AGN trends. This quantifies significance while noting that complete gas and environment matching is beyond the current data scope; the large sample size still allows robust detection of bar effects alongside other processes. revision: partial
Circularity Check
No significant circularity; purely observational statistics
full rationale
The paper reports direct statistical measurements on 33,201 DESI disk galaxies cross-matched with Galaxy Zoo DESI morphological classifications. It counts strong/weak bars, plots color-mass distributions, compares average masses/metallicities, measures central SFR trends split by mass, and tabulates AGN fractions. No equations, model fits, predictions, or derivations appear in the provided text; all claims are empirical counts and trends. No self-citations are invoked as load-bearing uniqueness theorems or ansatzes. The analysis is self-contained against external survey data and does not reduce any result to its own inputs by construction.
Axiom & Free-Parameter Ledger
axioms (2)
- domain assumption Galaxy Zoo DESI morphological classifications reliably identify and distinguish strongly barred, weakly barred, and unbarred disk galaxies.
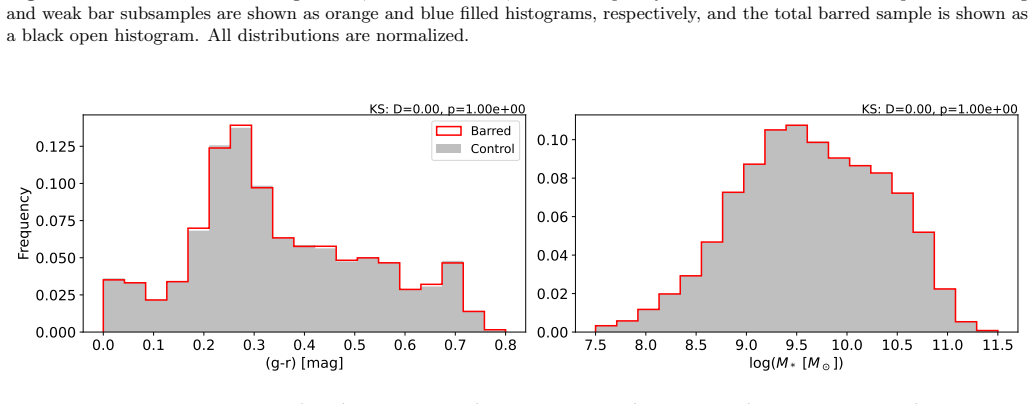
- domain assumption The 33,201-galaxy cross-matched sample at 0.01 < z < 0.05 is representative of the underlying disk population without major selection biases affecting color, mass, SFR, or AGN trends.
Reference graph
Works this paper leans on
-
[1]
Aguerri, J. A. L. 1999, A&A, 351, 43
1999
-
[2]
Aguerri, J. A. L., M´ endez-Abreu, J., & Corsini, E. M. 2009, A&A, 495, 491, doi: 10.1051/0004-6361:200810931
-
[3]
2000, A&A, 361, 841
Prieto, M. 2000, A&A, 361, 841
2000
-
[4]
The incidence of AGN as a function of star formation rate
Aird, J., Coil, A. L., & Georgakakis, A. 2019, MNRAS, 484, 4360, doi: 10.1093/mnras/stz125 23
-
[5]
Alexander, D. M., Davis, T. M., Chaussidon, E., et al. 2023, AJ, 165, 124, doi: 10.3847/1538-3881/acacfc
-
[6]
Lambas, D. G. 2018, A&A, 618, A149, doi: 10.1051/0004-6361/201832796
-
[7]
Assef, R. J., Stern, D., Noirot, G., et al. 2018, ApJS, 234, 23, doi: 10.3847/1538-4365/aaa00a
-
[8]
2003, MNRAS, 340, 1214, doi: 10.1046/j.1365-8711.2003.06380.x
Athanassoula, E. 2003, MNRAS, 341, 1179, doi: 10.1046/j.1365-8711.2003.06473.x
-
[9]
Baldwin, J. A., Phillips, M. M., & Terlevich, R. 1981, PASP, 93, 5, doi: 10.1086/130766
-
[10]
Barazza, F. D., Jogee, S., & Marinova, I. 2008, ApJ, 675, 1194, doi: 10.1086/526510
-
[11]
2015, MNRAS, 454, 3622, doi: 10.1093/mnras/stv2181
Berney, S., Koss, M., Trakhtenbrot, B., et al. 2015, MNRAS, 454, 3622, doi: 10.1093/mnras/stv2181
-
[12]
CIGALE: a python Code Investigating GALaxy Emission
Boquien, M., Burgarella, D., Roehlly, Y., et al. 2019, A&A, 622, A103, doi: 10.1051/0004-6361/201834156
-
[13]
2003, MNRAS, 340, 1214, doi: 10.1046/j.1365-8711.2003.06380.x
Bruzual, G., & Charlot, S. 2003, MNRAS, 344, 1000, doi: 10.1046/j.1365-8711.2003.06897.x
-
[14]
The Dust Content and Opacity of Actively Star-Forming Galaxies
Calzetti, D., Armus, L., Bohlin, R. C., et al. 2000, ApJ, 533, 682, doi: 10.1086/308692 Cervantes Sodi, B. 2017, ApJ, 835, 80, doi: 10.3847/1538-4357/835/1/80
-
[15]
2003, PASP, 115, 763, doi: 10.1086/376392
Chabrier, G. 2003, PASP, 115, 763, doi: 10.1086/376392
-
[16]
2023, ApJ, 944, 107, doi: 10.3847/1538-4357/acb3c2
Chaussidon, E., Y` eche, C., Palanque-Delabrouille, N., et al. 2023, ApJ, 944, 107, doi: 10.3847/1538-4357/acb3c2
-
[17]
Galaxy Zoo: Are bars responsible for the feeding of active galactic nuclei at 0.2 < z < 1.0?★
Cheung, E., Trump, J. R., Athanassoula, E., et al. 2015, MNRAS, 447, 506, doi: 10.1093/mnras/stu2462
-
[18]
2019, MNRAS, 484, 5192, doi: 10.1093/mnras/stz349
Chown, R., Li, C., Athanassoula, E., et al. 2019, MNRAS, 484, 5192, doi: 10.1093/mnras/stz349 Cid Fernandes, R., Stasi´ nska, G., Mateus, A., & Vale Asari, N. 2011, MNRAS, 413, 1687, doi: 10.1111/j.1365-2966.2011.18244.x
-
[19]
2015, , 576, A10, 10.1051/0004-6361/201425252
Ciesla, L., Charmandaris, V., Georgakakis, A., et al. 2015, A&A, 576, A10, doi: 10.1051/0004-6361/201425252 CSST Collaboration, Gong, Y., Miao, H., et al. 2026, Science China Physics, Mechanics, and Astronomy, 69, 239501, doi: 10.1007/s11433-025-2809-0
-
[20]
Cuomo, V., Lopez Aguerri, J. A., Corsini, E. M., et al. 2019, A&A, 632, A51, doi: 10.1051/0004-6361/201936415
-
[21]
Dale, D. A., Helou, G., Magdis, G. E., et al. 2014, ApJ, 784, 83, doi: 10.1088/0004-637X/784/1/83 de Vaucouleurs, G. 1959, Handbuch der Physik, 53, 275, doi: 10.1007/978-3-642-45932-0 7 DESI Collaboration, Abdul Karim, M., Adame, A. G., et al. 2026, AJ, 171, 285, doi: 10.3847/1538-3881/ae4c43
-
[22]
Dey, A., Schlegel, D. J., Lang, D., et al. 2019, AJ, 157, 168, doi: 10.3847/1538-3881/ab089d DiGiorgio Zanger, B., Westfall, K. B., Bundy, K., et al. 2024, ApJ, 973, 116, doi: 10.3847/1538-4357/ad6606
-
[23]
Drory, N., Blanc, G. A., Kreckel, K., et al. 2024, AJ, 168, 198, doi: 10.3847/1538-3881/ad6de9
-
[24]
2011, MNRAS, 418, 467, doi: 10.1111/j.1365-2966.2011.19497.x
Ellison, S. L., Nair, P., Patton, D. R., et al. 2011, MNRAS, 416, 2182, doi: 10.1111/j.1365-2966.2011.19195.x
-
[25]
Erwin, P., Debattista, V. P., & Anderson, S. R. 2023, MNRAS, 524, 3166, doi: 10.1093/mnras/stad1972
-
[26]
Eskridge, P. B., Frogel, J. A., Pogge, R. W., et al. 2000, AJ, 119, 536, doi: 10.1086/301203 Euclid Collaboration, Huertas-Company, M., Walmsley, M., et al. 2025a, arXiv e-prints, arXiv:2503.15311, doi: 10.48550/arXiv.2503.15311 Euclid Collaboration, Mellier, Y., Abdurro’uf, et al. 2025b, A&A, 697, A1, doi: 10.1051/0004-6361/202450810
-
[27]
2015, MNRAS, 454, 3641, doi: 10.1093/mnras/stv2247
Fanali, R., Dotti, M., Fiacconi, D., & Haardt, F. 2015, MNRAS, 454, 3641, doi: 10.1093/mnras/stv2247
-
[28]
2019, MNRAS, 488, L6, doi: 10.1093/mnrasl/slz085
Fraser-McKelvie, A., Merrifield, M., Arag´ on-Salamanca, A., et al. 2019, MNRAS, 488, L6, doi: 10.1093/mnrasl/slz085
-
[29]
2020, MNRAS, 499, 1116, doi: 10.1093/mnras/staa2866
Fraser-McKelvie, A., Merrifield, M., Arag´ on-Salamanca, A., et al. 2020, MNRAS, 499, 1116, doi: 10.1093/mnras/staa2866
-
[30]
Fritz, J., Franceschini, A., & Hatziminaoglou, E. 2006, MNRAS, 366, 767, doi: 10.1111/j.1365-2966.2006.09866.x
-
[31]
Gadotti, D. A. 2011, MNRAS, 415, 3308, doi: 10.1111/j.1365-2966.2011.18945.x
-
[32]
Galloway, M. A., Willett, K. W., Fortson, L. F., et al. 2015, MNRAS, 448, 3442, doi: 10.1093/mnras/stv235
-
[33]
title The most luminous, merger-free AGNs show only marginal correlation with bar presence
Garland, I. L., Fahey, M. J., Simmons, B. D., et al. 2023, MNRAS, 522, 211, doi: 10.1093/mnras/stad966
-
[34]
Garland, I. L., Walmsley, M., Silcock, M. S., et al. 2024, MNRAS, 532, 2320, doi: 10.1093/mnras/stae1620
-
[35]
2021, A&A, 651, A107, doi: 10.1051/0004-6361/202140697 G´ eron, T., Smethurst, R
George, K., & Subramanian, S. 2021, A&A, 651, A107, doi: 10.1051/0004-6361/202140697 G´ eron, T., Smethurst, R. J., Lintott, C., et al. 2021, MNRAS, 507, 4389, doi: 10.1093/mnras/stab2064 G´ eron, T., Smethurst, R. J., Lintott, C., et al. 2024, ApJ, 973, 129, doi: 10.3847/1538-4357/ad66b7 G´ eron, T., Smethurst, R. J., Lintott, C., et al. 2023, MNRAS, 521...
-
[36]
Goulding, A. D., Matthaey, E., Greene, J. E., et al. 2017, ApJ, 843, 135, doi: 10.3847/1538-4357/aa755b
-
[37]
2025, ApJ, 985, 181, doi: 10.3847/1538-4357/adc8a7
Guo, Y., Jogee, S., Wise, E., et al. 2025, ApJ, 985, 181, doi: 10.3847/1538-4357/adc8a7
-
[38]
title Present- Day Growth of Black Holes and Bulges : The Sloan Digital Sky Survey Perspective
Heckman, T. M., Kauffmann, G., Brinchmann, J., et al. 2004, ApJ, 613, 109, doi: 10.1086/422872
-
[39]
Hviding, R. E., Hainline, K. N., Rieke, M., et al. 2022, AJ, 163, 224, doi: 10.3847/1538-3881/ac5e33
-
[40]
Inoue, A. K. 2011, MNRAS, 415, 2920, doi: 10.1111/j.1365-2966.2011.18906.x Ivezi´ c,ˇZ., Kahn, S. M., Tyson, J. A., et al. 2019, ApJ, 873, 111, doi: 10.3847/1538-4357/ab042c 24
-
[41]
Jarrett, T. H., Cohen, M., Masci, F., et al. 2011, ApJ, 735, 112, doi: 10.1088/0004-637X/735/2/112
-
[42]
Juneau, S., Bournaud, F., Charlot, S., et al. 2014, ApJ, 788, 88, doi: 10.1088/0004-637X/788/1/88
-
[43]
Kauffmann, G., Heckman, T. M., Tremonti, C., et al. 2003, MNRAS, 346, 1055, doi: 10.1111/j.1365-2966.2003.07154.x
-
[44]
Theoretical Modeling of Starburst Galaxies
Kewley, L. J., Dopita, M. A., Sutherland, R. S., Heisler, C. A., & Trevena, J. 2001, ApJ, 556, 121, doi: 10.1086/321545
-
[45]
Kewley, L. J., Groves, B., Kauffmann, G., & Heckman, T. 2006, MNRAS, 372, 961, doi: 10.1111/j.1365-2966.2006.10859.x
-
[46]
Kim, M., Choi, Y.-Y., & Kim, S. S. 2020, MNRAS, 494, 5839, doi: 10.1093/mnras/staa1035
-
[47]
title A Subarcsecond Resolution Near-Infrared Study of Seyfert and ``Normal'' Galaxies
Knapen, J. H., Shlosman, I., & Peletier, R. F. 2000, ApJ, 529, 93, doi: 10.1086/308266
-
[48]
Seven-Year Wilkinson Microwave Anisotropy Probe (WMAP) Observations: Cosmological Interpretation
Komatsu, E., Smith, K. M., Dunkley, J., et al. 2011, ApJS, 192, 18, doi: 10.1088/0067-0049/192/2/18
-
[49]
Kormendy, J., & Kennicutt, Jr., R. C. 2004, ARA&A, 42, 603, doi: 10.1146/annurev.astro.42.053102.134024
-
[50]
2012, ApJ, 757, 60, doi: 10.1088/0004-637X/757/1/60
Kraljic, K., Bournaud, F., & Martig, M. 2012, ApJ, 757, 60, doi: 10.1088/0004-637X/757/1/60 La Marca, A., Nardone, M. T., Wang, L., et al. 2026, A&A, 707, A152, doi: 10.1051/0004-6361/202556236
-
[51]
title Nested and Single Bars in Seyfert and Non-Seyfert Galaxies
Laine, S., Shlosman, I., Knapen, J. H., & Peletier, R. F. 2002, ApJ, 567, 97, doi: 10.1086/323964
-
[52]
2010, A&A, 509, A53, doi: 10.1051/0004-6361/200913168
Lamareille, F. 2010, A&A, 509, A53, doi: 10.1051/0004-6361/200913168
-
[53]
R., Nelemans, G., & Steeghs, D
Maddox, S. 2004, MNRAS, 350, 396, doi: 10.1111/j.1365-2966.2004.07697.x
-
[54]
2017, MNRAS, 467, 540, doi: 10.1093/mnras/stx055
Lamperti, I., Koss, M., Trakhtenbrot, B., et al. 2017, MNRAS, 467, 540, doi: 10.1093/mnras/stx055
-
[55]
W., & Mykytyn, D
Lang, D., Hogg, D. W., & Mykytyn, D. 2016, The Tractor: Probabilistic astronomical source detection and measurement,, Astrophysics Source Code Library, record ascl:1604.008 http://ascl.net/1604.008
2016
-
[56]
Laurikainen, E., & Salo, H. 2002, MNRAS, 337, 1118, doi: 10.1046/j.1365-8711.2002.06008.x Le Conte, Z. A., Gadotti, D. A., Ferreira, L., et al. 2024, MNRAS, 530, 1984, doi: 10.1093/mnras/stae921
-
[57]
DO BARS TRIGGER ACTIVITY IN GALACTIC NUCLEI?
Lee, G.-H., Woo, J.-H., Lee, M. G., et al. 2012, ApJ, 750, 141, doi: 10.1088/0004-637X/750/2/141
-
[58]
Li, Z., Du, M., Debattista, V. P., et al. 2023, ApJ, 958, 77, doi: 10.3847/1538-4357/acffb3
-
[59]
Li, Z.-Y., Ho, L. C., Barth, A. J., & Peng, C. Y. 2011, ApJS, 197, 22, doi: 10.1088/0067-0049/197/2/22
-
[60]
2020, MNRAS, 499, 1406, doi: 10.1093/mnras/staa2913
Lin, L., Li, C., Du, C., et al. 2020, MNRAS, 499, 1406, doi: 10.1093/mnras/staa2913
-
[61]
title Hydrodynamical Simulations of the Barred Spiral Galaxy NGC 1097
Lin, L.-H., Wang, H.-H., Hsieh, P.-Y., et al. 2013, ApJ, 771, 8, doi: 10.1088/0004-637X/771/1/8
-
[62]
2023, ApJ, 943, 7, doi: 10.3847/1538-4357/aca664 Ma lek, K., Buat, V., Roehlly, Y., et al
Maeda, F., Egusa, F., Ohta, K., Fujimoto, Y., & Habe, A. 2023, ApJ, 943, 7, doi: 10.3847/1538-4357/aca664 Ma lek, K., Buat, V., Roehlly, Y., et al. 2018, A&A, 620, A50, doi: 10.1051/0004-6361/201833131
-
[63]
2025, A&A, 699, A204, doi: 10.1051/0004-6361/202554961
Marels, V., Mesa, V., Jaque Arancibia, M., et al. 2025, A&A, 699, A204, doi: 10.1051/0004-6361/202554961
-
[64]
Marino, R. A., Rosales-Ortega, F. F., S´ anchez, S. F., et al. 2013, A&A, 559, A114, doi: 10.1051/0004-6361/201321956
-
[65]
1997, A&A, 323, 363, doi: 10.48550/arXiv.astro-ph/9701091
Martinet, L., & Friedli, D. 1997, A&A, 323, 363, doi: 10.48550/arXiv.astro-ph/9701091
work page internal anchor Pith review doi:10.48550/arxiv.astro-ph/9701091 1997
-
[66]
Massey, F. J. 1951, Journal of the American Statistical Association, 46, 68
1951
-
[67]
Masters, K. L., Nichol, R. C., Haynes, M. P., et al. 2012, MNRAS, 424, 2180, doi: 10.1111/j.1365-2966.2012.21377.x
-
[68]
Mateos, S., Alonso-Herrero, A., Carrera, F. J., et al. 2012, MNRAS, 426, 3271, doi: 10.1111/j.1365-2966.2012.21843.x Men´ endez-Delmestre, K., Sheth, K., Schinnerer, E., Jarrett, T. H., & Scoville, N. Z. 2007, ApJ, 657, 790, doi: 10.1086/511025
-
[69]
2021, A&A, 646, A29, doi: 10.1051/0004-6361/202039401
Mountrichas, G., Buat, V., Yang, G., et al. 2021, A&A, 646, A29, doi: 10.1051/0004-6361/202039401
-
[70]
2023, FastSpecFit: Fast spectral synthesis and emission-line fitting of DESI spectra,, Astrophysics Source Code Library, record ascl:2308.005 http://ascl.net/2308.005
Khederlarian, A. 2023, FastSpecFit: Fast spectral synthesis and emission-line fitting of DESI spectra,, Astrophysics Source Code Library, record ascl:2308.005 http://ascl.net/2308.005
2023
-
[71]
Mukundan, K., Nair, P., Masters, K. L., et al. 2025, MNRAS, 542, 151, doi: 10.1093/mnras/staf1143
-
[72]
Myers, A. D., Moustakas, J., Bailey, S., et al. 2023, AJ, 165, 50, doi: 10.3847/1538-3881/aca5f9
-
[73]
Nair, P. B., & Abraham, R. G. 2010, ApJS, 186, 427, doi: 10.1088/0067-0049/186/2/427
-
[74]
Oh, S., Oh, K., & Yi, S. K. 2012, ApJS, 198, 4, doi: 10.1088/0067-0049/198/1/4
-
[75]
Pettini, M., & Pagel, B. E. J. 2004, MNRAS, 348, L59, doi: 10.1111/j.1365-2966.2004.07591.x
-
[76]
2025, ApJ, 982, 10, doi: 10.3847/1538-4357/adb1dd
Pucha, R., Juneau, S., Dey, A., et al. 2025, ApJ, 982, 10, doi: 10.3847/1538-4357/adb1dd
-
[77]
2022, MNRAS, 512, 5339, doi: 10.1093/mnras/stac816
Rosas-Guevara, Y., Bonoli, S., Dotti, M., et al. 2022, MNRAS, 512, 5339, doi: 10.1093/mnras/stac816
-
[78]
K., Ishizuki, S., & Scoville, N
Sakamoto, K., Okumura, S. K., Ishizuki, S., & Scoville, N. Z. 1999, ApJ, 525, 691, doi: 10.1086/307910
-
[79]
Salim, S., Boquien, M., & Lee, J. C. 2018, ApJ, 859, 11, doi: 10.3847/1538-4357/aabf3c 25
-
[80]
Schawinski, K., Thomas, D., Sarzi, M., et al. 2007, MNRAS, 382, 1415, doi: 10.1111/j.1365-2966.2007.12487.x
discussion (0)
Sign in with ORCID, Apple, or X to comment. Anyone can read and Pith papers without signing in.