Recognition: unknown
Band-Selective LDOS Engineering of Yb/Er Upconversion: an Electromagnetic-Kinetic Diagnostic Framework
Pith reviewed 2026-05-08 15:44 UTC · model grok-4.3
The pith
A plasmonic grating with upconversion nanoparticles modulates red emission decay rates by ±15% through LDOS engineering at 670 nm while green rates stay fixed.
A machine-rendered reading of the paper's core claim, the machinery that carries it, and where it could break.
Core claim
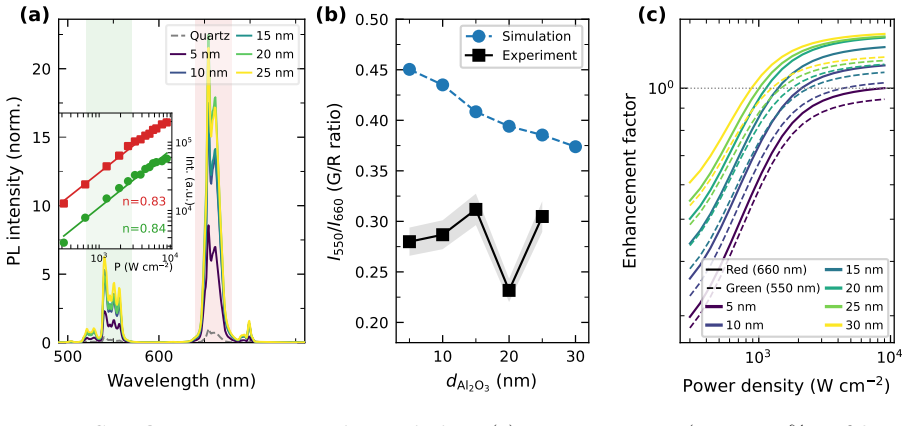
A corrugated SU8/Au/Al2O3 grating coated with a dense NaYF4:Yb(20%),Er(5%) upconversion nanoparticle monolayer realises a band-selective platform: a broad plasmonic resonance near 670 nm aligned with the red 4F9/2 -> 4I15/2 Er3+ transition modulates the red decay rate by +/-15% as a function of the Al2O3 spacer thickness d, while the green 2H11/2 / 4S3/2 -> 4I15/2 transition is experimentally invariant (|k/k_ref - 1| < 1% across all d).
What carries the argument
The corrugated grating with tunable Al2O3 spacer thickness, using full-wave FDTD to compute orientation-averaged Purcell factors and pump enhancement together with a six-level Yb/Er rate-equation model that separates radiative, intrinsic non-radiative, and environment-induced non-radiative channels.
If this is right
- Red upconversion emission intensity can be tuned by spacer thickness independently of the green emission.
- The green-to-red intensity ratio decreases monotonically with increasing spacer thickness.
- The electromagnetic-kinetic framework isolates unmodeled effects such as grain-boundary damping or additional non-radiative channels at 550 nm.
- Pump suppression below the free-space reference ensures observed changes reflect emission LDOS rather than excitation changes.
Where Pith is reading between the lines
- Similar grating designs could achieve selective control over other rare-earth emission bands by aligning plasmon resonances to specific transitions.
- Incorporating grain-boundary scattering losses into the gold layer model would likely resolve the remaining experimental-model mismatch at d=15 nm.
- The band-selective approach may extend to devices that require independent modulation of multiple upconversion colors for imaging or sensing.
Load-bearing premise
The six-level rate-equation model plus half-ellipse FDTD geometry fully captures all relevant radiative and non-radiative channels.
What would settle it
Measuring the red-band decay rate versus spacer thickness and checking whether the non-monotonic dip at d=15 nm appears or the trend remains strictly monotonic as the model predicts.
Figures


read the original abstract
A central challenge in plasmonic upconversion is coupling between near-field engineering at the pump wavelength and local-density-of-optical-states (LDOS) engineering at the emission wavelengths. Here we show that a corrugated SU8/Au/Al2O3 grating coated with a dense NaYF4:Yb(20%),Er(5%) upconversion nanoparticle (UCNP) monolayer realises a band-selective platform: a broad plasmonic resonance near 670 nm aligned with the red 4F9/2 -> 4I15/2 Er3+ transition modulates the red decay rate by +/-15% as a function of the Al2O3 spacer thickness d, while the green 2H11/2 / 4S3/2 -> 4I15/2 transition is experimentally invariant (|k/k_ref - 1| < 1% across all d). The pump field at 980 nm is monotonically suppressed below the free-space reference (<f_exc> from 0.27 to 0.48 between d = 5 and 25 nm), so observables cleanly probe the emission-side LDOS without pump-side interference. We rationalise these results with a coupled electromagnetic-kinetic framework combining full-wave FDTD pump enhancement and orientation-averaged Purcell factors with a six-level Yb/Er rate-equation model separating radiative, intrinsic nonradiative and environment-induced nonradiative channels. The framework reproduces the 670 nm extinction resonance, the +/-10-15% red-band decay-rate modulation, and the monotonic decrease of the green/red ratio with d, but predicts a monotonic red-band trend that misses the experimental dip at d = 15 nm and over-predicts a green-band reduction (k/k_ref^550 approx. 0.73 vs. 1.00). Ridge-tip smoothing (h_round in {0, 5, 10} nm) shifts Purcell factors by only 1-3%, ruling out apex shape as the dominant cause. The framework thus serves as a diagnostic tool, isolating the green-band discrepancy as needing corrections beyond the half-ellipse model - likely grain-boundary damping in the evaporated gold or extra non-radiative channels at 550 nm not in the six-level kinetic model.
Editorial analysis
A structured set of objections, weighed in public.
Referee Report
Summary. The manuscript reports experimental realization of band-selective LDOS engineering in a corrugated SU8/Au/Al2O3 grating coated with a dense NaYF4:Yb(20%),Er(5%) UCNP monolayer. Varying the Al2O3 spacer thickness d modulates the red (670 nm, 4F9/2 -> 4I15/2) decay rate by +/-15% while the green (550 nm, 2H11/2/4S3/2 -> 4I15/2) decay rate remains invariant (|k/k_ref - 1| < 1% across d values). Pump enhancement at 980 nm is suppressed (f_exc 0.27-0.48), isolating emission-side LDOS. A forward FDTD (Purcell factors, half-ellipse geometry) plus six-level Yb/Er rate-equation model reproduces the 670 nm resonance and red modulation trend plus green/red ratio decrease with d, but misses the experimental red dip at d=15 nm and over-predicts green suppression (0.73 vs. 1.00). Ridge smoothing tests rule out apex shape as cause; mismatches are attributed to unmodeled effects like grain-boundary damping.
Significance. If the reported decay-rate measurements hold, the work establishes a practical, spacer-tunable platform for selective emission-band control in upconverters without pump interference, with direct relevance to bioimaging, displays, and photovoltaics. The electromagnetic-kinetic diagnostic framework is a strength, as it is used forward (not fitted) to isolate specific model gaps rather than circularly defining the observables. The independent experimental decay-rate data versus d provides a falsifiable test of LDOS engineering.
minor comments (2)
- [modeling and results discussion] The abstract and modeling discussion note that the framework 'reproduces the +/-10-15% red-band decay-rate modulation' yet 'predicts a monotonic red-band trend that misses the experimental dip at d=15 nm'. Clarify in the results section whether the d=15 nm point lies within experimental uncertainty or requires explicit additional non-radiative channels in the six-level kinetics.
- [experimental results] The green-band invariance is reported as |k/k_ref - 1| < 1%, but the model yields ~0.73. Add a short paragraph quantifying the experimental standard deviation across the d series to allow readers to assess how strongly the data rule out even small LDOS effects at 550 nm.
Simulated Author's Rebuttal
We thank the referee for the positive assessment of our manuscript, the accurate summary of our experimental and modeling results, and the recommendation for minor revision. We appreciate the recognition of the band-selective LDOS platform and the diagnostic utility of the forward electromagnetic-kinetic framework.
Circularity Check
No significant circularity: experimental band-selectivity carried by independent decay-rate measurements
full rationale
The derivation chain begins with direct experimental measurements of time-resolved decay rates versus Al2O3 spacer thickness d for the red (670 nm) and green (550 nm) Er3+ transitions on the corrugated grating. These data establish the +/-15% red modulation and green invariance (|k/k_ref - 1| < 1%). The six-level Yb/Er rate-equation model receives orientation-averaged Purcell factors from half-ellipse FDTD simulations as forward inputs; it reproduces the resonance position and red trend direction but is not fitted to enforce the reported modulations or ratios. Discrepancies (d=15 nm dip, green over-prediction) are isolated as unmodeled effects (grain-boundary damping, extra non-radiative channels) rather than used to redefine observables. No self-definitional loops, fitted-input predictions, or load-bearing self-citations appear in the chain; the platform claim remains falsifiable by the raw decay-rate data.
Axiom & Free-Parameter Ledger
axioms (2)
- domain assumption The six-level Yb/Er rate-equation model separates radiative, intrinsic non-radiative, and environment-induced non-radiative channels without additional hidden states at 550 nm.
- domain assumption Full-wave FDTD with half-ellipse ridge geometry plus orientation-averaged Purcell factors accurately represents the LDOS at 550 nm and 670 nm.
Reference graph
Works this paper leans on
-
[1]
Fischer, A
S. Fischer, A. Kleefisch, J. C. Goldschmidt, B. Herter, W. G. J. H. M. v. Sark, T. Trupke, and P. Würfel, Journal of Applied Physics110, 013109 (2011)
2011
-
[2]
Torres Vera, A
V. Torres Vera, A. González-Tudela, O. G. Calderón, and S. Melle, Journal of Materials Chemistry C9, 1200 (2021)
2021
-
[3]
F. Wang, Y. Han, C. S. Lim, Y. Lu, J. Wang, J. Xu, H. Chen, C. Zhang, M. Hong, and X. Liu, Nature463, 1061 (2010). 28
2010
-
[4]
B. Zhou, B. Shi, D. Jin, and X. Liu, Nature Nanotechnology10, 924 (2015)
2015
-
[5]
Y. Wu, J. Xu, E. T. Poh, L. Liang, H. Liu, J. K. W. Yang, C.-W. Qiu, R. A. L. Vallée, and X. Liu, Nature Nanotechnology14, 1110 (2019)
2019
-
[6]
J. Xu, Z. Dong, M. Asbahi, Y. Wu, H. Wang, L. Liang, R. J. H. Ng, H. Liu, R. A. L. Vallée, J. K. W. Yang, and X. Liu, Nano Letters21, 3044 (2021)
2021
-
[7]
Gnach, T
A. Gnach, T. Lipinski, A. Bednarkiewicz, J. Rybka, and J. A. Capobianco, Chemical Society Reviews44, 1561 (2015)
2015
-
[8]
J. C. Goldschmidt and S. Fischer, Advanced Optical Materials3, 510 (2015)
2015
-
[9]
Y.Xie, Y.Song, G.Sun, P.Hu, A.Bednarkiewicz,andL.Sun,Light: Science&Applications 11, 150 (2022)
2022
-
[10]
Anger, P
P. Anger, P. Bharadwaj, and L. Novotny, Physical Review Letters96, 113002 (2006)
2006
-
[11]
Novotny and B
L. Novotny and B. Hecht,Principles of Nano-Optics, 2nd ed. (Cambridge University Press, 2012)
2012
-
[12]
Esteban, M
R. Esteban, M. Laroche, and J.-J. Greffet, Journal of Applied Physics103, 033107 (2008)
2008
-
[13]
Herter, S
B. Herter, S. Fischer, S. Luderer, J. Gutmann, and J. C. Goldschmidt, Optics Express21, A883 (2013)
2013
-
[14]
Hofmann, B
C. Hofmann, B. Herter, J. C. Goldschmidt, and S. Fischer, Optics Express24, A1288 (2016)
2016
-
[15]
Hofmann, T
C. Hofmann, T. Schmidt, J. C. Goldschmidt, and S. Fischer, Nature Communications12, 7166 (2021)
2021
-
[16]
Fischer, F
S. Fischer, F. Hallermann, T. Trupke, H. Zappe, and J. C. Goldschmidt, Optics Express19, A882 (2011)
2011
-
[17]
Fischer, G
S. Fischer, G. Steinmeyer, P. Würfel, and J. C. Goldschmidt, Optics Express24, A146 (2016)
2016
-
[18]
Schietinger, T
S. Schietinger, T. Aichele, H.-Q. Wang, T. Nann, and O. Benson, Nano Letters10, 134 (2010)
2010
-
[19]
Liu and D
X. Liu and D. Y. Lei, Scientific Reports5, 15235 (2015)
2015
-
[20]
J. Xu, H. Liu, H. Wang, Y. Wu, H. Wang, B. Y. H. Tan, J. K. W. Yang, R. A. L. Vallée, and X. Liu, Chem10, 1 (2024)
2024
-
[21]
H. Chen, Z. Jiang, H. Hu, B. Kang, B. Zhang, X. Mi, L. Guo, C. Zhang, J. Li, J. Lu,et al., Nature Photonics16, 651 (2022)
2022
-
[22]
D. H. Le, M. Kreivi, S. M. Aikio, N. Heinilehto, T. Sipola, J. Petäjä, T.-L. Guo, M. Roussey, and J. Hiltunen, Nanophotonics13, 3655 (2024)
2024
-
[23]
W. Park, D. Lu, and S. Ahn, Chemical Society Reviews44, 2940 (2015)
2015
-
[24]
S. Wu, G. Han, D. J. Milliron, S. Aloni, V. Altoe, D. V. Talapin, B. E. Cohen, and P. J. Schuck, Proceedings of the National Academy of Sciences USA106, 10917 (2009)
2009
-
[25]
flexcompute.com/tidy3d/(2024), accessed 2024
Flexcompute Inc., Tidy3D electromagnetic simulation software, v2.10,https://www. flexcompute.com/tidy3d/(2024), accessed 2024. 29
2024
-
[26]
P. B. Johnson and R. W. Christy, Physical Review B6, 4370 (1972)
1972
-
[27]
L. E. Mackenzie, A. Brewer, R. Blick, and I. Bhattacharya, Chemistry of Materials34, 3356 (2022)
2022
-
[28]
Taflove and S
A. Taflove and S. C. Hagness,Computational Electrodynamics: The Finite-Difference Time- Domain Method, 3rd ed. (Artech House, 2005). 30
2005
discussion (0)
Sign in with ORCID, Apple, or X to comment. Anyone can read and Pith papers without signing in.