Recognition: unknown
Gated Multimodal Learning for Interpretable Property Energy Performance Prediction and Retrofit Scenario Analysis
Pith reviewed 2026-05-08 16:19 UTC · model grok-4.3
The pith
A gated multimodal model predicts building energy efficiency scores more accurately by learning property-specific weights for tabular data, assessor text, and spatial features.
A machine-rendered reading of the paper's core claim, the machinery that carries it, and where it could break.
Core claim
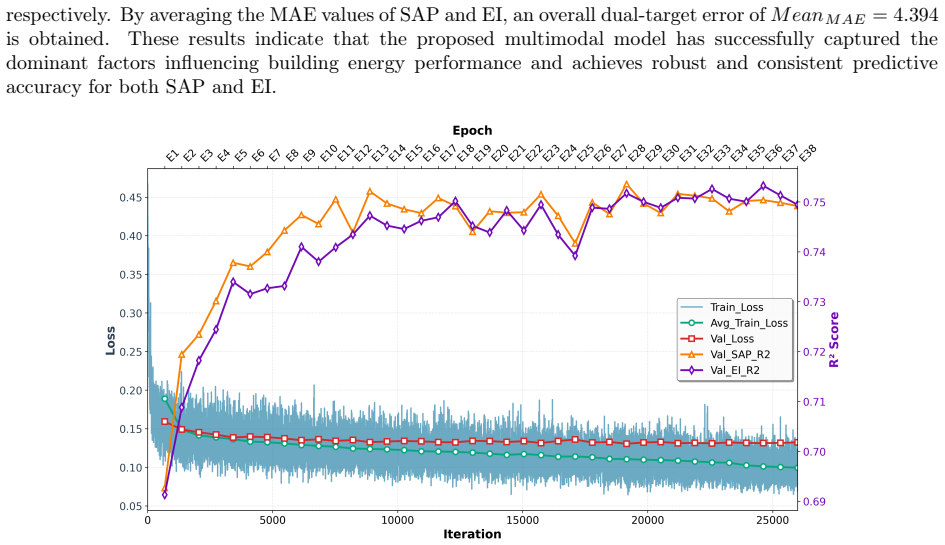
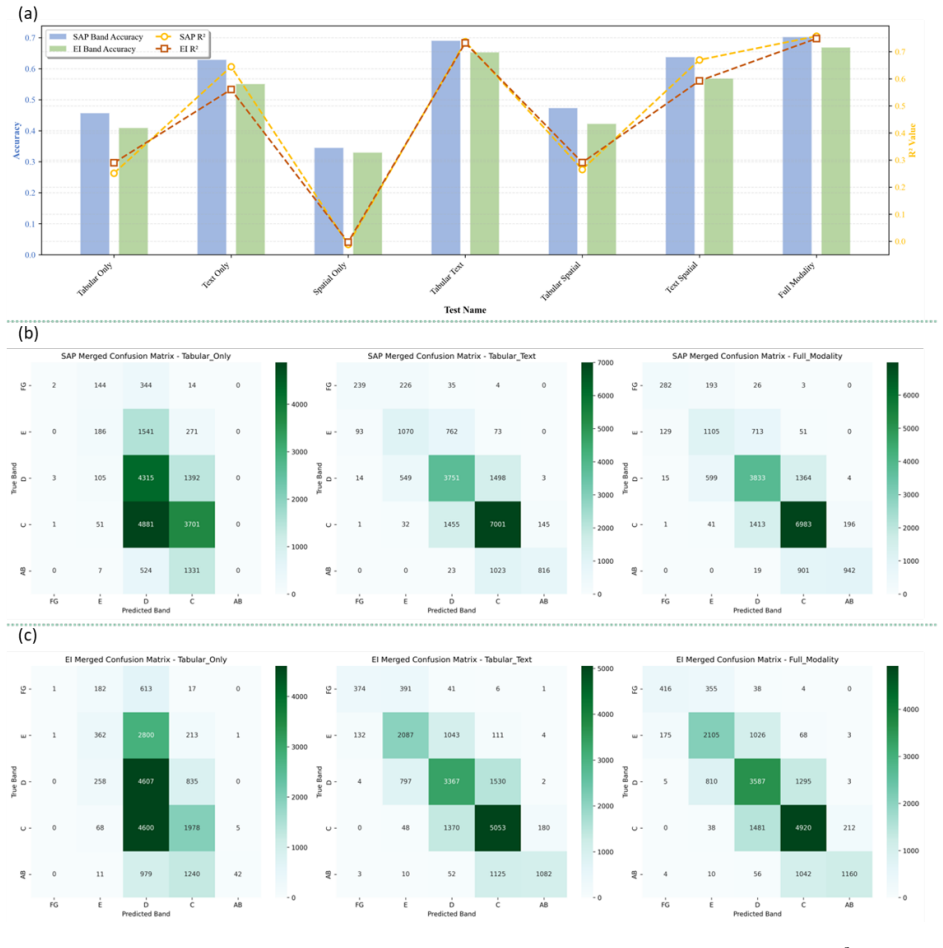
The gated multimodal network that learns per-property weights over EPC tabular fields, assessor free text, and GIS-derived geometry achieves mean absolute errors of 4.03 on SAP scores and 4.76 on EI scores with R-squared values of 0.757 and 0.748; full fusion of all three modalities outperforms any unimodal or bimodal ablation, while the auxiliary band-classification head stabilizes regression training.
What carries the argument
Sample-wise gating mechanism that produces a set of modality weights for each individual property, allowing the model to emphasize text, tables, or spatial features differently depending on the building.
If this is right
- City-scale energy assessments become feasible using existing certificate databases and public maps instead of new physical inspections.
- Gating weights, SHAP values, text occlusion scores, and spatial attribution maps together indicate which building attributes most influence each predicted score.
- Scenario runs for wall, roof, and glazing upgrades produce concrete estimates of resulting changes in annual energy cost and equivalent CO2 emissions.
- The auxiliary band-classification objective improves the numerical stability of the continuous score predictions.
Where Pith is reading between the lines
- The same gating approach could be retrained on data from other regions provided the input fields remain comparable in format and coverage.
- The per-property explanations might be used to rank buildings by retrofit urgency before sending inspectors.
- Linking the model to metered consumption records could supply an additional supervision signal if such data are obtained.
Load-bearing premise
The patterns learned from one London borough will hold for buildings elsewhere and the post-hoc attribution methods will correctly identify the features that actually drive the true energy performance.
What would settle it
Train the model on the Westminster data and then evaluate its mean absolute error and feature-ranking stability on a fresh set of EPC records and GIS maps from a different UK city or borough.
Figures


read the original abstract
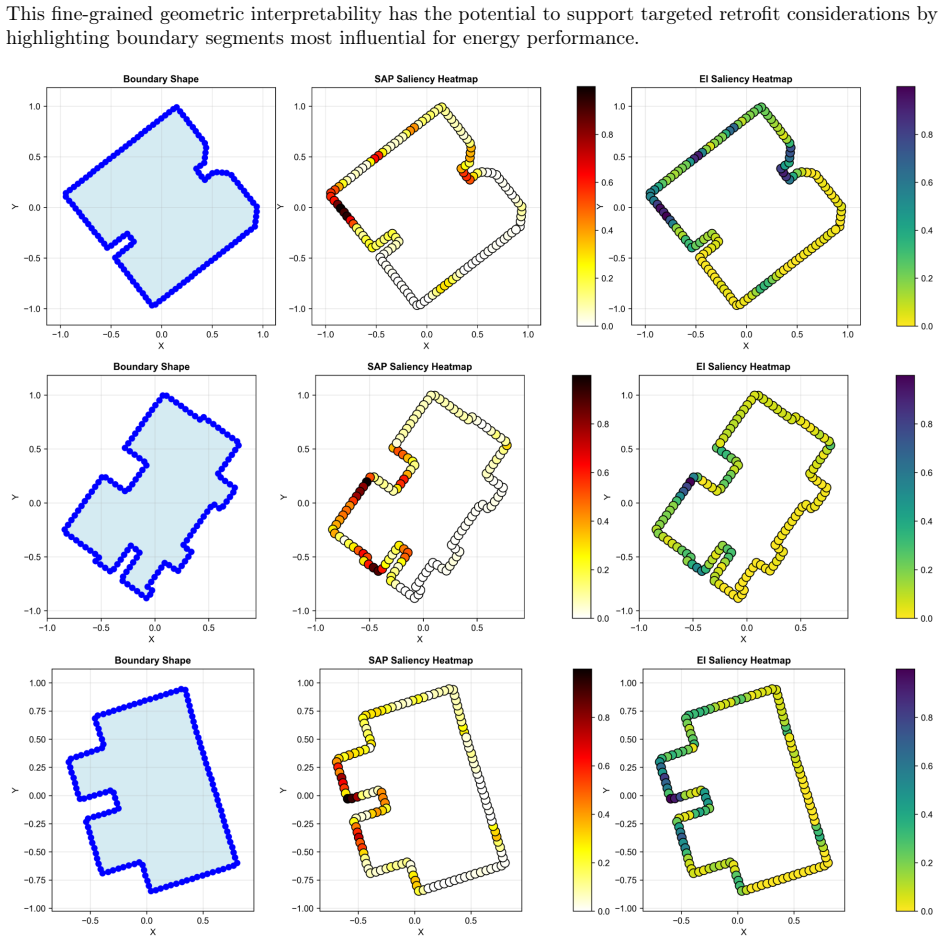
Achieving resilient and sustainable cities requires scalable approaches to decarbonising residential buildings, which account for about 20% of UK greenhouse gas emissions and 25% of energy-related emissions in the European Union. Energy Performance Certificates (EPCs) support regulation and retrofit planning, but their reliance on on-site inspections limits timely city-scale assessment. This study introduces a gated multimodal model to predict Standard Assessment Procedure (SAP) energy efficiency and Environmental Impact (EI) scores by integrating EPC tabular variables, assessor-written free text, and Geographic Information System (GIS)-derived spatial features describing footprint geometry, height, area, and orientation. Sample-wise gating learns property-specific modality weights, while an auxiliary band classification head stabilises training. In a Westminster, London case study, the model predicts SAP and EI scores with MAEs of 4.03 and 4.76 points and R2 values of 0.757 and 0.748, respectively, achieving a mean MAE of 4.39. Ablation results show that full multimodal fusion outperforms unimodal and bimodal baselines for both score prediction and band-level classification. Interpretability analyses provide decision-relevant evidence: gating weights indicate strong reliance on assessor text; SHAP highlights main fuel, built form, and construction age band; text occlusion prioritises roof and wall fields; and spatial attribution is dominated by height and footprint area, with sensitivity to footprint shape. The validated framework is further applied to retrofit scenarios for wall insulation, roof insulation, and window glazing upgrades, indicating projected improvements in SAP, EI, annual energy cost, and equivalent CO2 emissions. Overall, the framework provides scalable property-level evidence for retrofit screening, intervention prioritisation, and net-zero housing transitions.
Editorial analysis
A structured set of objections, weighed in public.
Referee Report
Summary. The manuscript introduces a gated multimodal neural network that integrates EPC tabular features, assessor free-text descriptions, and GIS-derived spatial attributes (footprint geometry, height, area, orientation) to predict SAP energy efficiency and EI scores. On a Westminster, London dataset it reports MAEs of 4.03 (SAP) and 4.76 (EI) with R² values 0.757 and 0.748, shows full multimodal fusion outperforming unimodal/bimodal baselines in both regression and band classification, supplies interpretability via sample-wise gating weights, SHAP, text occlusion and spatial attribution, and demonstrates the model on retrofit scenarios for wall/roof insulation and window upgrades.
Significance. If the reported performance and interpretability results prove robust, the work supplies a practical, scalable route to city-scale energy-performance screening that bypasses on-site inspections, directly supporting retrofit prioritisation and net-zero planning. Concrete numerical results, systematic ablations, and multiple post-hoc interpretability techniques constitute clear strengths; the retrofit scenario analysis further illustrates decision-relevant utility.
major comments (2)
- [§4 and §5] §4 (Experimental Setup) and §5 (Results): the central performance claims (MAE 4.03/4.76, R² 0.757/0.748, ablation superiority) and the interpretability conclusions rest on a single Westminster dataset with no cross-regional, temporal, or multi-city hold-out evaluation. Because EPC tabular, textual and spatial features exhibit well-documented regional biases in assessor practice and building stock, the absence of such testing leaves open whether the multimodal gains and feature attributions generalise or are dataset-specific correlations.
- [§4.2] §4.2 (Data and Preprocessing): no information is provided on train/validation/test splits, cross-validation procedure, handling of missing values, or statistical error bars on the reported MAEs and R² values. Without these details it is impossible to determine whether the ablation improvements are statistically reliable or sensitive to post-hoc partitioning choices.
minor comments (2)
- [Abstract] The abstract states a 'mean MAE of 4.39' without clarifying whether this is a simple average of the two task MAEs or a weighted combination; a brief clarification would aid reproducibility.
- [§3.2] Notation for the gating weights and auxiliary loss coefficients is introduced without an explicit equation reference; adding a numbered equation for the combined loss would improve clarity.
Simulated Author's Rebuttal
We thank the referee for the constructive and detailed review. The comments highlight important aspects of experimental rigor and generalizability that we address point by point below. Where revisions are feasible, we have updated the manuscript; we also note limitations that cannot be fully resolved without additional data.
read point-by-point responses
-
Referee: [§4 and §5] §4 (Experimental Setup) and §5 (Results): the central performance claims (MAE 4.03/4.76, R² 0.757/0.748, ablation superiority) and the interpretability conclusions rest on a single Westminster dataset with no cross-regional, temporal, or multi-city hold-out evaluation. Because EPC tabular, textual and spatial features exhibit well-documented regional biases in assessor practice and building stock, the absence of such testing leaves open whether the multimodal gains and feature attributions generalise or are dataset-specific correlations.
Authors: We agree that reliance on a single-city dataset (Westminster, London) limits strong claims of broad generalizability, particularly given known regional variations in EPC assessor practices and building stock characteristics. The current work is presented as a detailed case study demonstrating the gated multimodal approach on a rich, high-quality multimodal dataset. In the revised manuscript we have added an expanded Limitations and Future Work section that explicitly discusses potential regional biases, the role of interpretability methods (gating weights, SHAP, text occlusion, spatial attribution) in surfacing dataset-specific drivers, and concrete plans for multi-city and temporal validation using additional UK EPC releases. We cannot, however, perform new cross-regional experiments in this revision as we do not have access to equivalent multimodal EPC-GIS-text datasets from other regions. revision: partial
-
Referee: [§4.2] §4.2 (Data and Preprocessing): no information is provided on train/validation/test splits, cross-validation procedure, handling of missing values, or statistical error bars on the reported MAEs and R² values. Without these details it is impossible to determine whether the ablation improvements are statistically reliable or sensitive to post-hoc partitioning choices.
Authors: We thank the referee for identifying this reporting gap. The original experiments employed an 80/10/10 stratified train/validation/test split (stratified by SAP and EI bands) and handled missing tabular values via median imputation for numeric features and mode imputation for categorical features. To improve transparency and statistical reliability, the revised §4 now details the split procedure, confirms the use of 5-fold cross-validation for all ablation studies, and reports mean ± standard deviation for all key metrics (e.g., SAP MAE 4.03 ± 0.15, R² 0.757 ± 0.012). These additions demonstrate that the multimodal performance gains remain consistent across folds. revision: yes
- Empirical cross-regional or multi-city hold-out evaluation, as no additional comparable multimodal EPC datasets from other regions are currently available to the authors.
Circularity Check
No circularity: empirical ML predictions on held-out data
full rationale
The paper trains a gated multimodal network on EPC tabular/text/spatial features and reports MAEs (4.03/4.76), R2 values (~0.75), and ablation gains as direct empirical outputs on held-out Westminster data. No equations, self-definitional relations, or load-bearing self-citations reduce these scores to fitted constants or tautologies by construction. The architecture, auxiliary band head, and post-hoc interpretability (SHAP, occlusion, attribution) are defined independently of the target metrics; results remain falsifiable against external benchmarks.
Axiom & Free-Parameter Ledger
axioms (1)
- domain assumption The three data modalities (tabular EPC, assessor text, GIS spatial) are independent enough that their fusion yields additive gains.
Reference graph
Works this paper leans on
-
[1]
Y. Chen, Z. Ren, Z. Peng, J. Yang, Z. Chen, Z. Deng, Impacts of climate change and building energy efficiency improvement on city-scale building energy consumption, Journal of Building Engineering 78 (2023) 107646
2023
-
[2]
Zhong, M
X. Zhong, M. Hu, S. Deetman, B. Steubing, H. X. Lin, G. A. Hernandez, C. Harpprecht, C. Zhang, A. Tukker, P. Behrens, Global greenhouse gas emissions from residential and commercial building materials and mitigation strategies to 2060, Nature Communications 12 (1) (2021) 6126
2060
-
[3]
Y. Bai, C. Li, S. P. Jenne, S. Zhang, J. Wang, Occupant-centred thermal comfort space heating control via occupant position detection and multiphysics simulation, Building and Environment (2025) 113848
2025
-
[4]
K. Qu, X. Chen, A. Ekambaram, Y. Cui, G. Gan, A. Økland, S. Riffat, A novel holistic epc related retrofit approach for residential apartment building renovation in norway, Sustainable Cities and Society 54 (2020) 101975
2020
-
[5]
Amasyali, N
K. Amasyali, N. M. El-Gohary, A review of data-driven building energy consumption prediction studies, Renewable and Sustainable Energy Reviews 81 (2018) 1192–1205
2018
-
[6]
Beccali, G
M. Beccali, G. Ciulla, V. L. Brano, A. Galatioto, M. Bonomolo, Artificial neural network decision support tool for assessment of the energy performance and the refurbishment actions for the non- residential building stock in southern italy, Energy 137 (2017) 1201–1218
2017
-
[7]
J. Chen, J. Bai, J. Xu, F. Farazi, S. Mosbach, J. Akroyd, M. Kraft, Transforming building retrofits: Linking energy, equity, and health insights from the world avatar, Advances in Applied Energy 19 (2025) 100230
2025
-
[8]
J. Few, D. Manouseli, E. McKenna, M. Pullinger, E. Zapata-Webborn, S. Elam, D. Shipworth, T. Oreszczyn, The over-prediction of energy use by epcs in great britain: A comparison of epc-modelled and metered primary energy use intensity, Energy and Buildings 288 (2023) 113024
2023
-
[9]
U. Ali, S. Bano, M. H. Shamsi, D. Sood, C. Hoare, W. Zuo, N. Hewitt, J. O’Donnell, Urban build- ing energy performance prediction and retrofit analysis using data-driven machine learning approach, Energy and Buildings 303 (2024) 113768. 24
2024
-
[10]
BRE Group, SAP 10.2: The Government’s Standard Assessment Procedure for Energy Rating of Dwellings,https://bregroup.com/documents/d/bre-group/sap-10-2-14-03-2025, accessed: 2026- 02-01 (2025)
2025
-
[11]
U. Ali, M. H. Shamsi, M. Bohacek, C. Hoare, K. Purcell, E. Mangina, J. O’Donnell, A data-driven approach to optimize urban scale energy retrofit decisions for residential buildings, Applied Energy 267 (2020) 114861
2020
-
[12]
Wang, J.-j
L. Wang, J.-j. Peng, J.-q. Wang, A multi-criteria decision-making framework for risk ranking of energy performance contracting project under picture fuzzy environment, Journal of cleaner production 191 (2018) 105–118
2018
-
[13]
GOV.UK, A guide to energy performance certificates for the marketing, sale and let of dwellings, https://assets.publishing.service.gov.uk/media/5a821a74ed915d74e3401be1/A_guide_to_ energy_performance_certificates_for_the_marketing__sale_and_let_of_dwellings.pdf, accessed: 2026-02-02 (2017)
2026
-
[14]
Chari, S
A. Chari, S. Christodoulou, Building energy performance prediction using neural networks, Energy Efficiency 10 (5) (2017) 1315–1327
2017
-
[15]
Y. Liu, H. Chen, L. Zhang, Z. Feng, Enhancing building energy efficiency using a random forest model: A hybrid prediction approach, Energy Reports 7 (2021) 5003–5012
2021
-
[16]
Momeni, A
S. Momeni, A. Eghbalian, M. Talebzadeh, A. Paksaz, S. K. Bakhtiarvand, S. Shahabi, Enhancing office building energy efficiency: neural network-based prediction of energy consumption, Journal of Building Pathology and Rehabilitation 9 (1) (2024) 68
2024
-
[17]
Olu-Ajayi, H
R. Olu-Ajayi, H. Alaka, I. Sulaimon, F. Sunmola, S. Ajayi, Building energy consumption prediction for residential buildings using deep learning and other machine learning techniques, Journal of Building Engineering 45 (2022) 103406
2022
-
[18]
Sheng, H
Y. Sheng, H. Arbabi, W. O. Ward, M. A. Álvarez, M. Mayfield, City-scale residential energy consump- tion prediction with a multimodal approach, Scientific Reports 15 (1) (2025) 5313
2025
-
[19]
M. Sun, C. Han, Q. Nie, J. Xu, F. Zhang, Q. Zhao, Understanding building energy efficiency with administrative and emerging urban big data by deep learning in glasgow, Energy and Buildings 273 (2022) 112331
2022
-
[20]
Sheng, W
Y. Sheng, W. O. Ward, H. Arbabi, M. Álvarez, M. Mayfield, Deep multimodal learning for residential building energy prediction, in: IOP conference series: earth and environmental science, Vol. 1078, IOP Publishing, 2022, p. 012038
2022
-
[21]
Sheng, H
Y. Sheng, H. Arbabi, W. O. Ward, M. Mayfield, Learning from other cities: Transfer learning based multimodal residential energy prediction for cities with limited existing data, Energy and Buildings 338 (2025) 115723
2025
-
[22]
S. G. K. Uyar, B. K. Ozbay, B. Dal, Interpretable building energy performance prediction using xgboost quantile regression, Energy and Buildings (2025) 115815
2025
-
[23]
Y. Shen, Y. Pan, Bim-supported automatic energy performance analysis for green building design using explainable machine learning and multi-objective optimization, Applied Energy 333 (2023) 120575
2023
-
[24]
X. Li, Z. Han, G. Liu, A multimodal generative adversarial nets model for the prediction of matrix-based building performance, in: Building Simulation 2023, Vol. 18, IBPSA, 2023, pp. 1795–1802
2023
-
[25]
J. Lu, Y. Wen, et al., Multi-indicator performance prediction in residential buildings: A multimodal fusion method based on cross-attention, Building and Environment (2026) 114603. 25
2026
-
[26]
Moveh, E
S. Moveh, E. A. Merchán-Cruz, M. Abuhussain, S. Alhumaid, K. Almazam, Y. A. Dodo, Multi-building energy forecasting through weather-integrated temporal graph neural networks, Buildings 15 (5) (2025) 808
2025
-
[27]
Department for Levelling Up, Housing and Communities, Energy Performance of Buildings Data Eng- land and Wales,https://epc.opendatacommunities.org/domestic/search, accessed: 2026-02-02 (2026)
2026
-
[28]
Ordnance Survey, OS MasterMap Topography Layer,https://www.ordnancesurvey.co.uk/ products/os-mastermap-topography-layer, accessed: 2026-02-03 (2026)
2026
-
[29]
D. P. Kingma, Adam: A method for stochastic optimization, arXiv preprint arXiv:1412.6980 (2014)
work page internal anchor Pith review arXiv 2014
-
[30]
S. M. Lundberg, S.-I. Lee, A unified approach to interpreting model predictions, Advances in neural information processing systems 30 (2017). 26
2017
discussion (0)
Sign in with ORCID, Apple, or X to comment. Anyone can read and Pith papers without signing in.