Recognition: unknown
Estimator Averaging of Local Projection and VAR Impulse Responses
Pith reviewed 2026-05-08 15:23 UTC · model grok-4.3
The pith
Estimator averaging optimally combines local projections and VARs to minimize mean squared error of impulse responses at each horizon.
A machine-rendered reading of the paper's core claim, the machinery that carries it, and where it could break.
Core claim
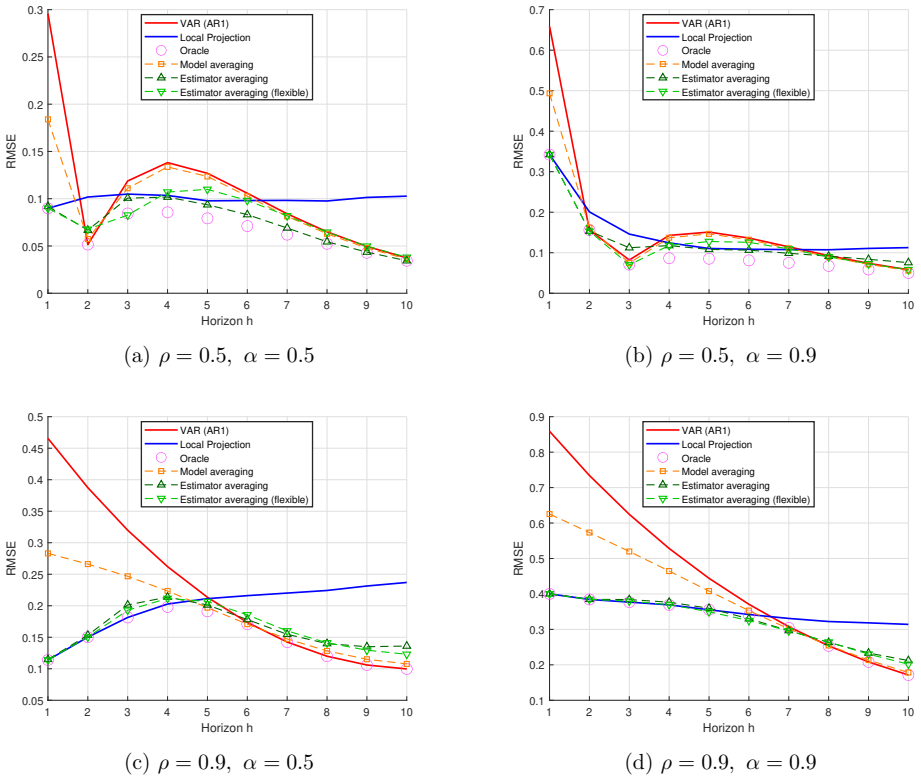
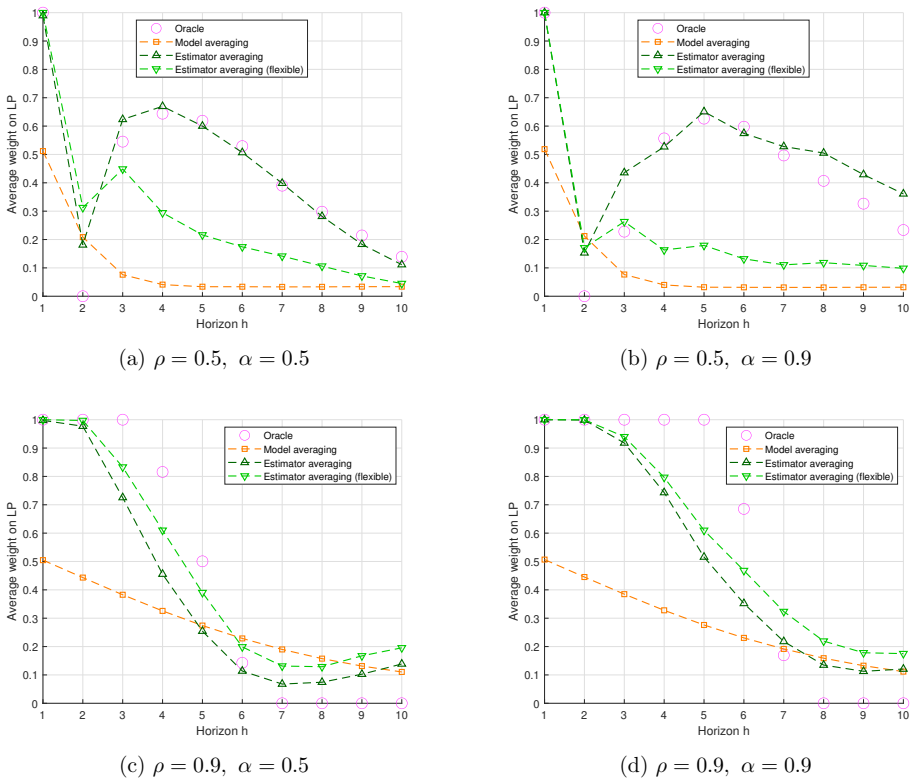
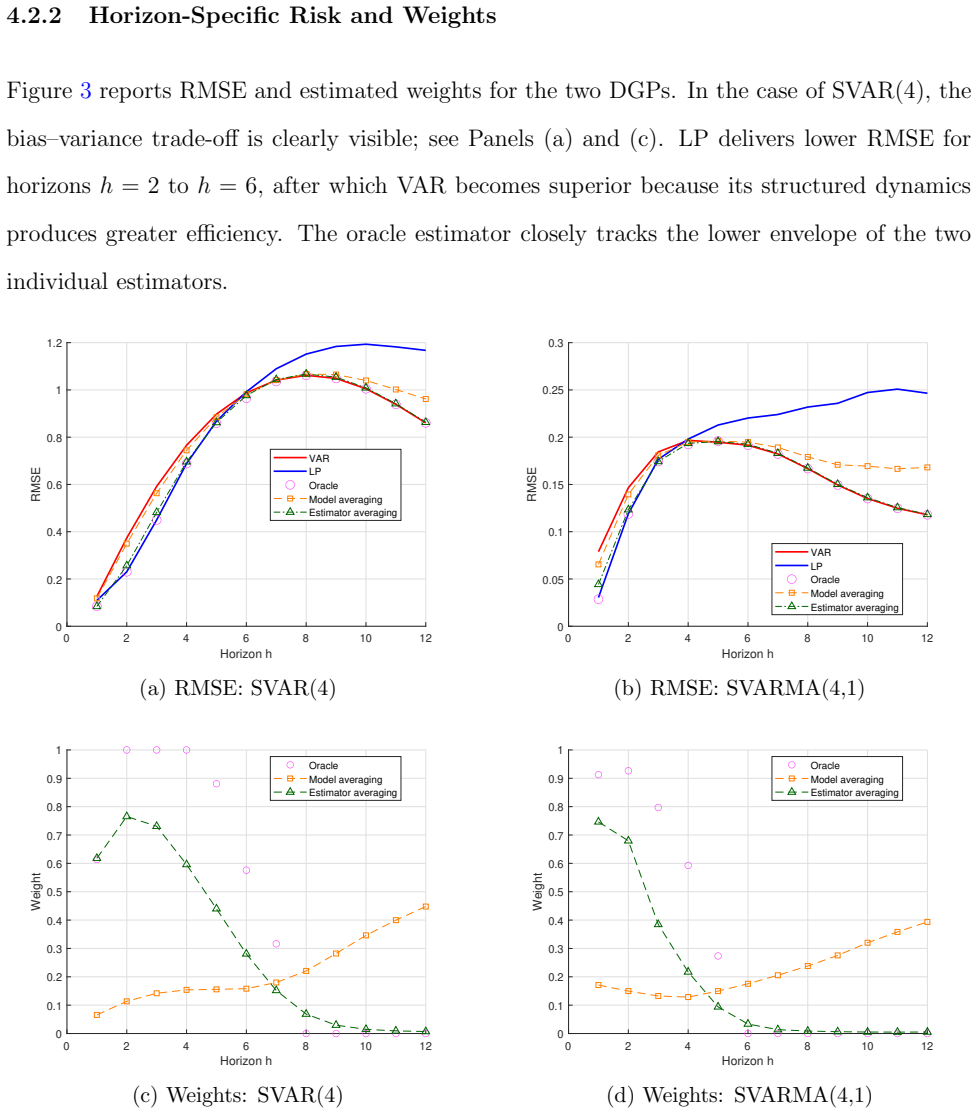
The paper establishes that a weighted average of local projection and VAR impulse response estimates, with weights chosen to minimize the finite-sample mean squared error of the impulse response itself, can be implemented using closed-form oracle expressions and feasible AR-sieve bootstrap procedures. For benchmark short-memory linear processes, this averaged estimator is consistent and has a limiting distribution, while Monte Carlo evidence indicates lower risk than either method alone and an R-square-based benchmark, with an empirical application yielding stable and intuitive responses.
What carries the argument
The MSE-minimizing estimator-averaging procedure that produces horizon-specific weights for combining LP and VAR impulse response estimates, derived in closed form for the oracle case and made feasible via AR-sieve bootstrap.
If this is right
- The feasible averaged estimator is consistent and has an established limiting distribution under short-memory linear data generating processes.
- Monte Carlo experiments demonstrate lower mean squared error for the averaged estimator relative to standalone LP and VAR across various specifications.
- The approach outperforms an R-square-based model-averaging alternative in finite-sample risk comparisons.
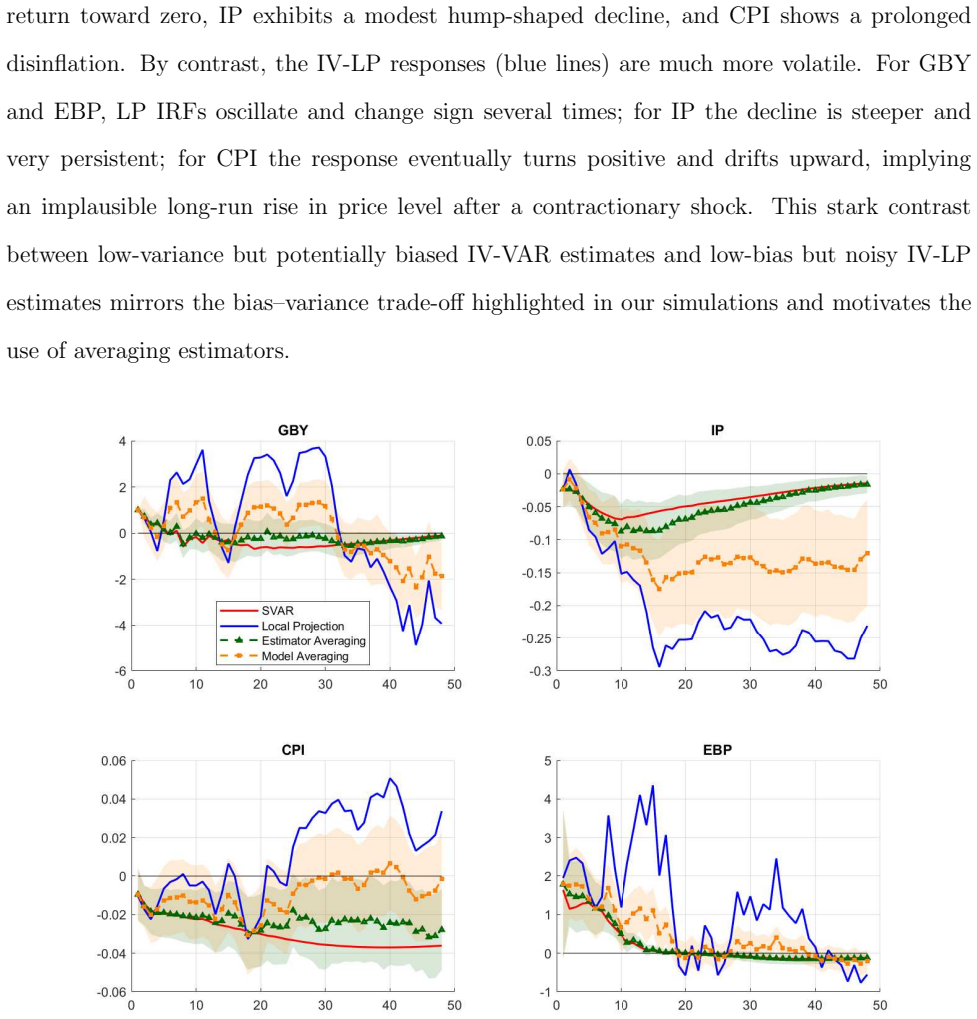
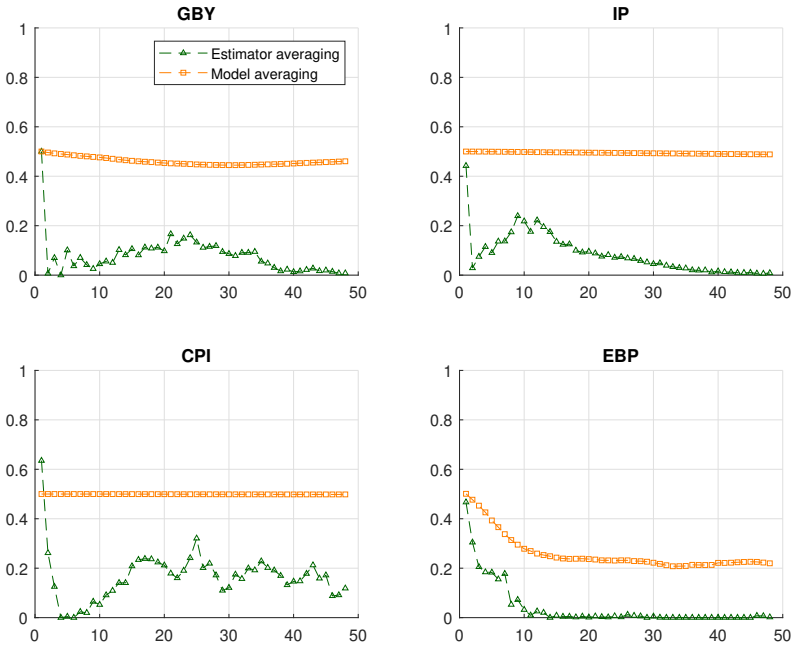
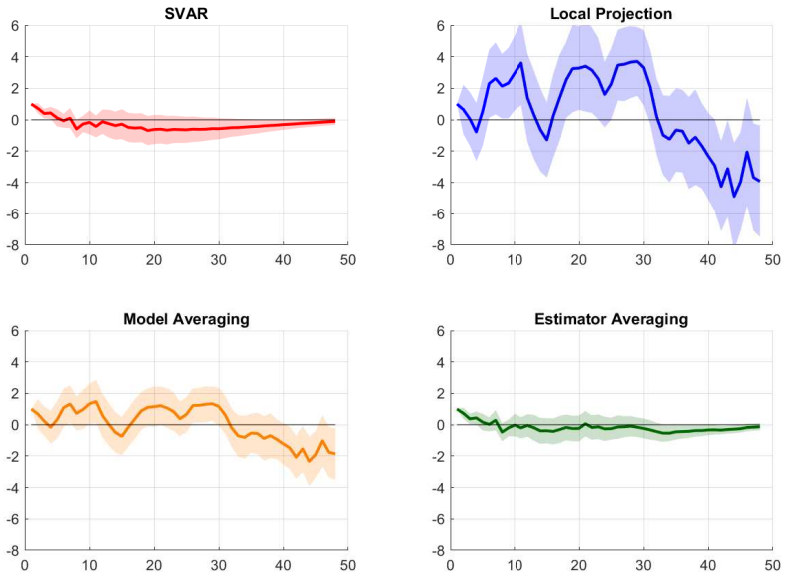
- In the empirical application, the averaged estimates produce stable responses for yields, activity, prices, and credit spreads following a monetary policy shock.
Where Pith is reading between the lines
- The risk-minimization principle could be applied to average other pairs of impulse response estimators beyond LP and VAR.
- Macroeconomic researchers might use the method to obtain more reliable policy counterfactuals without committing to a single estimation approach.
- Performance under long-memory or nonlinear data generating processes remains an open question that could be tested in extensions.
- The framework suggests a template for direct risk-based averaging that might apply to other econometric estimators where bias-variance trade-offs appear.
Load-bearing premise
The underlying data generating process belongs to the class of short-memory linear processes for which both local projections and vector autoregressions are consistent estimators of the impulse responses.
What would settle it
A Monte Carlo simulation with a known true impulse response function in which the averaged estimator exhibits higher mean squared error than the better of the individual LP or VAR estimator at most horizons would falsify the risk-reduction claim.
Figures


read the original abstract
Local projections (LP) and vector autoregressions (VAR) are the two standard tools for impulse response analysis, but they often display a finite-sample trade-off: LP is typically less biased but more volatile, while VAR is more precise but can be biased under misspecification. We propose an easy-to-implement estimator-averaging approach that combines LP and VAR at each horizon by minimizing the mean squared error of the impulse response itself, rather than in-sample fit. We derive closed-form oracle weights for this finite-sample risk problem, develop feasible AR-sieve-bootstrap procedures, and compare them against an Rsquare-based model-averaging benchmark. For a benchmark class of short-memory linear data generating processes in which LP and VAR are both consistent, we establish the consistency and limiting distribution of the feasible averaged estimator. Monte Carlo results show meaningful risk reductions relative to LP and VAR alone. In an empirical application revisiting Bauer and Swanson (2023), estimator averaging delivers stable and economically intuitive responses for yields, activity, prices, and credit spreads.
Editorial analysis
A structured set of objections, weighed in public.
Referee Report
Summary. The manuscript proposes an estimator-averaging procedure that combines local projection (LP) and VAR impulse response estimators at each horizon by deriving closed-form oracle weights that minimize the finite-sample mean squared error of the impulse response itself. It develops feasible AR-sieve bootstrap implementations of these weights, compares them to an R-squared-based benchmark, and establishes consistency plus limiting distributions for the feasible averaged estimator under a benchmark class of short-memory linear DGPs in which both LP and VAR are consistent. Monte Carlo experiments document risk reductions relative to the individual estimators, and an empirical application to Bauer and Swanson (2023) produces stable responses for yields, activity, prices, and credit spreads.
Significance. If the derivations and Monte Carlo results hold, the paper supplies a practical, horizon-specific averaging method that exploits the bias-variance trade-off between LP and VAR without relying on in-sample fit criteria. The closed-form oracle weights, AR-sieve bootstrap, and asymptotic guarantees for a relevant DGP class constitute clear strengths; the approach could improve robustness of impulse-response inference in applied macroeconometrics.
major comments (2)
- [§3] §3, Theorem 1: the proof that the feasible weights converge at a rate sufficient to preserve the limiting distribution of the averaged estimator requires an explicit uniform bound on the bootstrap estimation error of the MSE components; without this, the claim that the feasible estimator inherits the oracle limiting distribution is not fully established.
- [§4.1] §4.1, Monte Carlo design: the reported risk reductions are shown only for correctly specified linear short-memory DGPs; adding at least one design in which the VAR is misspecified (e.g., omitted variables or long-memory components) would test whether the averaging procedure retains its advantage when the consistency assumption is violated.
minor comments (3)
- [§2.2] §2.2: the definition of the oracle weights in Eq. (8) should explicitly state whether the MSE is evaluated at the true impulse response or at a pseudo-true value under local misspecification.
- [Table 2] Table 2: the columns reporting relative MSE should include the number of Monte Carlo replications and a note on whether the differences are statistically significant.
- [§5] §5: the empirical application would benefit from a brief discussion of how the estimated weights vary across horizons and variables, to illustrate the practical behavior of the procedure.
Simulated Author's Rebuttal
We thank the referee for the constructive and insightful comments on our manuscript. We address each major comment below and outline the revisions we will make to strengthen the paper.
read point-by-point responses
-
Referee: [§3] §3, Theorem 1: the proof that the feasible weights converge at a rate sufficient to preserve the limiting distribution of the averaged estimator requires an explicit uniform bound on the bootstrap estimation error of the MSE components; without this, the claim that the feasible estimator inherits the oracle limiting distribution is not fully established.
Authors: We appreciate the referee's careful reading of the proof of Theorem 1. Upon review, we agree that the argument would benefit from an explicit uniform bound on the bootstrap estimation error of the MSE components to rigorously control the convergence rate of the feasible weights. In the revised version, we will introduce this bound as an additional lemma in the appendix and use it to complete the proof that the feasible averaged estimator inherits the oracle limiting distribution. This addition will be clearly marked in the updated manuscript. revision: yes
-
Referee: [§4.1] §4.1, Monte Carlo design: the reported risk reductions are shown only for correctly specified linear short-memory DGPs; adding at least one design in which the VAR is misspecified (e.g., omitted variables or long-memory components) would test whether the averaging procedure retains its advantage when the consistency assumption is violated.
Authors: We thank the referee for this suggestion. The Monte Carlo experiments in the current draft are designed to match the benchmark class of short-memory linear DGPs under which our consistency and limiting distribution results are derived. We agree that examining performance when the VAR is misspecified would provide useful practical insight. In the revision, we will add at least one additional Monte Carlo design incorporating VAR misspecification (for example, an omitted variable or long-memory component) and report the corresponding risk reductions relative to the individual estimators. revision: yes
Circularity Check
No significant circularity; derivation is self-contained
full rationale
The paper derives closed-form oracle weights by explicitly minimizing the finite-sample mean squared error of the impulse response function itself (rather than in-sample fit), which is a direct optimization step on the risk criterion and does not reduce to the input estimators by construction. The feasible AR-sieve bootstrap implementation and the consistency/limiting distribution results are established under an explicitly stated benchmark class of short-memory linear DGPs where both LP and VAR are already known to be consistent; this is a standard scope restriction, not a tautological assumption that forces the averaged estimator's properties. No load-bearing self-citations, ansatz smuggling, renaming of known results, or fitted parameters presented as independent predictions appear in the described chain. The central contribution (horizon-specific averaging with MSE-minimizing weights) retains independent content beyond its inputs.
Axiom & Free-Parameter Ledger
axioms (1)
- domain assumption Short-memory linear data generating processes in which both LP and VAR are consistent
Reference graph
Works this paper leans on
-
[1]
Before proving the lemma, we clarify the role of the AR-sieve pseudo -truth. Under the short-memory Wold assumptions and the AR-sieve lag-or der condition, with pT → ∞ sufficiently slowly relative to T , the AR-sieve approximation targets the same population impulse response in the benchmark setting where LP and V AR are bot h consistent. This motivates the...
-
[2]
Then ˆwh = ¯G ( G( ˆAT,h , ˆDT,h , ˆFT,h ) ) and w⋆ h = ¯G(G(Ah, D h, F h))
Define G(A, D, F ) = ( D− F )/ (A+D− 2F ), and let ¯G(x) = min {1, max{0, x }} denote clipping. Then ˆwh = ¯G ( G( ˆAT,h , ˆDT,h , ˆFT,h ) ) and w⋆ h = ¯G(G(Ah, D h, F h)). By Lemma 2, ( ˆAT,h , ˆDT,h , ˆFT,h ) p − →(Ah, D h, F h). (B.1) Assumption 5 implies Ah + Dh − 2Fh ≥ c > 0. Therefore, G is continuous in a neighborhood of ( Ah, D h, F h). Since the l...
-
[3]
31 0 . 75 0 . 25 − 0. 12 2 . 08 0 . 23 − 0. 23 0 . 56 1 . 75 , A 2 = − 0. 52 − 1. 06 − 0. 35
-
[4]
32 − 0. 78 − 1. 12 , A3 =
-
[5]
04 0 . 48 0 . 16 − 0. 08 0 . 53 0 . 15 − 0. 14 0 . 35 0 . 31 , A 4 =
-
[6]
02 − 0. 05 − 0. 03 . The structural impact matrix M0 is: M0 =
-
[7]
6 − 0. 6 1 . 7 44 SV ARMA(4,1) Specification The autoregressive coefficients A1, . . . , A 4 are: A1 =
-
[8]
24 − 0. 04 − 0. 03 − 0. 58 1 . 77 0 . 32 − 0. 78 0 . 76 1 . 63 , A 2 = − 0. 52 0 . 02 0 . 06
-
[9]
04 − 0. 98 − 1. 02 , A3 =
-
[10]
08 0 . 00 − 0. 03 − 0. 30 0 . 39 0 . 16 − 0. 44 0 . 41 0 . 29 , A 4 = − 0. 01 0 . 00 0 . 00
-
[11]
06 − 0. 05 − 0. 03 . The moving average matrix M1 is: M1 = − 0. 30 0 . 10 − 0. 40 − 0. 20 0 . 20 − 1. 00 − 0. 30 0 . 07 0 . 20 The structural impact matrix M0 is: M0 =
-
[12]
30 0 . 40 0 . 10 − 0. 02 0 . 05 2 . 00 − 0. 08 − 1. 70 0 . 80 Figure 6 displays the true impulse response functions alongside the average estimates from the V AR and LP estimators ( T = 200). 45 0 2 4 6 8 10 12 Horizon h 0 1 2 3 4 5 6 True VAR LP (a) SV AR(4) 0 2 4 6 8 10 12 Horizon h 0 0.2 0.4 0.6 0.8 1 1.2 1.4 True VAR LP (b) SV ARMA(4,1) Fi...
discussion (0)
Sign in with ORCID, Apple, or X to comment. Anyone can read and Pith papers without signing in.