Recognition: unknown
SixGman: An Open-Source Planner for Fixed 6G Hierarchical Optical Access-Core Networks
Pith reviewed 2026-05-08 05:20 UTC · model grok-4.3
The pith
Bypassing electrical aggregation at one layer in 6G optical networks cuts total ownership cost by up to 17.5 percent and energy use by 29.1 percent.
A machine-rendered reading of the paper's core claim, the machinery that carries it, and where it could break.
Core claim
SixGman integrates standardized modules for traffic generation, dual-homed routing, quality-of-transmission estimation, spectrum and fiber assignment, techno-economic analysis, and energy evaluation. When run on the Telefónica MAN157 topology with four hierarchical layers, the version that bypasses electrical aggregation at HL3 nodes delivers up to 17.5 percent lower total cost of ownership and 29.1 percent lower cumulative energy consumption while improving traffic distribution and end-to-end latency.
What carries the argument
SixGman, the modular open-source framework that couples traffic generation, QoT estimation, dual-homed routing, spectrum assignment, and separate techno-economic and energy models to compare full versus simplified hierarchical optical architectures.
If this is right
- Operators can evaluate simplified hierarchical designs before rollout and expect lower capital and operating costs.
- Energy budgets for large optical access-core networks can be reduced by removing intermediate electrical aggregation points.
- Planning workflows gain reproducibility because the tool uses standardized interfaces and open modules.
- Latency and link utilization improve when traffic skips one layer of electrical processing.
Where Pith is reading between the lines
- The same bypass logic could be tested on other national or regional topologies to see whether the percentage savings remain consistent.
- Extending the tool to include wireless backhaul or dynamic 6G traffic spikes would show how robust the architecture gains are under more variable loads.
- If the cost and energy models are validated against real equipment data, the framework could serve as a shared benchmark for comparing additional architecture variants.
Load-bearing premise
The traffic generation, quality-of-transmission, cost, and energy models inside SixGman correctly represent real 6G traffic patterns and the chosen 157-node metro topology stands in for future large-scale deployments.
What would settle it
Measure actual capital and operating expenditures plus energy draw on a deployed segment of HL3-bypassed network and compare the numbers directly to the model's predictions for the same traffic load.
Figures


read the original abstract
This paper introduces SixGman, an open-source optical network planning tool for evaluating access-metro-core aggregation network architectures. The framework integrates traffic generation, dual-homed routing, Quality of Transmission (QoT) estimation, spectrum and fiber assignment, techno-economic analysis, energy consumption evaluation, and visualization capabilities. Its modular design, based on standardized interfaces and clearly defined functions, enables flexible, transparent, and reproducible network simulations. SixGman is applied to the Telef\'onica MAN157 metro-urban topology, composed of 157 optical nodes, 220 links, and four hierarchical layers (HL1-HL4), to compare a conventional full hierarchical architecture with an HL3-bypassed architecture where electrical aggregation at HL3 nodes is removed. The analysis includes traffic distribution, IP router utilization, link congestion, latency, Total Cost of Ownership (TCO), and energy consumption. Results show that HL3 bypassing improves traffic distribution, reduces optical and electrical resource usage, lowers end-to-end latency, and decreases both capital and operational expenditures. Compared to the full hierarchical architecture, the HL3-bypassed scenario achieves reductions of up to 17.5% in TCO and 29.1% in cumulative energy consumption. These results demonstrate the potential of SixGman as a flexible planning platform for cost- and energy-efficient optical network design.
Editorial analysis
A structured set of objections, weighed in public.
Referee Report
Summary. The paper introduces SixGman, an open-source modular planning tool for fixed 6G hierarchical optical access-core networks that integrates traffic generation, dual-homed routing, QoT estimation, spectrum/fiber assignment, techno-economic analysis, energy evaluation, and visualization. It is applied to the Telefónica MAN157 topology (157 nodes, 220 links, four hierarchical layers) to compare a conventional full hierarchical architecture against an HL3-bypassed variant that removes electrical aggregation at HL3 nodes. The central quantitative claims are that the bypassed architecture yields up to 17.5% lower TCO and 29.1% lower cumulative energy consumption while also improving traffic distribution, resource usage, and latency.
Significance. If the internal models prove accurate, the work demonstrates concrete cost and energy advantages of simplified hierarchical optical aggregation for 6G-scale networks and supplies a reproducible, extensible open-source platform that other researchers can use or extend. The emphasis on standardized interfaces and modular design is a clear strength for transparency and future validation studies.
major comments (2)
- [Abstract and §5] Abstract and §5 (Results): The headline reductions (17.5% TCO, 29.1% energy) are produced by applying the tool’s traffic generator, QoT estimator, techno-economic module, and energy model to the single MAN157 topology; the manuscript supplies no calibration of these modules against measured traffic traces, field QoT data, or published energy audits of comparable networks, nor any sensitivity sweeps on model parameters. This directly limits the reliability of the quantitative claims.
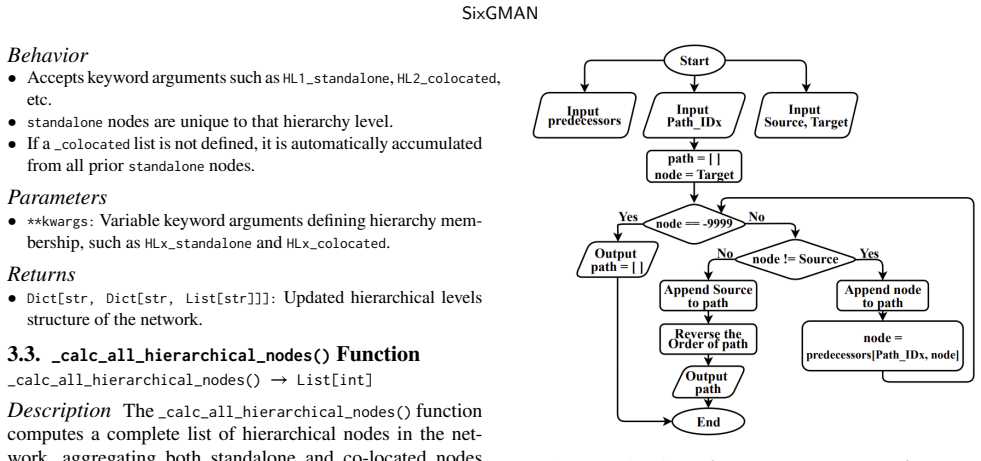
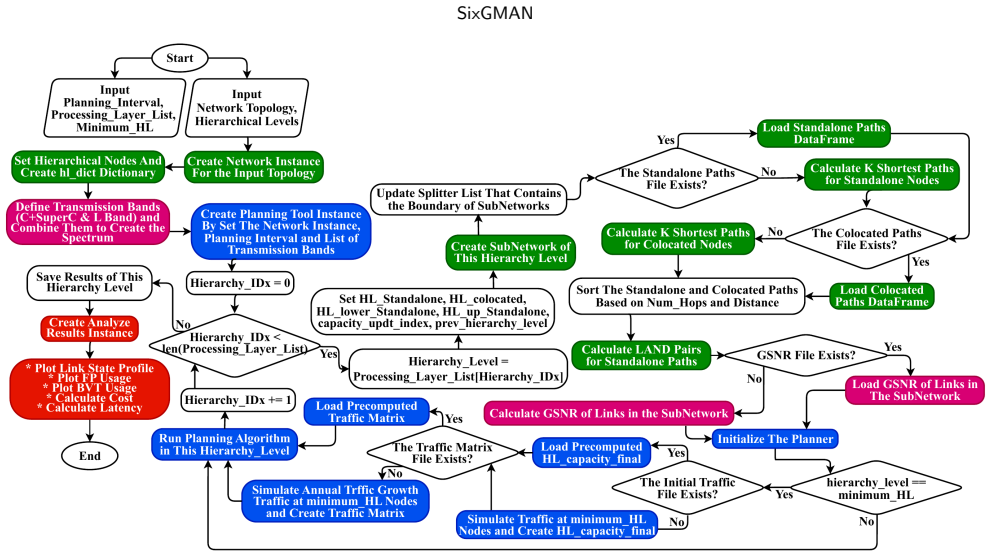
- [§3] §3 (Methodology): The traffic generation, QoT estimation, router/switch power curves, and CAPEX/OPEX parameters are described only at a high level with no explicit equations, default parameter tables, or source references for the 6G traffic statistics and optical impairment models. Without these details it is impossible to reproduce or independently assess the reported savings.
minor comments (1)
- [Figures in §5] Figure captions and axis labels in the results section would benefit from explicit units and a brief statement of the simulation duration or traffic scaling factor used to obtain the cumulative energy figures.
Simulated Author's Rebuttal
We thank the referee for the constructive comments highlighting the need for greater transparency in model details and validation. We address each major point below and outline the revisions we will incorporate to strengthen the manuscript while preserving its core contributions as an open-source planning tool.
read point-by-point responses
-
Referee: [Abstract and §5] Abstract and §5 (Results): The headline reductions (17.5% TCO, 29.1% energy) are produced by applying the tool’s traffic generator, QoT estimator, techno-economic module, and energy model to the single MAN157 topology; the manuscript supplies no calibration of these modules against measured traffic traces, field QoT data, or published energy audits of comparable networks, nor any sensitivity sweeps on model parameters. This directly limits the reliability of the quantitative claims.
Authors: We agree that the reported savings are obtained by exercising the models on the single MAN157 topology and that the manuscript does not include direct calibration against proprietary measured traffic traces, field QoT measurements, or published energy audits of comparable networks. The traffic generator follows standard 6G statistical patterns drawn from publicly available forecasts, the QoT estimator implements established analytical impairment models, and the techno-economic and energy modules use parameters from vendor reports and literature. The open-source, modular architecture is explicitly designed to let users substitute their own calibrated data. In the revision we will add to §5 a discussion of model assumptions and limitations, include a sensitivity analysis on key parameters (traffic volume, power coefficients, and fiber costs) to illustrate robustness of the relative TCO and energy differences, and expand cross-references in §3 to the underlying sources. These changes will better qualify the quantitative claims without changing the comparative results. revision: partial
-
Referee: [§3] §3 (Methodology): The traffic generation, QoT estimation, router/switch power curves, and CAPEX/OPEX parameters are described only at a high level with no explicit equations, default parameter tables, or source references for the 6G traffic statistics and optical impairment models. Without these details it is impossible to reproduce or independently assess the reported savings.
Authors: We accept that the current text presents the components at a summary level. All models, equations, and default parameter values are fully implemented and documented in the public SixGman repository. For the revised manuscript we will expand §3 to include the explicit equations for traffic generation (Poisson arrivals with 6G-specific rate distributions), the QoT estimation procedure (Gaussian-noise-based OSNR calculation), the router/switch power-consumption curves with fitted coefficients, and a table listing every default CAPEX/OPEX and energy parameter together with its bibliographic source. These additions will make the paper self-contained while retaining the link to the open-source code for complete reproducibility. revision: yes
- Direct calibration against non-public operator traffic traces and field QoT data from the Telefónica network, which are unavailable to the authors.
Circularity Check
No circularity: results are simulation outputs on external topology
full rationale
The paper introduces SixGman as a modular simulator integrating traffic generation, QoT estimation, techno-economic analysis and energy models, then applies it to the independent MAN157 topology to compare two fixed architectures. The headline TCO and energy reductions are direct outputs of running these modules on the given topology and traffic; no equations, fitted parameters, or self-citations are shown to define the savings by construction or to import uniqueness from prior author work. The derivation chain is therefore self-contained against external benchmarks.
Axiom & Free-Parameter Ledger
Reference graph
Works this paper leans on
-
[1]
Y. Shen, P. Wang, C.-J. Huang, S. Kuang, S. Li, Z. Li, Elastic ran slicing technology with multi-timescale sla assurances for heterogeneous services provision in 6g, Journal of Network and Computer Applications 244 (2025) 104330. doi:https://doi.org/10.1016/j.jnca.2025.104330. URLhttps://www.sciencedirect.com/science/article/pii/ S1084804525002279
-
[2]
D. Uzunidis, K. Moschopoulos, C. Papapavlou, K. Paximadis, D. M. Marom, M. Nazarathy, R. Muñoz, I. Tomkos, A vision of 6th gen- eration of fixed networks (f6g): Challenges and proposed directions, Telecom 4 (4) (2023) 758–815.doi:10.3390/telecom4040035. URLhttps://www.mdpi.com/2673-4001/4/4/35
-
[3]
Kretsis, I
A. Kretsis, I. Sartzetakis, et al., Armonia: a unified access and metro network architecture, Applied Sciences 10 (23) (2020) 8318
2020
-
[4]
F. Arpanaei, J. M. Rivas-Moscoso, J. A. Hernández, J. P. Fernández- Palacios, D. Larrabeiti, Migration strategies from c-band to c+l- band/multi-fiber solutions in optical metropolitan area networks, in: 49th European Conference on Optical Communications (ECOC 2023), Vol. 2023, 2023, pp. 1531–1534.doi:10.1049/icp.2023.2620
-
[5]
J. M. Rivas-Moscoso, F. Arpanaei, G. Otero Perez, J. D. Mar- tinez Jimenez, J. P. Fernandez-Palacios, O. Gonzalez de Dios, L. M. Contreras, A. Sanchez-Macian, J. A. Hernandez, D. Larrabeiti, J. Folgueira, Tefnet24: reference packet optical network topology for edge to core transport, Journal of Optical Communications and Networking 16 (11) (2024) G28–G39....
-
[6]
J. P. Fernández-Palacios, F. Arpanaei, J. M. Rivas-Moscoso, J. A. Hernández, D. Larrabeiti, Investigation of mid-term migration sce- nariostomulti-bandsolutionsinmetropolitannetworks,in:202323rd InternationalConferenceonTransparentOpticalNetworks(ICTON), 2023, pp. 1–4.doi:10.1109/ICTON59386.2023.10207237. Matin Rafiei et al.:Preprint submitted to Elsevier...
-
[7]
D.M.Soleymani,E.Roth-Mandutz,6genergyefficiencyandsustain- abilitywhitepaper,JournalofOpticalCommunicationsandNetwork- ing (Jan. 2023)
2023
-
[8]
F. Arpanaei, et al., Enabling seamless migration of optical metro- urban networks to the multi-band: unveiling a cutting-edge 6d plan- ning tool for the 6g era, Journal of Optical Communications and Networking 16 (4) (2024) 463–480.doi:10.1364/JOCN.505490
-
[9]
G. Shen, R. S. Tucker, Energy-minimized design for ip over wdm networks, Journal of Optical Communications and Networking 1 (1) (2009) 176–186
2009
-
[10]
A. Fayad,T. Cinkler, etal., Toward 6goptical fronthaul: Asurvey on enabling technologies and research perspectives, IEEE Communica- tions Surveys & Tutorials 27 (1) (2024) 629–666
2024
-
[11]
E. C. Strinati, S. Barbarossa, et al., 6g: The next frontier: From holographicmessagingtoartificialintelligenceusingsubterahertzand visible light communication, IEEE Vehicular Technology Magazine 14 (3) (2019) 42–50
2019
-
[12]
A. Bhandari, A. Gupta, S. Tanwar, J. J. Rodrigues, R. Sharma, A. Singh, Latency optimized c-ran in optical backhaul and rf fronthaul architecture for beyond 5g network: A comprehensive survey, Computer Networks 247 (2024) 110459. doi:https://doi.org/10.1016/j.comnet.2024.110459. URLhttps://www.sciencedirect.com/science/article/pii/ S1389128624002913
-
[13]
A. Shakeri, T. Zhang, S. Ramanathan, M. Razo, M. Tacca, A. Fumagalli, Reliable edge-to-core optical networks: An optimal algorithm for maximal path diversity, Computer Networks 242 (2024) 110268.doi:https://doi.org/10.1016/j.comnet.2024.110268. URLhttps://www.sciencedirect.com/science/article/pii/ S1389128624001002
-
[14]
Ramírez-Arroyo, P
A. Ramírez-Arroyo, P. H. Zapata-Cano, et al., Multilayer network optimization for 5g & 6g, IEEE Access 8 (2020) 204295–204308
2020
-
[15]
Ferrari, M
A. Ferrari, M. Filer, et al., Gnpy: an open source application for physical layer aware open optical networks, Journal of Optical Com- munications and Networking 12 (6) (2020) C31–C40
2020
-
[16]
Ajayi, D
T. Ajayi, D. Blaauw, Openroad: Toward a self-driving, open-source digital layout implementation tool chain, in: Proceedings of Govern- mentMicrocircuitApplicationsandCriticalTechnologyConference, 2019
2019
-
[17]
D. G. Sequeira, L. G. Cancela, J. L. Rebola, Impact of physical layerimpairmentsonmulti-degreecdcroadm-basedopticalnetworks, in: 2018 International Conference on Optical Network Design and Modeling (ONDM), IEEE, 2018, pp. 94–99
2018
-
[18]
J. A. Hernández, M. Quagliotti, L. Serra, L. Luque, R. L. da Silva, A.Rafel,Ó.G.deDios,V.López,A.Eira,R.Casellas,etal.,Compre- hensive model for technoeconomic studies of next-generation central offices for metro networks, Journal of Optical Communications and Networking 12 (12) (2020) 414–427. Matin Rafiei et al.:Preprint submitted to ElsevierPage 30 of 30
2020
discussion (0)
Sign in with ORCID, Apple, or X to comment. Anyone can read and Pith papers without signing in.