Recognition: unknown
Compound effects of traffic and climate on electric vehicle HVAC energy consumption: a spatiotemporal framework with city-level attribution
Pith reviewed 2026-05-08 04:16 UTC · model grok-4.3
The pith
Traffic congestion often dominates electric vehicle HVAC energy use through longer trip times rather than ambient temperature.
A machine-rendered reading of the paper's core claim, the machinery that carries it, and where it could break.
Core claim
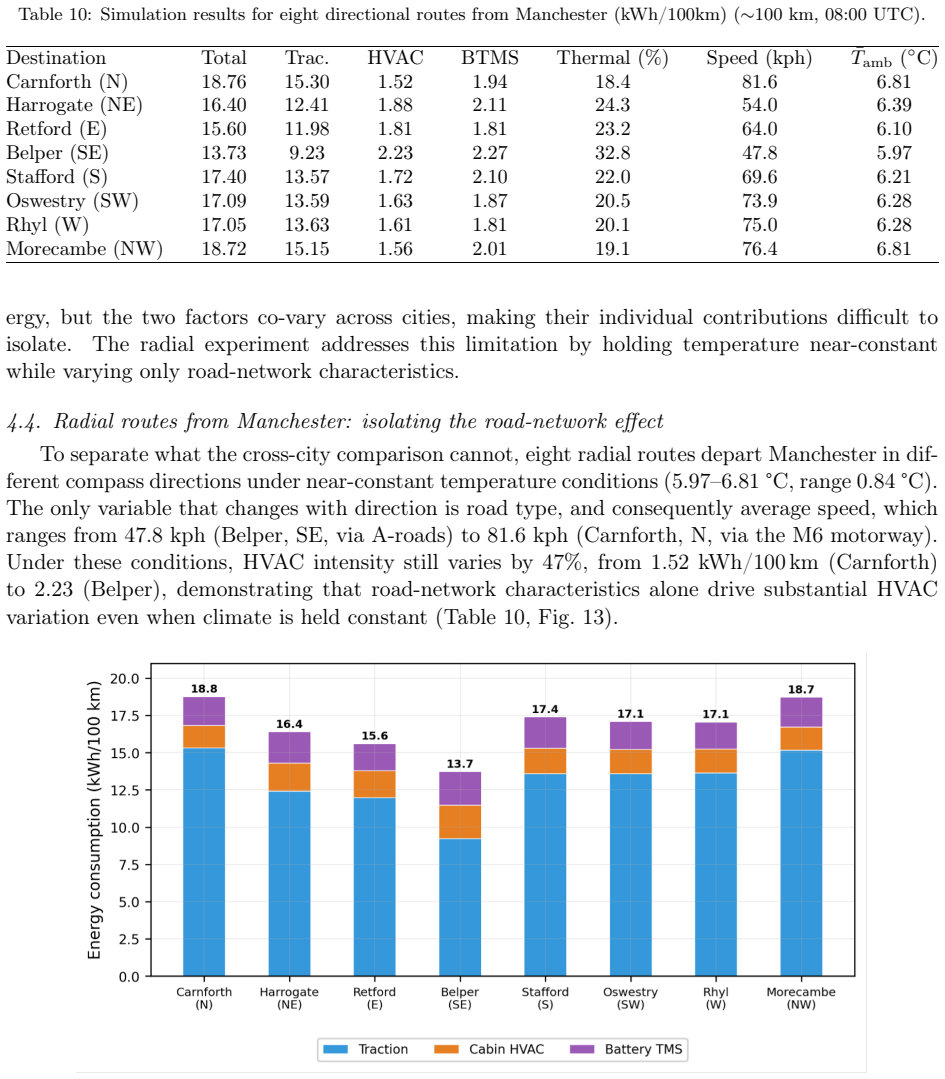
The spatiotemporal framework couples traffic-aware driving speed, time- and location-specific ambient temperature, and physics-based submodels for cabin HVAC, traction, and battery thermal management at the segment level, paired with a regression-based decomposition that attributes HVAC variability to temperature and trip-duration components on a per-route basis. Applied through a factorial design across seven UK cities and eight radial routes from Manchester, the framework shows total energy varying by 14 percent across cities while HVAC energy varies by up to 89 percent, making cabin thermal management the primary differentiator under winter conditions. Trip duration, set by traffic and道路型
What carries the argument
The regression-based decomposition that attributes HVAC variability to temperature and trip-duration components on a per-route basis after segment-level simulation with traffic speed and location temperature inputs.
If this is right
- Total energy consumption varies by 14% across cities while HVAC energy varies by up to 89%, identifying cabin thermal management as the main source of winter differences.
- The decomposition yields a closed-form HVAC model using only ambient temperature, average speed, and trip distance, with coefficients that transfer via simple re-fitting.
- EV range variability is substantially shaped by traffic and road-network characteristics rather than temperature alone.
- Per-route attribution enables targeted improvements in route planning and infrastructure design for energy equity.
Where Pith is reading between the lines
- Navigation systems could add the three-variable HVAC formula to real-time routing to avoid high-energy paths when traffic is heavy.
- City traffic management that raises average speeds on major routes would reduce HVAC energy demands more effectively than temperature-focused measures in winter.
- The model's transferability through coefficient refits allows quick adaptation for new EV models or regions without rebuilding the full simulation.
- Extending the analysis to cities with different road networks could test whether trip duration remains the dominant HVAC driver outside the UK.
Load-bearing premise
The physics-based submodels for cabin HVAC, traction, and battery thermal management, together with the regression decomposition, correctly isolate and attribute energy variability without substantial bias from unmodeled interactions or data limitations.
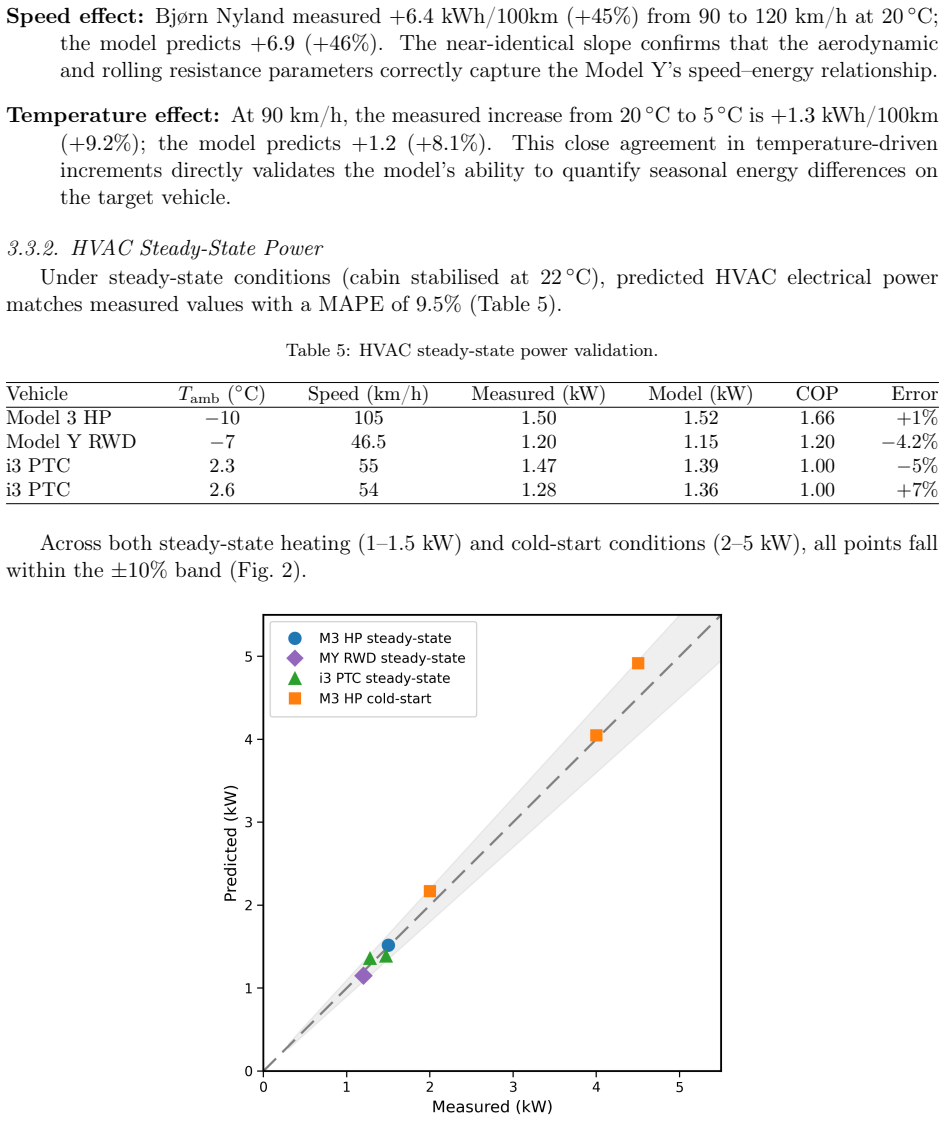
What would settle it
Direct on-vehicle measurements of HVAC power draw on repeated drives along the Manchester radial routes under controlled variations in traffic speed and ambient temperature, then comparison of the observed share of variability explained by trip duration against the model's 83 percent London figure.
Figures


read the original abstract
Real-world electric vehicle (EV) energy consumption can deviate by 20-40% from rated values, driven by ambient temperature, traffic congestion, and route characteristics. Existing studies treat these factors in isolation or as static loads, leaving the compound effect of co-varying climate and traffic on HVAC energy unquantified and per-route attribution unavailable. We develop a spatiotemporal simulation framework that couples traffic-aware driving speed, time- and location-specific ambient temperature, and physics-based submodels (cabin HVAC, traction, battery thermal management) at the segment level, paired with a regression-based decomposition that attributes HVAC variability to temperature and trip-duration components on a per-route basis. Applied through a factorial design across seven UK cities and eight radial routes from Manchester, the framework shows total energy varying by 14\% across cities while HVAC energy varies by up to 89\%, making cabin thermal management the primary differentiator under winter conditions. Trip duration, set by traffic and road type, is frequently the dominant driver of HVAC variability: in London, 83\% of above-average HVAC energy is attributable to congestion-extended trip time rather than to temperature. The decomposition yields a closed-form HVAC model from three inputs (ambient temperature, average speed, trip distance), with physically interpretable coefficients and straightforward transfer to other vehicles or regions through three coefficient re-fits. EV range variability is substantially shaped by traffic and road-network characteristics, with implications for route planning, infrastructure design, and energy equity.
Editorial analysis
A structured set of objections, weighed in public.
Referee Report
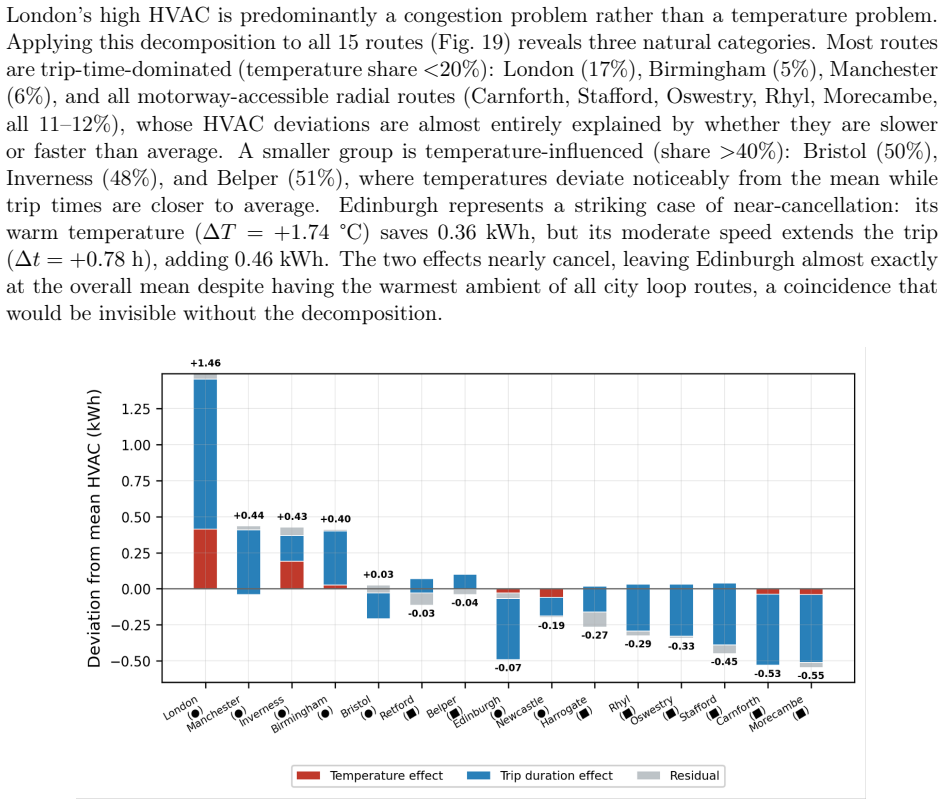
Summary. The manuscript develops a spatiotemporal simulation framework coupling traffic-aware driving speeds, location- and time-specific ambient temperatures, and physics-based submodels for cabin HVAC, traction, and battery thermal management at the segment level. A factorial design across seven UK cities and eight radial routes from Manchester is used to quantify compound effects, with regression-based decomposition attributing HVAC energy variability to temperature versus trip-duration (congestion) components. Key results include total energy varying by 14% across cities, HVAC energy by up to 89%, and in London 83% of above-average HVAC energy attributable to congestion-extended trip time; the decomposition produces a closed-form HVAC model from ambient temperature, average speed, and trip distance with interpretable coefficients.
Significance. If the submodel fidelity and decomposition hold, the work fills a gap in quantifying compound traffic-climate effects on EV energy use and supplies a transferable closed-form model that could inform route planning, infrastructure design, and energy equity analyses. The factorial design and per-route attribution approach are strengths for isolating dominant drivers.
major comments (2)
- [Abstract] Abstract: The 83% London attribution of above-average HVAC energy to congestion-extended trip time (rather than temperature) and the closed-form coefficients rest on regression applied to outputs from the authors' own coupled submodels, with no reported validation against real-world EV telemetry, error bars, or sensitivity analysis on submodel parameters; this makes the percentages and model vulnerable to simulation-specific artifacts.
- [Abstract] Abstract and framework description: The claim that the regression decomposition 'correctly isolate[s] and attribute[s] energy variability without substantial bias' is load-bearing for all quantitative results, yet the abstract provides no cross-validation, no details on how post-simulation regression avoids confounding from unmodeled interactions (e.g., speed-dependent ventilation load), and no external benchmarks for the cabin HVAC or battery TMS submodels.
minor comments (2)
- [Abstract] The abstract states 'straightforward transfer to other vehicles or regions through three coefficient re-fits' but does not specify the exact regression form or the three inputs' functional dependence, which would aid reproducibility.
- Minor notation inconsistency: 'trip duration, set by traffic and road type' is used interchangeably with 'congestion-extended trip time' without clarifying how road type is parameterized separately from speed.
Simulated Author's Rebuttal
We thank the referee for the detailed and constructive report. The comments correctly identify that the work is simulation-based and that stronger qualification of the regression attribution and its limitations is needed. We address each point below, have revised the abstract and methods for clarity, and added a sensitivity analysis on submodel parameters. The study does not include real-world telemetry, which remains a limitation.
read point-by-point responses
-
Referee: [Abstract] Abstract: The 83% London attribution of above-average HVAC energy to congestion-extended trip time (rather than temperature) and the closed-form coefficients rest on regression applied to outputs from the authors' own coupled submodels, with no reported validation against real-world EV telemetry, error bars, or sensitivity analysis on submodel parameters; this makes the percentages and model vulnerable to simulation-specific artifacts.
Authors: We agree that the absence of real-world telemetry validation is a limitation. The quantitative attributions (including the 83% figure) and closed-form coefficients are derived entirely from the coupled simulation outputs and should be interpreted as such. In the revised manuscript we have added a dedicated sensitivity analysis on key HVAC and battery TMS parameters (e.g., coefficient of performance, cabin thermal mass, and ventilation rate) with resulting ranges reported for the London route attributions. Error bars on the regression coefficients are now included. We have also qualified the abstract to state that the percentages reflect the modeled scenarios rather than claiming general validity. No real-world telemetry dataset spanning the seven cities and eight routes was available to the authors, so direct validation could not be performed. revision: partial
-
Referee: [Abstract] Abstract and framework description: The claim that the regression decomposition 'correctly isolate[s] and attribute[s] energy variability without substantial bias' is load-bearing for all quantitative results, yet the abstract provides no cross-validation, no details on how post-simulation regression avoids confounding from unmodeled interactions (e.g., speed-dependent ventilation load), and no external benchmarks for the cabin HVAC or battery TMS submodels.
Authors: We accept that the original wording overstated the isolation achieved by the regression. The phrase has been removed from the abstract and replaced with a description of the regression as an attribution tool applied to the simulated data. The revised methods section now details the regression specification, including explicit checks for multicollinearity (VIF < 5), the inclusion of an interaction term between average speed and trip distance to capture speed-dependent ventilation effects, and leave-one-route-out cross-validation within the simulated dataset. External benchmarks are limited to literature values for HVAC COP and battery TMS efficiency, which are now cited; no independent experimental benchmarks were conducted. These changes clarify the scope without altering the core simulation framework. revision: yes
- Absence of real-world EV telemetry validation for the reported percentages and closed-form HVAC model
Circularity Check
No significant circularity: results are direct outputs of simulation-plus-regression pipeline
full rationale
The paper constructs a spatiotemporal simulation that couples traffic speeds, location-specific temperatures, and physics-based submodels for cabin HVAC, traction, and battery management to generate segment-level energy consumption. It then applies a regression-based decomposition to the resulting dataset to attribute HVAC variability to temperature versus trip-duration (congestion) components and to obtain a three-input closed-form fit. The 83% London attribution and the closed-form model with interpretable coefficients are therefore computed outputs of this process applied to the simulated scenarios across the factorial design, not reductions of a claimed independent prediction or first-principles derivation back to its own inputs by construction. No self-definitional loops, fitted parameters renamed as external predictions, or load-bearing self-citations appear in the derivation chain.
Axiom & Free-Parameter Ledger
free parameters (2)
- regression coefficients for closed-form HVAC model
- submodel parameters in cabin HVAC, traction, and battery thermal models
axioms (2)
- domain assumption Physics-based submodels for cabin HVAC, traction, and battery thermal management accurately represent real dynamics at segment level
- domain assumption Traffic-aware driving speed and time/location-specific ambient temperature data are sufficiently accurate and representative for the studied routes
Reference graph
Works this paper leans on
-
[1]
URLhttps://www.gov.uk/government/publications/electric-vehicle-charging-market-study-final-report/ final-report 30
Building a comprehensive and competitive electric vehicle charging sector that works for all drivers (2021). URLhttps://www.gov.uk/government/publications/electric-vehicle-charging-market-study-final-report/ final-report 30
2021
-
[2]
URLhttps://www.gov.cn/zhengce/content/2020-11/02/content_5556716
Ministry of industry and information technology (2020). URLhttps://www.gov.cn/zhengce/content/2020-11/02/content_5556716
2020
-
[3]
C. F. Calvillo, K. Turner, Analysing the impacts of a large-scale ev rollout in the uk–how can we better inform environmental and climate policy?, Energy Strategy Reviews 30 (2020) 100497
2020
-
[4]
Yuksel, J
T. Yuksel, J. J. Michalek, Effects of regional temperature on electric vehicle efficiency, range, and emissions in the united states, Environmental science & technology 49 (6) (2015) 3974– 3980
2015
-
[5]
AAA, Electric vehicle range testing: Effects of ambient temperature and hvac use, AAA Re- search Report via Newsroom, at 20°F (≈–7°C), HVAC use caused average driving range to decrease by 41%, while cold ambient temperature alone (HVAC off) yielded a 12% decrease (2019)
2019
-
[6]
Sanguinetti, K
A. Sanguinetti, K. Kurani, J. Davies, The many reasons your mileage may vary: Toward a unifying typology of eco-driving behaviors, Transportation Research Part D: Transport and Environment 52 (2017) 73–84
2017
-
[7]
Neubauer, E
J. Neubauer, E. Wood, Thru-life impacts of driver aggression, climate, cabin thermal manage- ment, and battery thermal management on battery electric vehicle utility, Journal of Power Sources 259 (2014) 262–275
2014
-
[8]
Farrington, J
R. Farrington, J. Rugh, Impact of vehicle air-conditioning on fuel economy, tailpipe emissions, and electric vehicle range, Tech. rep., National Renewable Energy Lab.(NREL), Golden, CO (United States) (2000)
2000
-
[9]
K. R. Kambly, T. H. Bradley, Estimating the hvac energy consumption of plug-in electric vehicles, Journal of Power Sources 259 (2014) 117–124
2014
-
[10]
Bauer, C.-W
G. Bauer, C.-W. Hsu, N. Lutsey, When might lower-income drivers benefit from electric vehi- cles? quantifying the economic equity implications of electric vehicle adoption, Work. Pap 6 (2021) 1–21
2021
-
[11]
Department of Energy, Vehicle Technologies Office, Impact of cold ambient temperature on BEV performance, Tech
U.S. Department of Energy, Vehicle Technologies Office, Impact of cold ambient temperature on BEV performance, Tech. rep., U.S. Department of Energy, program Record, Vehicle Tech- nologies Office (Sep. 2024). URLhttps://www.energy.gov/sites/default/files/2024-10/Impact_of_Cold_Ambient_ Temperature_on_BEV_Performance_v15_TechEditFinal_12Sep2024__0.pdf
2024
-
[12]
T. T. Nguyen, T.-T. Nguyen, V.-N. Hoang, C. Wilson, S. Managi, Energy transition, poverty and inequality in vietnam, Energy Policy 132 (2019) 536–548
2019
-
[13]
T. J. Hendricks, Vehicle transient air conditioning analysis: Model development& system op- timization investigations, Tech. rep., National Renewable Energy Lab.(NREL), Golden, CO (United States) (2001)
2001
-
[14]
Brooker, J
A. Brooker, J. Gonder, L. Wang, E. Wood, S. Lopp, L. Ramroth, Fastsim: A model to estimate vehicle efficiency, cost and performance, Tech. rep., SAE technical paper (2015). 31
2015
-
[15]
G. Peri, S. Sambandan, S. S. Kumar, Cool down analysis of an hvac system using multi-zone cabin approach, Tech. rep., SAE Technical Paper (2017)
2017
-
[16]
URLhttps://www.osti.gov/biblio/5913742
D.Bernardi, E.Pawlikowski, J.Newman, Ageneralenergybalanceforbatterysystems, Journal of The Electrochemical Society 132 (1) (1985) 5–12.doi:10.1149/1.2113792. URLhttps://www.osti.gov/biblio/5913742
-
[17]
H. Togun, A. Basem, J. M. dhabab, H. I. Mohammed, A. M. Sadeq, N. Biswas, T. Ab- dulrazzaq, H. A. Hasan, R. Z. Homod, P. Talebizadehsardari, A comprehensive review of battery thermal management systems for electric vehicles: Enhancing performance, sustain- ability, and future trends, International Journal of Hydrogen Energy 97 (2025) 1077–1107. doi:10.101...
-
[18]
N. Ghaeminezhad, Z. Wang, Q. Ouyang, A review on lithium-ion battery thermal manage- ment system techniques: A control-oriented analysis, Applied Thermal Engineering 219 (2023) 119497.doi:10.1016/j.applthermaleng.2022.119497. URLhttps://www.sciencedirect.com/science/article/pii/S1359431122014272
-
[19]
G. Xia, L. Cao, G. Bi, A review on battery thermal management in electric vehicle application, Applied Thermal Engineering 219 (2019) 119660. URLhttps://www.sciencedirect.com/science/article/pii/S1359431118312547
2019
-
[20]
K. Nam, C. Ahn, Energy-efficient battery thermal management in electric vehicles using artificial-neural-network-based model predictive control, World Electric Vehicle Journal 16 (5) (2025) 279.doi:10.3390/wevj16050279. URLhttps://www.mdpi.com/2032-6653/16/5/279
-
[21]
S. Hao, K. Han, Y. Wang, Q. Liu, Vapor compression cycle-based integrated thermal manage- ment systems for electric vehicles: A critical review, Energy Conversion and Management 321 (2024) 119072.doi:10.1016/j.enconman.2024.119072. URLhttps://www.sciencedirect.com/science/article/pii/S0196890424010136
-
[22]
A decision-support framework for residential heating decarbonisation pol- icymaking
S. Pfenninger, I. Staffell, Long-term patterns of european pv output using 30 years of validated hourly reanalysis and satellite data, Energy 114 (2016) 1251–1265.doi:10.1016/j.energy. 2016.08.060
-
[23]
I. Staffell, S. Pfenninger, Using bias-corrected reanalysis to simulate current and future wind power output, Energy 114 (2016) 1224–1239.doi:10.1016/j.energy.2016.08.068
-
[24]
Nyland, Tesla Model Y LR AWD range test at 90 and 120 km/h, YouTube, reported by In- sideEVs,https://insideevs.com/news/531104/bjorn-range-mic-tesla-modely/(2021)
B. Nyland, Tesla Model Y LR AWD range test at 90 and 120 km/h, YouTube, reported by In- sideEVs,https://insideevs.com/news/531104/bjorn-range-mic-tesla-modely/(2021)
2021
-
[25]
Nyland, Tesla Model Y LR AWD cold weather range test at 90 and 120 km/h, YouTube, reported by InsideEVs,https://insideevs.com/news/581011/ mic-tesla-modely-cold-range-test/(2022)
B. Nyland, Tesla Model Y LR AWD cold weather range test at 90 and 120 km/h, YouTube, reported by InsideEVs,https://insideevs.com/news/581011/ mic-tesla-modely-cold-range-test/(2022)
2022
-
[26]
com/, constant-speed road test at 90 and 130 km/h, 38°C ambient (2023)
ArenaEV, Tesla Model Y Long Range AWD real world range test,https://www.arenaev. com/, constant-speed road test at 90 and 130 km/h, 38°C ambient (2023). 32
2023
-
[27]
K. Humphries, A. Loiselle-Lapointe, Analysis of heating system impacts on battery electric vehicle operation at cold temperatures, World Electric Vehicle Journal 17 (4) (2026) 168, open access, CC BY 4.0.doi:10.3390/wevj17040168
-
[28]
M. Steinstraeter, T. Heinrich, M. Lienkamp, Battery and heating data in real driving cycles, open access, CC BY 4.0 (2020).doi:10.21227/6jr9-5235
-
[29]
rep., Transport for London (2024)
Transport for London, Travel in London 2024: Annual overview, Tech. rep., Transport for London (2024). URLhttps://content.tfl.gov.uk/travel-in-london-2024-annual-overview-acc.pdf
2024
-
[30]
Q. Yu, T. Que, L. J. Cushing, G. Pierce, K. Shen, M. Kejriwal, Y. Yao, Y. Zhu, Equity and reli- ability of public electric vehicle charging stations in the United States, Nature Communications 16 (2025) 5291.doi:10.1038/s41467-025-60091-y. 33
discussion (0)
Sign in with ORCID, Apple, or X to comment. Anyone can read and Pith papers without signing in.