Recognition: unknown
Scalable model selection for count time series with structural breaks: application to solid-organ transplantation during and after COVID-19 in the USA and Italy
Pith reviewed 2026-05-08 03:37 UTC · model grok-4.3
The pith
Solid organ transplant donation counts follow unconditional time series, with pandemic shifts captured by pre-specified level or slope indicators and negligible added value from COVID burden covariates.
A machine-rendered reading of the paper's core claim, the machinery that carries it, and where it could break.
Core claim
Donation time series behave as unconditional processes whose structural breaks are adequately represented by a small set of pre-specified pandemic-period indicators; once those breaks are included, further covariates for COVID burden or mortality add statistically negligible forecast improvement, allowing attention to shift to post-pandemic operational factors such as hospital capacity and public perception.
What carries the argument
BIC selection over a pre-defined portfolio of Poisson and negative-binomial count models that embed short-term autoregression, calendar dummies, and pandemic level or slope indicators.
If this is right
- Deceased-donor activity in both countries can be expected to track pre-pandemic baselines once the initial pandemic shift is accounted for.
- US living-donor series require allowance for a slower post-pandemic return when planning capacity.
- Forecasts at 4- to 12-week horizons remain well calibrated without external COVID burden data.
- Model selection can be performed scalably by restricting attention to the autoregressive-plus-calendar-plus-break specification class.
Where Pith is reading between the lines
- If the series are truly unconditional, transplant-system resilience depends more on internal operational factors than on real-time external pandemic metrics.
- The same BIC-screened count-model framework could be applied directly to other healthcare count processes that experienced one-time system shocks.
- Public-health interventions aimed at hospital staffing or donor registration campaigns may now be more relevant than further COVID-specific adjustments.
Load-bearing premise
The pre-specified pandemic-period level and slope indicators are sufficient to capture all relevant structural breaks, and BIC-selected models generalize reliably out of sample.
What would settle it
A statistically significant reduction in out-of-sample RMSE or improvement in 95 % predictive-interval coverage when COVID incidence or mortality covariates are added to the BIC-selected baseline model would falsify the claim of negligible incremental value.
Figures


read the original abstract
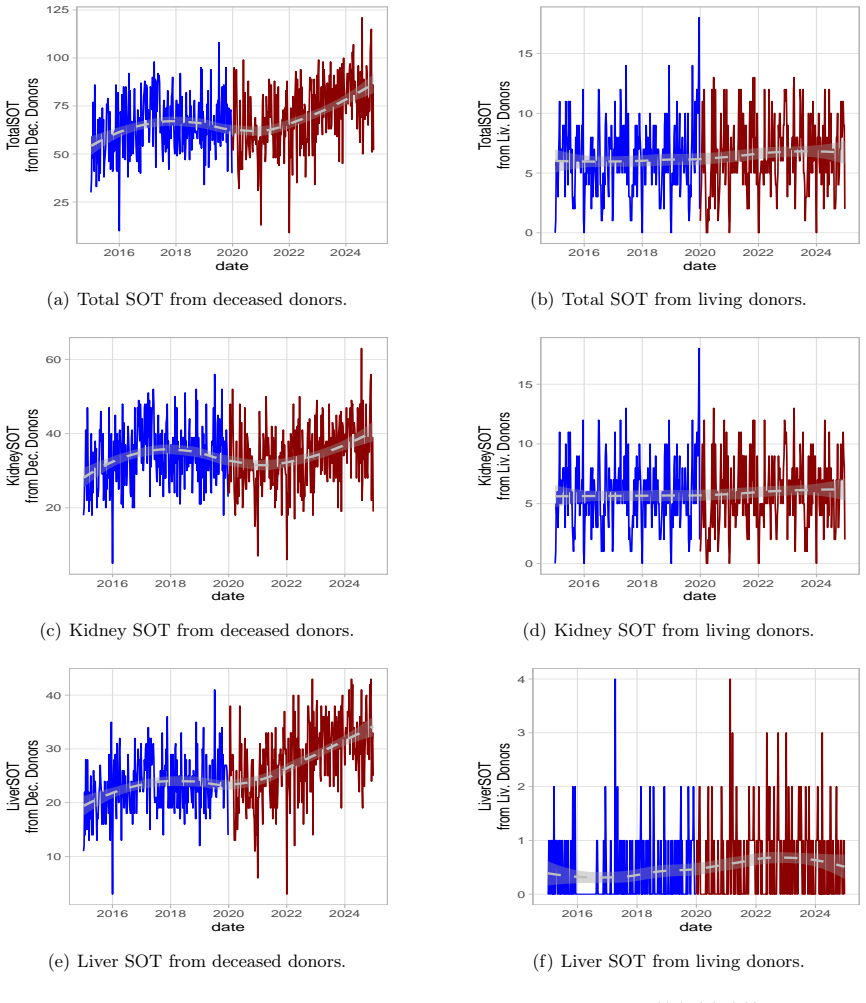
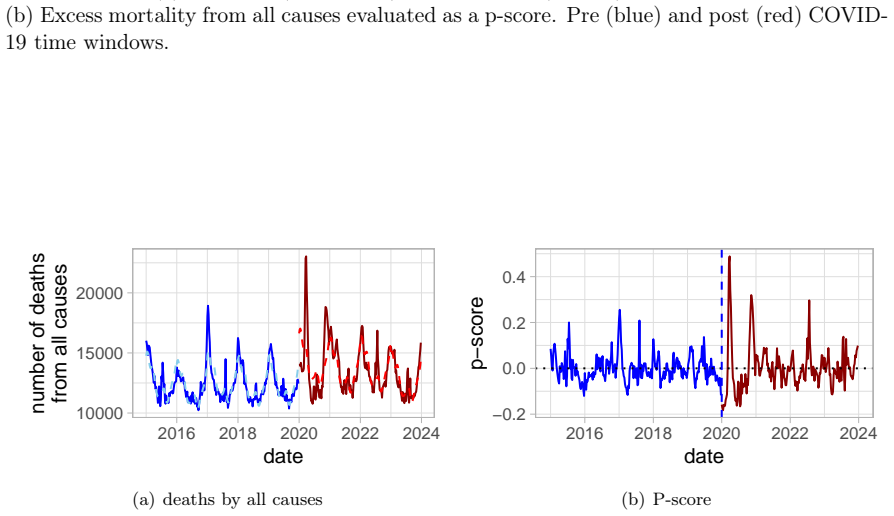
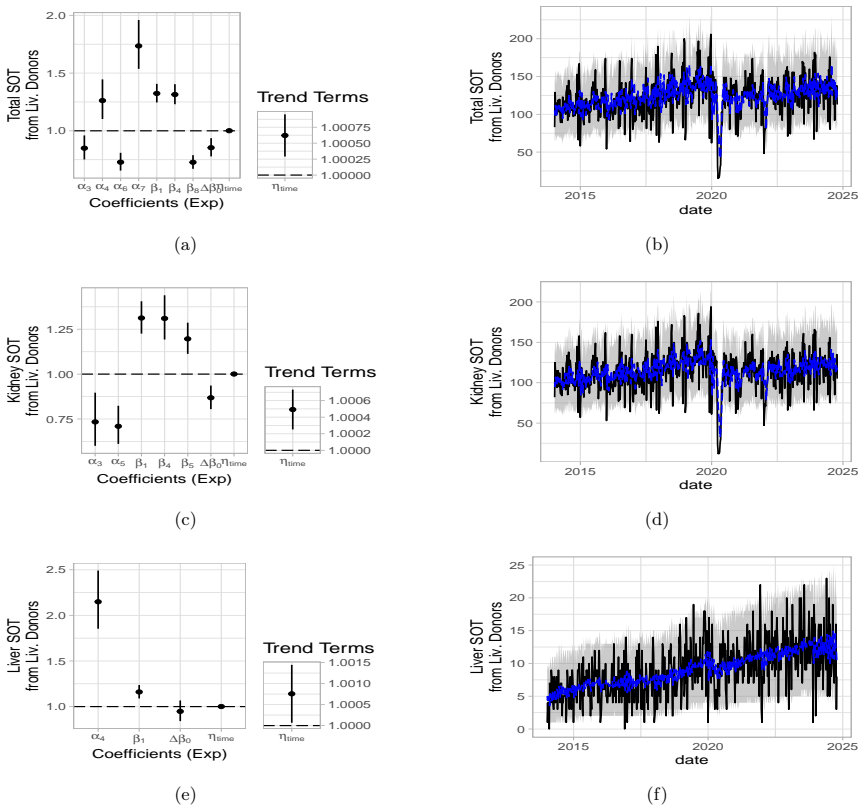
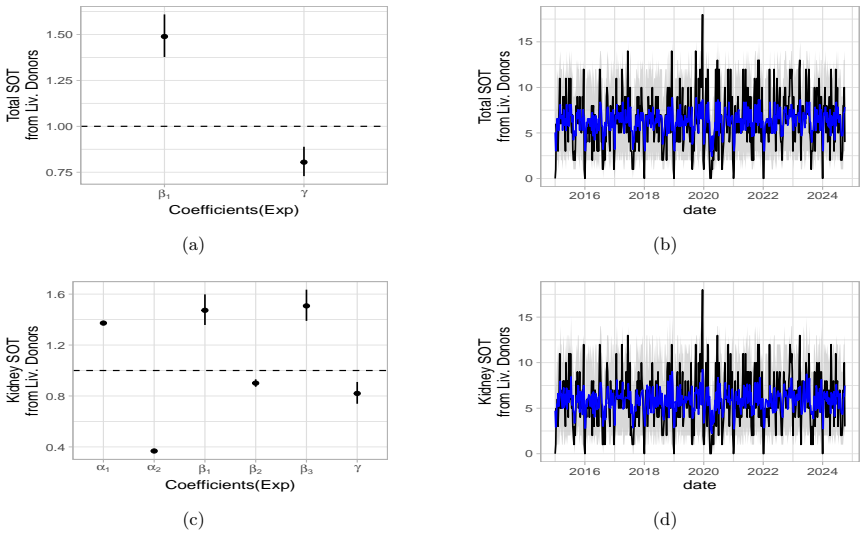
Weekly healthcare activity data are typically non-negative counts with temporal dependence and occasional system-wide disruptions, settings in which Gaussian time-series models may be inadequate. Solid organ transplant (SOT) activity provides a representative case study of a count process affected by a large external shock. We analyse weekly SOT counts in the USA and Italy from 2014 to October 2024, stratified by donor type (deceased vs living) and organ (kidney and liver). We fit Poisson and negative-binomial count time-series models incorporating short-term dynamics, calendar effects (holiday weeks), and pre-specified pandemic-period level and/or slope indicators. Candidate specifications are screened within a pre-defined portfolio and selected using BIC within each training window. Forecasting performance is evaluated with an expanding-window design at horizons $h\in\{4,8,12\}$ weeks. Alongside RMSE, we report empirical coverage of nominal $95\%$ predictive intervals and interval widths to summarise calibration and forecast uncertainty. Across strata, selected models capture substantial pandemic-period deviations and varying post-period trajectories. Deceased-donor series are broadly consistent with a return towards pre-pandemic baselines in both countries, whereas the US living-donor series shows a more gradual convergence in this application. Within the explored model class and validation protocol, auxiliary covariates representing COVID burden and mortality add limited incremental predictive contribution beyond autoregressive and calendar components. Our analysis shows that donation time series represent an unconditional phenomenon, with auxiliary variables having a statistically negligible impact on donations, thus allowing a focus on more practical aspects related to ongoing challenges in the post-pandemic era, such as hospital overloads and changes in public perception.
Editorial analysis
A structured set of objections, weighed in public.
Referee Report
Summary. The manuscript presents a protocol for scalable model selection in count time series subject to structural breaks, using Poisson and negative-binomial specifications that include autoregressive terms, calendar effects, and pre-specified pandemic-period level and/or slope indicators. Candidate models are screened in a fixed portfolio and chosen by BIC within each training window; performance is assessed via expanding-window forecasts at horizons 4, 8, and 12 weeks, reporting RMSE, 95% predictive-interval coverage, and interval width. Applied to weekly solid-organ transplant counts (deceased vs. living donors, kidney and liver) in the USA and Italy (2014–October 2024), the selected models indicate substantial pandemic deviations with varying post-pandemic trajectories; auxiliary COVID-burden and mortality covariates add negligible incremental value, supporting the claim that donation series behave as an unconditional process.
Significance. If the central empirical findings hold, the work supplies a transparent, reproducible workflow for handling count data with known external shocks in healthcare settings, together with concrete evidence on post-COVID recovery patterns that can guide operational planning around hospital capacity and public-perception factors. The expanding-window design, multi-metric evaluation, and explicit cross-country, cross-organ stratification are genuine strengths that enhance applicability.
major comments (2)
- [Abstract and §3] Abstract and §3 (model specification): the claim that auxiliary covariates exert 'statistically negligible impact' and that the series are 'unconditional' is load-bearing for the policy conclusion, yet rests on the pre-specified single pandemic-level and/or slope indicators being sufficient to absorb all break structure. No alternative break specifications (multiple change points, data-driven detection, or time-varying coefficients) are reported; if residual wave-specific or intensity-varying effects remain, the auxiliaries could still improve fit and forecasts once the break component is relaxed.
- [§4] §4 (forecast evaluation): the expanding-window RMSE, coverage, and width results are computed after BIC selection that includes the pre-specified indicators; this design does not isolate whether the auxiliaries would remain negligible if the break structure were allowed to be more flexible or if the indicators were omitted entirely.
minor comments (2)
- [Table 1] Table 1 (or equivalent data summary): the exact number of training windows and the precise start/end dates of each expanding-window evaluation should be stated explicitly so that the reported coverage and width statistics can be reproduced.
- [§3] Notation: the negative-binomial dispersion parameter is listed among the free parameters but its estimation method (profile likelihood, joint MLE, etc.) is not detailed; a brief sentence would remove ambiguity.
Simulated Author's Rebuttal
We thank the referee for the constructive comments on our manuscript. We address each major point below, clarifying the rationale for our pre-specified break approach while acknowledging limitations in scope.
read point-by-point responses
-
Referee: [Abstract and §3] Abstract and §3 (model specification): the claim that auxiliary covariates exert 'statistically negligible impact' and that the series are 'unconditional' is load-bearing for the policy conclusion, yet rests on the pre-specified single pandemic-level and/or slope indicators being sufficient to absorb all break structure. No alternative break specifications (multiple change points, data-driven detection, or time-varying coefficients) are reported; if residual wave-specific or intensity-varying effects remain, the auxiliaries could still improve fit and forecasts once the break component is relaxed.
Authors: Our protocol is explicitly designed around pre-specified pandemic indicators to capture known, system-wide shocks in a scalable and interpretable manner suitable for healthcare count data. The candidate portfolio includes models both with and without these indicators; BIC selection within each training window favors the break-inclusive specifications, indicating that they absorb the primary structural changes. Within this class, the auxiliary covariates add negligible predictive value. We did not examine data-driven multiple change points or time-varying coefficients, as these would depart from the transparent, pre-specified framework emphasized in the paper. We will add clarifying language in the abstract and §3 to state that conclusions hold conditional on the explored break specifications. revision: partial
-
Referee: [§4] §4 (forecast evaluation): the expanding-window RMSE, coverage, and width results are computed after BIC selection that includes the pre-specified indicators; this design does not isolate whether the auxiliaries would remain negligible if the break structure were allowed to be more flexible or if the indicators were omitted entirely.
Authors: The expanding-window protocol evaluates the full model-selection workflow as it would be applied in practice, where pandemic timing is known a priori and the selection procedure can choose to include or exclude the indicators. Because the portfolio contains indicator-free models and these are not selected by BIC, the results already indicate that the break terms are required for good performance. A separate evaluation that forces omission of the indicators or substitutes alternative break structures was not performed, as it lies outside the pre-specified protocol. We will insert a brief discussion in §4 noting this boundary condition on the reported negligible impact of auxiliaries. revision: partial
Circularity Check
No significant circularity detected
full rationale
The paper defines a pre-specified portfolio of Poisson/negative-binomial models that include fixed pandemic level/slope indicators plus autoregressive and calendar terms, screens candidates by BIC on each training window, and evaluates forecasts via independent expanding-window out-of-sample metrics (RMSE, coverage, width). The claim that auxiliary COVID covariates add limited incremental value is an empirical result obtained inside that fixed model class and validation protocol; it does not reduce by construction to the inputs, nor does it rely on self-citation load-bearing, uniqueness theorems, or renaming of known results. The out-of-sample design separates selection from evaluation, rendering the derivation self-contained.
Axiom & Free-Parameter Ledger
free parameters (3)
- Pandemic level and slope coefficients
- Autoregressive coefficients
- Negative binomial dispersion parameter
axioms (2)
- domain assumption Weekly transplant counts follow a Poisson or negative binomial distribution conditional on the mean structure including autoregressive terms, calendar effects, and pandemic indicators.
- domain assumption BIC provides a reliable basis for selecting models that perform well in out-of-sample forecasting within this class.
Reference graph
Works this paper leans on
-
[1]
Is it safe to receive kidneys from deceased kidney donors tested positive for covid-19 infection?Renal Failure, 43(1):1060–1062, 2021
Hatem Ali, Mahmoud Mohamed, Miklos Z Molnar, and Nithya Krishnan. Is it safe to receive kidneys from deceased kidney donors tested positive for covid-19 infection?Renal Failure, 43(1):1060–1062, 2021
2021
-
[2]
The covid-19 outbreak in italy: initial implications for organ transplantation programs.American Journal of Transplantation, 20(7):1780–1784, 2020
Roberta Angelico, Silvia Trapani, Tommaso Maria Manzia, Letizia Lombardini, Giuseppe Tisone, and Massimo Cardillo. The covid-19 outbreak in italy: initial implications for organ transplantation programs.American Journal of Transplantation, 20(7):1780–1784, 2020. 23
2020
-
[3]
Apandemicprimer onexcessmortalitystatisticsandtheircomparabilityacrosscountries.Our World in Data,
JanineAron, JohnMuellbauer, CharlieGiattino, andHannahRitchie. Apandemicprimer onexcessmortalitystatisticsandtheircomparabilityacrosscountries.Our World in Data,
-
[4]
https://ourworldindata.org/covid-excess-mortality
-
[5]
COVID-19 pandemic and worldwide organ transplantation: a population-based study
Olivier Aubert, Daniel Yoo, Dina Zielinski, Emanuele Cozzi, Massimo Cardillo, Michael Dürr, Beatriz Domínguez-Gil, Elisabeth Coll, Margarida Ivo Da Silva, Ville Sallinen, et al. COVID-19 pandemic and worldwide organ transplantation: a population-based study. The Lancet Public Health, 6(10):e709–e719, 2021. ISSN 2468-2667. doi: https://doi. org/10.1016/S24...
-
[6]
Vasiliki Christou and Konstantinos Fokianos. Quasi-likelihood inference for negative bino- mial time series models.Journal of Time Series Analysis, 35(1):55–78, 2014. doi: https: //doi.org/10.1111/jtsa.12050. URLhttps://onlinelibrary.wiley.com/doi/abs/10. 1111/jtsa.12050
-
[7]
COVID-19 in transplant recipients: the Spanish experience.American Journal of Transplantation, 21(5):1825–1837, 2021
Elisabeth Coll, Mario Fernández-Ruiz, J Emilio Sánchez-Álvarez, José R Martínez- Fernández, Marta Crespo, Jorge Gayoso, Teresa Bada-Bosch, Federico Oppenheimer, Francesc Moreso, Maria O Lopez-Oliva, et al. COVID-19 in transplant recipients: the Spanish experience.American Journal of Transplantation, 21(5):1825–1837, 2021
2021
-
[8]
Log-linear Poisson autoregression.Journal of Multivariate Analysis, 102(3):563–578, 2011
Konstantinos Fokianos and Dag Tjøstheim. Log-linear Poisson autoregression.Journal of Multivariate Analysis, 102(3):563–578, 2011. ISSN 0047-259X. doi: https://doi.org/ 10.1016/j.jmva.2010.11.002. URLhttps://www.sciencedirect.com/science/article/ pii/S0047259X10002320
-
[9]
Milo Gatti, Matteo Rinaldi, Linda Bussini, Cecilia Bonazzetti, Renato Pascale, Zeno Pasquini, Francesca Faní, Mariana Nunes Pinho Guedes, Anna Maria Azzini, Elena Car- rara, et al. Clinical outcome in solid organ transplant recipients affected by COVID-19 compared to general population: a systematic review and meta-analysis.Clinical Micro- biology and Inf...
2022
-
[10]
URL https://doi.org/10.1198/016214506000001437
Tilmann Gneiting and Adrian E Raftery. Strictly proper scoring rules, prediction, and estimation.Journal of the American Statistical Association, 102(477):359–378, 2007. doi: 10.1198/016214506000001437. URLhttps://doi.org/10.1198/016214506000001437
-
[11]
Mireille Hantouche, Libia Lara Carrion, Emilio Porcu, and Katrina A. Bramstedt. The effect of the COVID-19 pandemic on deceased and living organ donors in the united states of america.Scientific Reports, 12(1):20651, 2022. doi: 10.1038/s41598-022-24351-x. URL https://doi.org/10.1038/s41598-022-24351-x
-
[12]
Hilbe.Modeling Count Data
Joseph M. Hilbe.Modeling Count Data. Cambridge University Press, 2014. 24
2014
-
[13]
Ban Ibrahim, Rosanne Dawson, Jennifer A. Chandler, Aviva Goldberg, David Hartell, Laura Hornby, Christy Simpson, Matthew-John Weiss, Lindsay C. Wilson, T. Murray Wilson, and Marie-Chantal Fortin. The COVID-19 pandemic and organ donation and transplantation: ethical issues.BMC Medical Ethics, 22(1):142, 2021. doi: 10.1186/ s12910-021-00711-6. URLhttps://do...
-
[14]
Tracking excess mortality across countries during the covid-19 pandemic with the world mortality dataset.elife, 10:e69336, 2021
Ariel Karlinsky and Dmitry Kobak. Tracking excess mortality across countries during the covid-19 pandemic with the world mortality dataset.elife, 10:e69336, 2021
2021
-
[15]
Vivek B. Kute, Stefan G. Tullius, Hemant Rane, Sanshriti Chauhan, Vineet Mishra, and Hari Shankar Meshram. Global impact of the COVID-19 pandemic on Solid Organ Trans- plant.Transplantation Proceedings, 54(6):1412–1416, 2022. ISSN 0041-1345. doi: https: //doi.org/10.1016/j.transproceed.2022.02.009. URLhttps://www.sciencedirect.com/ science/article/pii/S00...
-
[16]
Tobias Liboschik, Konstantinos Fokianos, and Roland Fried. tscount: An R package for analysis of count time series following Generalized Linear Models.Journal of Statistical Software, 82:1–51, 2017. ISSN 1548-7660. doi: 10.18637/jss.v082.i05. URLhttps: //doi.org/10.18637/jss.v082.i05
-
[17]
Raquel Martinez-Reviejo, Sofia Tejada, Ana Cipriano, Hanife Nur Karakoc, Oriol Manuel, and Jordi Rello. Solid organ transplantation from donors with recent or current SARS- CoV-2 infection: A systematic review.Anaesthesia Critical Care & Pain Medicine, 41(4): 101098, 2022. ISSN 2352-5568. doi: https://doi.org/10.1016/j.accpm.2022.101098. URL https://www.s...
-
[18]
Antonello Maruotti, Giovanna Jona-Lasinio, Fabio Divino, Gianfranco Lovison, Mas- simo Ciccozzi, and Alessio Farcomeni. Estimating COVID-19-induced excess mortality in Lombardy, Italy.Aging Clinical and Experimental Research, 34(2):475–479, 2022. doi: 10.1007/s40520-021-02060-1. URLhttps://doi.org/10.1007/s40520-021-02060-1
-
[19]
Mills.Applied Time Series Analysis, A Practical Guide to Modeling and Forecasting
Terence C. Mills.Applied Time Series Analysis, A Practical Guide to Modeling and Forecasting. Academic Press, Elsevier, 2019
2019
-
[20]
Ailish Nimmo, Dale Gardiner, Ines Ushiro-Lumb, Rommel Ravanan, and John L. R. Forsythe. The global impact of COVID-19 on solid organ transplan- tation: Two years into a pandemic.Transplantation, 106(7), 2022. URL https://journals.lww.com/transplantjournal/fulltext/2022/07000/the_global_ impact_of_covid_19_on_solid_organ.10.aspx
2022
-
[21]
R Foundation for Statistical Computing, Vienna, Austria, 2024
R Core Team.R: A Language and Environment for Statistical Computing. R Foundation for Statistical Computing, Vienna, Austria, 2024. URLhttps://www.R-project.org/. 25
2024
-
[22]
State of the art in parallel computing with r.Journal of Statistical Software, 31:1–27, 2009
Markus Schmidberger, Martin Morgan, Dirk Eddelbuettel, Hao Yu, Luke Tierney, and Ulrich Mansmann. State of the art in parallel computing with r.Journal of Statistical Software, 31:1–27, 2009
2009
-
[23]
The Annals of Statistics , author =
Gideon Schwarz. Estimating the Dimension of a Model.The Annals of Statistics, 6(2): 461 – 464, 1978. doi: 10.1214/aos/1176344136. URLhttps://doi.org/10.1214/aos/ 1176344136
-
[24]
Estimating the dimension of a model.The annals of statistics, pages 461–464, 1978
Gideon Schwarz. Estimating the dimension of a model.The annals of statistics, pages 461–464, 1978
1978
-
[25]
Alejandro Suarez-Pierre, Rashikh Choudhury, Adam M. Carroll, Robert W. King, John Iguidbashian, Jake Cotton, Kathryn L. Colborn, Peter T. Kennealey, Joseph C. Cleve- land, Elizabeth Pomfret, and David A. Fullerton. Measuring the effect of the COVID-19 pandemic on solid organ transplantation.The American Journal of Surgery, 224(1, Part B):437–442, 2022. IS...
-
[26]
Silvia Trapani, Lucia Masiero, Francesca Puoti, Maria C Rota, Martina Del Manso, Letizia Lombardini, Flavia Riccardo, Antonio Amoroso, Patrizio Pezzotti, Paolo A Grossi, et al. Incidence and outcome of sars-cov-2 infection on solid organ transplantation recipi- ents: a nationwide population-based study.American Journal of Transplantation, 21(7): 2509–2521, 2021
2021
-
[27]
Johan Verbeeck, Christel Faes, Thomas Neyens, Niel Hens, Geert Verbeke, Patrick Deboosere, and Geert Molenberghs. A Linear Mixed Model to Estimate COVID-19- Induced Excess Mortality.Biometrics, 79(1):417–425, 10 2021. ISSN 0006-341X. doi: 10.1111/biom.13578. URLhttps://doi.org/10.1111/biom.13578
-
[28]
COVID-19 in solid organ transplantation: results of the national COVID cohort collaborative.Transplantation direct, 7(11):e775, 2021
Amanda J Vinson, Gaurav Agarwal, Ran Dai, Alfred J Anzalone, Stephen B Lee, Evan French, Amy Olex, Vithal Madhira, and Roslyn B Mannon. COVID-19 in solid organ transplantation: results of the national COVID cohort collaborative.Transplantation direct, 7(11):e775, 2021
2021
-
[29]
Leaving No One Behind: Methods for Sustainability
WHO. COVID-19 dashboard. List of abbreviations BICBayesian Information Criterion CNTNational Transplant Centre (Centro Nazionale Trapianti) ISSIstituto Superiore di Sanità 26 IST A TItalian National Institute of Statistics NA TNucleic acid test OECDOrganisation for Economic Co-operation and Development RMSERoot Mean Square Error SOTSolid organ transplant ...
1919
discussion (0)
Sign in with ORCID, Apple, or X to comment. Anyone can read and Pith papers without signing in.