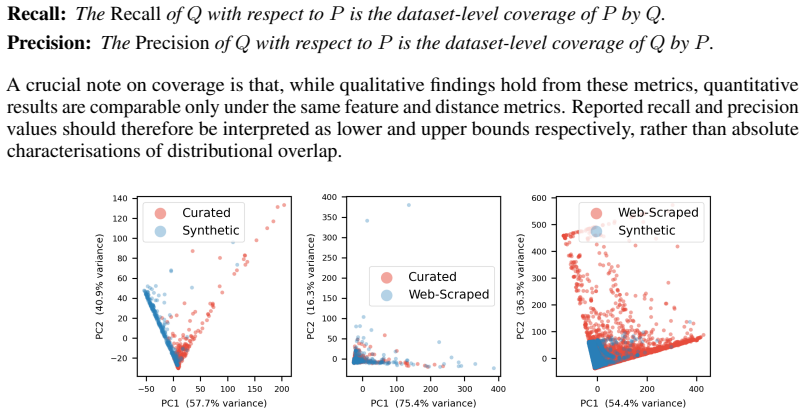
Recognition: unknown
Mind the Gap? A Distributional Comparison of Real and Synthetic Priors for Tabular Foundation Models
Pith reviewed 2026-05-08 09:51 UTC · model grok-4.3
The pith
The distributional gap between synthetic and real tabular data does not affect TabICL generalization performance.
A machine-rendered reading of the paper's core claim, the machinery that carries it, and where it could break.
Core claim
The TabICL synthetic prior occupies a narrow region of the space of real tables that cannot be closed by optimising prior hyper-parameters across more than 86 thousand configurations. Curated and web-scraped corpora are broadly interchangeable on a distributional level in feature space. Surprisingly, the distributional gap between synthetic pre-training data and real tables has a clearly detectable effect on performance under neither feature-based proximity measures or TabICL's own internal representations, suggesting that coverage of the real-data distribution is not the primary driver of TabICL's generalisation.
What carries the argument
Aggregate features over whole tables, columns and correlations, compared through discriminator AUCs and k-NN coverage metrics.
Load-bearing premise
The chosen aggregate features over whole tables, columns, and correlations capture the distributional aspects that actually drive model performance and generalization on downstream tasks.
What would settle it
Retrain TabICL on a prior whose aggregate-feature distribution is deliberately matched to real tables and measure whether downstream task accuracy rises relative to the original synthetic prior.
Figures


read the original abstract
Tabular foundation models are pre-trained on one of three classes of corpus: curated datasets drawn from benchmark repositories, tables harvested at scale from the web, or synthetic tables sampled from a parametric generative prior. Despite the centrality of pre-training data to model performance, little is known about how these corpora relate to one another in distribution, and the impact this has on downstream performance. In this work we take three canonical, archetypal datasets used to train tabular foundation models; the T4 dataset represents web-scraped corpora, the TabFM dataset curated tables from Kaggle, and the TabICL dataset as the only well-used synthetic prior with publicly available parameters. We characterise each corpus using aggregate features over whole tables, columns and correlations, and compare them using discriminator AUCs and k-NN coverage metrics. We find that the TabICL synthetic prior occupies a narrow region of the space of real tables, that this mismatch cannot be closed by optimising prior hyper-parameters across more than 86 thousand configurations, and that curated and web-scraped corpora are broadly interchangeable on a distributional level in feature space. Surprisingly, the distributional gap between synthetic pre-training data and real tables has a clearly detectable effect on performance under neither feature-based proximity measures or TabICL's own internal representations, suggesting that coverage of the real-data distribution is not the primary driver of TabICL's generalisation.
Editorial analysis
A structured set of objections, weighed in public.
Referee Report
Summary. The manuscript presents an empirical analysis comparing the distributional characteristics of three pre-training datasets for tabular foundation models: T4 (web-scraped), TabFM (curated from Kaggle), and TabICL (synthetic with public parameters). By extracting aggregate features from entire tables, individual columns, and correlations, and employing discriminator AUCs and k-NN coverage metrics, the authors conclude that the synthetic TabICL prior covers only a narrow subset of the real table distribution, a gap that persists despite optimizing the prior's hyperparameters over more than 86,000 configurations. Real corpora (curated and web-scraped) are found to be largely interchangeable in feature space. A key surprising result is that this distributional mismatch does not manifest in performance differences when using feature-based proximity or TabICL's internal representations, leading to the suggestion that real-data coverage is not the main factor in TabICL's generalization capabilities.
Significance. If the results hold, this work is significant for tabular foundation model research because it empirically challenges the assumption that closer distributional coverage of real data is essential for generalization. The extensive hyperparameter optimization (over 86k configurations), use of multiple comparison metrics, and public release of TabICL prior parameters are strengths that support reproducibility and allow others to build on the analysis. The finding could usefully redirect attention from data curation efforts toward other potential drivers of performance such as model architecture or optimization procedures.
major comments (1)
- [Abstract] Abstract: the central claim that the distributional gap has 'no detectable effect on performance' under feature-based proximity measures or TabICL's internal representations (and thus that coverage is not the primary driver of generalization) is load-bearing and rests on the sufficiency of the chosen aggregate features over whole tables, columns, and correlations. If these features omit higher-order dependencies, conditional distributions, or other properties actually used by TabICL, the null performance result could reflect insensitive metrics rather than irrelevance of coverage. The manuscript should include a validation step showing that these features predict or correlate with downstream task performance differences.
minor comments (1)
- The abstract states 'more than 86 thousand configurations' without the exact count or the ranges of the optimized hyperparameters; adding these details would improve reproducibility.
Simulated Author's Rebuttal
We thank the referee for their constructive and detailed review. The major comment highlights a valid concern about the sufficiency of our chosen metrics for supporting the central claim. We respond point by point below and outline the revisions we will make.
read point-by-point responses
-
Referee: [Abstract] Abstract: the central claim that the distributional gap has 'no detectable effect on performance' under feature-based proximity measures or TabICL's internal representations (and thus that coverage is not the primary driver of generalization) is load-bearing and rests on the sufficiency of the chosen aggregate features over whole tables, columns, and correlations. If these features omit higher-order dependencies, conditional distributions, or other properties actually used by TabICL, the null performance result could reflect insensitive metrics rather than irrelevance of coverage. The manuscript should include a validation step showing that these features predict or correlate with downstream task performance differences.
Authors: We agree that aggregate features over tables, columns, and correlations may not exhaustively capture all higher-order dependencies or conditional distributions. However, our performance analysis is not limited to these hand-crafted features: we also evaluate proximity using TabICL's internal representations, which are produced by the model itself and therefore encode precisely the dependencies and properties that TabICL uses for its own predictions. The absence of a detectable performance effect even under this model-specific metric provides independent support for the claim that coverage of the real-data distribution is not the primary driver of generalization. We will add the requested validation step in the revised manuscript by reporting the correlation between our aggregate features and downstream task performance differences across a range of benchmark tasks, thereby demonstrating the sensitivity of the chosen metrics. revision: yes
Circularity Check
No circularity detected in empirical dataset comparison
full rationale
The paper conducts an empirical characterization of three tabular corpora (T4, TabFM, TabICL) via aggregate features on whole tables, columns, and correlations, followed by direct comparisons using discriminator AUCs, k-NN coverage, hyperparameter sweeps over 86k configurations, and downstream performance checks against feature proximity and TabICL internal representations. No equations, fitted parameters renamed as predictions, self-citations serving as load-bearing uniqueness theorems, or ansatzes smuggled via prior work appear in the derivation chain. All claims reduce to observable measurements on external datasets rather than self-referential definitions or constructions, making the analysis self-contained.
Axiom & Free-Parameter Ledger
axioms (1)
- domain assumption Aggregate features over tables, columns, and correlations sufficiently capture the distributional properties that matter for downstream model performance.
Reference graph
Works this paper leans on
-
[1]
OPTUNA: a next-generation hyperparameter optimization framework
T. Akiba, S. Sano, T. Yanase, T. Ohta, and M. Koyama. Optuna: A Next-generation Hyper- parameter Optimization Framework. InProceedings of the 25th ACM SIGKDD International Conference on Knowledge Discovery & Data Mining, KDD ’19, pages 2623–2631, New York, NY , USA, July 2019. Association for Computing Machinery. ISBN 978-1-4503-6201-6. doi: 10.1145/32925...
-
[2]
L. Akoglu, M. McGlohon, and C. Faloutsos. RTM: Laws and a recursive generator for weighted time-evolving graphs. InProceedings - IEEE international conference on data mining, ICDM, pages 701–706, 2008. ISBN 978-0-7695-3502-9. doi: 10.1109/ICDM.2008.123
-
[3]
S. D. Bay, D. Kibler, M. J. Pazzani, and P. Smyth. The UCI KDD archive of large data sets for data mining research and experimentation.SIGKDD Explor. Newsl., 2(2):81–85, Dec. 2000. ISSN 1931-0145. doi: 10.1145/380995.381030. URL https://dl.acm.org/doi/10.1145/ 380995.381030
-
[4]
A. Borji. Pros and cons of GAN evaluation measures.Computer Vision and Image Under- standing, 179:41–65, Feb. 2019. ISSN 1077-3142. doi: 10.1016/j.cviu.2018.10.009. URL https://www.sciencedirect.com/science/article/pii/S1077314218304272
- [5]
-
[6]
L. Breiman. Random Forests.Machine Learning, 45(1):5–32, Oct. 2001. ISSN 1573-0565. doi: 10.1023/A:1010933404324. URLhttps://doi.org/10.1023/A:1010933404324
-
[7]
XGBoost: A Scalable Tree Boosting System
T. Chen and C. Guestrin. XGBoost: A Scalable Tree Boosting System. InProceedings of the 22nd ACM SIGKDD International Conference on Knowledge Discovery and Data Mining, KDD ’16, pages 785–794, New York, NY , USA, Aug. 2016. Association for Computing Machinery. ISBN 978-1-4503-4232-2. doi: 10.1145/2939672.2939785. URL https://dl.acm.org/ doi/10.1145/293967...
-
[8]
Cortes and V
C. Cortes and V . Vapnik. Support-vector networks.Machine Learning, 20(3):273–297, Sept
-
[9]
ISSN 1573-0565. doi: 10.1007/BF00994018. URL https://doi.org/10.1007/ BF00994018
-
[10]
A. V . Dorogush, V . Ershov, and A. Gulin. CatBoost: gradient boosting with categorical features support, Oct. 2018. URLhttp://arxiv.org/abs/1810.11363. arXiv:1810.11363 [cs]
work page Pith review arXiv 2018
-
[11]
TabLib: A Dataset of 627M Tables with Context, October 2023
G. Eggert, K. Huo, M. Biven, and J. Waugh. TabLib: A Dataset of 627M Tables with Context, Oct. 2023. URLhttp://arxiv.org/abs/2310.07875. arXiv:2310.07875 [cs]
-
[12]
AutoGluon-Tabular: Robust and Accurate AutoML for Structured Data
N. Erickson, J. Mueller, A. Shirkov, H. Zhang, P. Larroy, M. Li, and A. Smola. AutoGluon- Tabular: Robust and Accurate AutoML for Structured Data, Mar. 2020. URLhttp://arxiv. org/abs/2003.06505. arXiv:2003.06505 [stat]
work page internal anchor Pith review arXiv 2020
-
[13]
Gardner, J
J. Gardner, J. C. Perdomo, and L. Schmidt. Large Scale Transfer Learning for Tabular Data via Language Modeling. InAdvances in Neural Information Pro- cessing Systems, volume 37, pages 45155–45205, Dec. 2024. doi: 10.52202/ 079017-1435. URL https://proceedings.neurips.cc/paper_files/paper/2024/ hash/4fd5cfd2e31bebbccfa5ffa354c04bdc-Abstract-Conference.html
2024
-
[14]
I. J. Goodfellow, J. Pouget-Abadie, M. Mirza, B. Xu, D. Warde-Farley, S. Ozair, A. Courville, and Y . Bengio. Generative Adversarial Nets. InAdvances in Neural Information Processing Systems, volume 27. Curran Associates, Inc., 2014. URL https://proceedings.neurips. cc/paper/2014/hash/f033ed80deb0234979a61f95710dbe25-Abstract.html. 10
2014
-
[15]
Helli, D
K. Helli, D. Schnurr, N. Hollmann, S. Müller, and F. Hutter. Drift-resilient TabPFN: in-context learning temporal distribution shifts on tabular data. InProceedings of the 38th International Conference on Neural Information Processing Systems, volume 37 ofNIPS ’24, pages 98742– 98781, Red Hook, NY , USA, Dec. 2024. Curran Associates Inc. ISBN 979-8-3313-1438-5
2024
-
[16]
Accurate predictions on small data with a tabular foundation model.Nature, 637(8045):319–326, 2025
N. Hollmann, S. Müller, L. Purucker, A. Krishnakumar, M. Körfer, S. B. Hoo, R. T. Schirrmeis- ter, and F. Hutter. Accurate predictions on small data with a tabular foundation model.Nature, 637(8045):319–326, Jan. 2025. ISSN 1476-4687. doi: 10.1038/s41586-024-08328-6. URL https://www.nature.com/articles/s41586-024-08328-6 . Publisher: Nature Publish- ing Group
-
[17]
J.-P. Jiang, S.-Y . Liu, H.-R. Cai, Q.-L. Zhou, and H.-J. Ye. Representation Learning for Tabular Data: A Comprehensive Survey.IEEE Transactions on Pattern Analysis and Machine Intelligence, pages 1–20, 2026. ISSN 1939-3539. doi: 10.1109/TPAMI.2026.3657217. URL https://ieeexplore.ieee.org/abstract/document/11369258
-
[18]
G. Ke, Q. Meng, T. Finley, T. Wang, W. Chen, W. Ma, Q. Ye, and T.-Y . Liu. LightGBM: a highly efficient gradient boosting decision tree. InProceedings of the 31st International Conference on Neural Information Processing Systems, NIPS’17, pages 3149–3157, Red Hook, NY , USA, Dec. 2017. Curran Associates Inc. ISBN 978-1-5108-6096-4. URLhttps: //dl.acm.org/...
-
[19]
Kynkäänniemi, T
T. Kynkäänniemi, T. Karras, S. Laine, J. Lehtinen, and T. Aila. Improved Precision and Recall Metric for Assessing Generative Models. InAdvances in Neural Information Processing Systems, volume 32. Curran Associates, Inc., 2019. URL https://proceedings.neurips. cc/paper/2019/hash/0234c510bc6d908b28c70ff313743079-Abstract.html
2019
-
[20]
Liu, H.-R
S.-Y . Liu, H.-R. Cai, Q.-L. Zhou, H.-H. Yin, T. Zhou, J.-P. Jiang, and H.-J. Ye. Talent: A Tabular Analytics and Learning Toolbox.Journal of Machine Learning Research, 26(226):1–16, 2025. ISSN 1533-7928. URLhttp://jmlr.org/papers/v26/25-0512.html
2025
-
[21]
M. F. Naeem, S. J. Oh, Y . Uh, Y . Choi, and J. Yoo. Reliable Fidelity and Diversity Metrics for Generative Models. InProceedings of the 37th International Conference on Machine Learning, pages 7176–7185. PMLR, Nov. 2020. URL https://proceedings.mlr.press/ v119/naeem20a.html
2020
-
[22]
J. Qu, D. Holzmüller, G. Varoquaux, and M. L. Morvan. TabICL: A Tabular Foundation Model for In-Context Learning on Large Data. InProceedings of the 42nd International Conference on Machine Learning, pages 50817–50847. PMLR, Oct. 2025. URL https: //proceedings.mlr.press/v267/qu25d.html
2025
-
[23]
H. O. Quinn, M. Sedky, J. Francis, and M. Streeton. Literature Review of Explain- able Tabular Data Analysis.Electronics, 13(19), Sept. 2024. ISSN 2079-9292. doi: 10.3390/electronics13193806. URLhttps://www.mdpi.com/2079-9292/13/19/3806
-
[24]
M. S. M. Sajjadi, O. Bachem, M. Lucic, O. Bousquet, and S. Gelly. Assessing Generative Models via Precision and Recall. InAdvances in Neural Information Processing Systems, volume 31. Curran Associates, Inc., 2018. URL https://proceedings.neurips.cc/paper/2018/ hash/f7696a9b362ac5a51c3dc8f098b73923-Abstract.html
2018
-
[25]
Tabular data: Deep learning is not all you need.Informa- tion Fusion, 81:84–90, May 2022
R. Shwartz-Ziv and A. Armon. Tabular data: Deep learning is not all you need.Information Fusion, 81:84–90, May 2022. ISSN 1566-2535. doi: 10.1016/j.inffus.2021.11.011. URL https://www.sciencedirect.com/science/article/pii/S1566253521002360
-
[26]
J. Vanschoren, J. N. van Rijn, B. Bischl, and L. Torgo. OpenML: networked science in machine learning.SIGKDD Explor. Newsl., 15(2):49–60, June 2014. ISSN 1931-0145. doi: 10.1145/2641190.2641198. URL https://dl.acm.org/doi/10.1145/2641190.2641198
-
[27]
X. Wen, H. Zhang, S. Zheng, W. Xu, and J. Bian. From Supervised to Generative: A Novel Paradigm for Tabular Deep Learning with Large Language Models. InProceedings of the 30th ACM SIGKDD Conference on Knowledge Discovery and Data Mining, KDD ’24, pages 3323–3333, New York, NY , USA, Aug. 2024. Association for Computing Machinery. ISBN 979-8-4007-0490-1. d...
-
[28]
X. Zhang, D. C. Maddix, J. Yin, N. Erickson, A. F. Ansari, B. Han, S. Zhang, L. Akoglu, C. Faloutsos, M. W. Mahoney, C. Hu, H. Rangwala, G. Karypis, and B. Wang. Mitra: Mixed Synthetic Priors for Enhancing Tabular Foundation Models, Oct. 2025. URL http://arxiv. org/abs/2510.21204. arXiv:2510.21204 [cs]
-
[29]
X. Zhang, G. Ren, H. Yu, H. Yuan, H. Wang, J. Li, J. Wu, L. Mo, L. Mao, M. Hao, N. Dai, R. Xu, S. Li, T. Zhang, Y . He, Y . Wang, Y . Zhang, Z. Xu, D. Li, F. Gao, H. Zou, J. Liu, J. Liu, J. Xu, K. Cheng, K. Li, L. Zhou, Q. Li, S. Fan, X. Lin, X. Han, X. Li, Y . Lu, Y . Xue, Y . Jiang, Z. Wang, Z. Wang, and P. Cui. LimiX: Unleashing Structured-Data Modelin...
-
[30]
extended it, with Mitra offering the most principled treatment by selecting mixture components via a formal diversity-and-performance criterion. Notably, only three of the seven priors surveyed (TabForestPFN [5], Drift-Resilient TabPFN [14], and TabICL v1 [21]) have released their generation code; the remainder describe their priors in varying levels of p...
-
[31]
Selection: fill remaining slots via tournament selection with k= 3 competitors; the individual with the lowest AUC wins
-
[32]
Crossover: pairs of selected parents produce offspring by sampling each parameter uni- formly from either parent
-
[33]
Con- tinuous parameters receive Gaussian noise N(0,0.1·(hi−lo)) ; integer parameters use N(0,(hi−lo)/6); categorical parameters are resampled uniformly
Mutation: each parameter is independently mutated with probability pmut = 0.5 . Con- tinuous parameters receive Gaussian noise N(0,0.1·(hi−lo)) ; integer parameters use N(0,(hi−lo)/6); categorical parameters are resampled uniformly. ResultsNeither the Bayesian nor genetic optimisation is able to significantly decrease the AUC of a discriminator, despite e...
discussion (0)
Sign in with ORCID, Apple, or X to comment. Anyone can read and Pith papers without signing in.