Recognition: unknown
First time delay observation between two mid-infrared channels in solar flare footpoints
Pith reviewed 2026-05-08 05:11 UTC · model grok-4.3
The pith
Mid-infrared emission at 8.2 micrometers peaks 0.3 to 0.45 seconds before 5.2 micrometers in solar flare footpoints.
A machine-rendered reading of the paper's core claim, the machinery that carries it, and where it could break.
Core claim
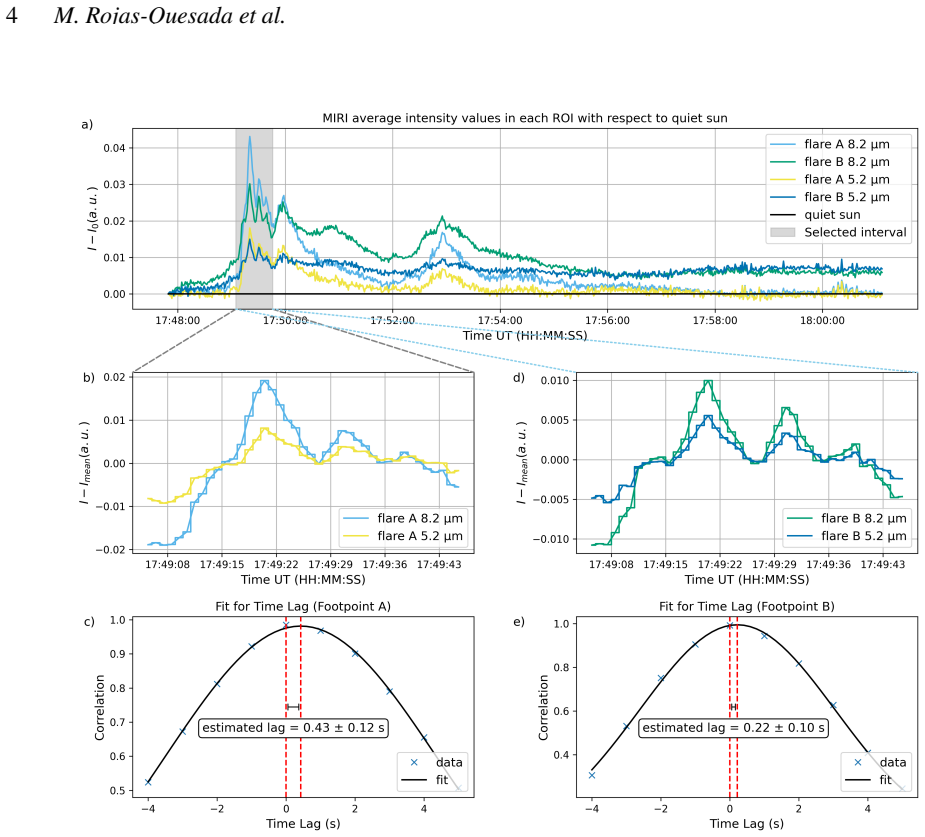
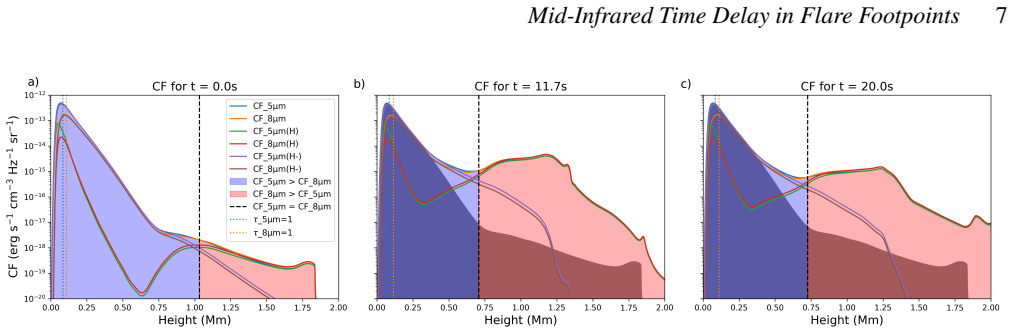
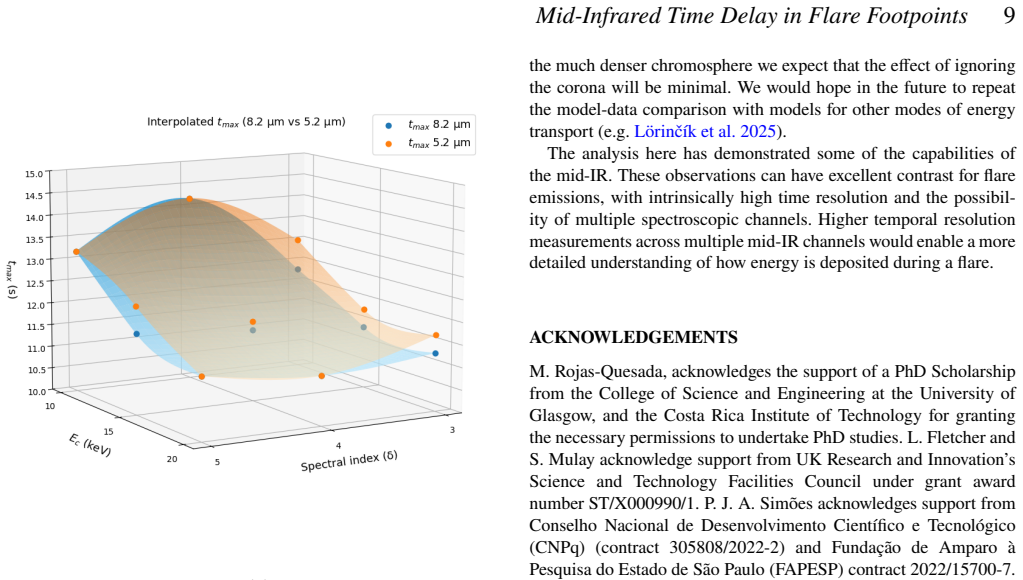
Using a local cross-correlation function on time series from resolved flare footpoints, the 8.2 μm channel peaks 0.3–0.45 s before the 5.2 μm channel. RADYN simulations generate matching theoretical lags, with the difference arising because flare-induced ionization alters opacity such that longer wavelengths show a smaller time offset between the peak of energy injection and the peak of emitted intensity.
What carries the argument
Local cross-correlation function applied to paired 5.2 μm and 8.2 μm light curves, cross-checked against RADYN radiation-hydrodynamics calculations of wavelength-dependent opacity evolution in the chromosphere.
If this is right
- Longer mid-IR wavelengths exhibit a smaller lag between energy-injection peak and intensity peak.
- The measured lags act as a diagnostic for how quickly the chromosphere responds at different depths.
- Higher-cadence mid-IR data could map the vertical structure of flare heating through these wavelength-dependent offsets.
Where Pith is reading between the lines
- Repeated measurements across multiple flares could test whether the lag range is universal or depends on flare class and energy input.
- Pairing the method with other chromospheric diagnostics might constrain the height at which energy is deposited.
- The approach offers a direct observational test of how radiation-hydrodynamics codes handle prompt ionization and opacity changes.
Load-bearing premise
The local cross-correlation isolates genuine physical lags rather than artifacts from noise or instruments, and the RADYN code correctly models how ionization changes opacity at each wavelength.
What would settle it
A new flare observation in which the measured lag between the two mid-IR channels lies outside the range produced by RADYN runs for any plausible energy-deposition profile.
Figures


read the original abstract
The strong correlation between energy injection and mid-infrared (mid-IR) emission observed during solar flares can be used to probe energy deposition throughout the chromosphere, since the IR tracks prompt flare-induced changes in electron density. Despite its diagnostic value, solar mid-IR observations are relatively recent, with sporadic campaigns over the last decade resulting in only a few recorded flares. Earlier studies found time lags between mid-IR emissions from spatially resolved footpoints, offering clues about flare energy transport. Building on this, we analyse the time lags between emissions at two wavelengths (5.2 micrometers and 8.2 micrometers) for each footpoint. Using a local cross-correlation function, we show for the first time that the 8.2 micrometers emission channel peaks 0.3 s-0.45 s before the 5.2 micrometer channel. We investigate the origin of this lag, obtaining infrared emission estimates using results from the RADYN radiation hydrodynamics code. The theoretical lag values fall within the range of the observed ones. Variations in opacity-primarily due to flare-induced ionization-explain the wavelength-dependent temporal shift between emission maxima. In particular, longer wavelengths exhibit a smaller lag between the peak of energy injection and peak of intensity. These results contribute to a better understanding of how energy deposition during a flare affects the chromospheric layers of the atmosphere. Future observations with higher temporal resolution could exploit measurements of these time lags to more fully characterize the dynamics of energy deposition during solar flares, opening a new avenue for studying heating and energy transport processes in the solar atmosphere.
Editorial analysis
A structured set of objections, weighed in public.
Referee Report
Summary. The paper reports the first observation of a time delay between mid-infrared emissions at 5.2 μm and 8.2 μm in solar flare footpoints. Applying a local cross-correlation function to the data, the authors find that the 8.2 μm channel peaks 0.3–0.45 s before the 5.2 μm channel. They compare these lags to predictions from the RADYN radiation hydrodynamics code and attribute the wavelength dependence to differences in opacity evolution driven by flare-induced ionization, noting that longer wavelengths exhibit smaller lags relative to the peak of energy injection.
Significance. If robust, the result offers a new observational diagnostic for probing the vertical structure of energy deposition in the chromosphere during solar flares. Mid-IR emission tracks prompt electron-density changes, so measured lags between channels could constrain the timing of heating at different depths. The comparison to independent RADYN simulations (rather than a fit to the data) is a methodological strength that supports the opacity-based interpretation.
major comments (2)
- [Cross-correlation analysis] The headline claim rests on the local cross-correlation function returning a physical lag of 0.3–0.45 s. The manuscript provides no quantitative assessment of how noise, detector response differences, flat-field residuals, or wavelength-dependent atmospheric transmission affect the correlation peak at these sub-second timescales. Without Monte Carlo tests or explicit robustness checks, it is unclear whether the reported lag range is free of instrumental artifacts.
- [Theoretical modeling and comparison] The comparison to RADYN is described only as “theoretical lag values fall within the range of the observed ones.” No specific simulated lag values, their uncertainties, or a quantitative metric of agreement (e.g., overlap fraction or reduced chi-squared) are given. This leaves the match qualitative and weakens the support for the claimed opacity-evolution mechanism.
minor comments (2)
- [Abstract] The abstract states the lag range but omits any mention of uncertainties, the specific flare event(s) analyzed, or the number of footpoints examined. Adding these details would improve clarity.
- Figure captions and text should explicitly state the temporal resolution of the observations and the exact implementation parameters of the local cross-correlation function (window length, lag range searched, etc.).
Simulated Author's Rebuttal
We are grateful to the referee for the detailed and constructive feedback on our manuscript. The comments highlight important areas for improvement in the presentation of our analysis and modeling. We have addressed each major comment below and made corresponding revisions to the manuscript.
read point-by-point responses
-
Referee: [Cross-correlation analysis] The headline claim rests on the local cross-correlation function returning a physical lag of 0.3–0.45 s. The manuscript provides no quantitative assessment of how noise, detector response differences, flat-field residuals, or wavelength-dependent atmospheric transmission affect the correlation peak at these sub-second timescales. Without Monte Carlo tests or explicit robustness checks, it is unclear whether the reported lag range is free of instrumental artifacts.
Authors: We agree that the manuscript would benefit from explicit robustness checks for the cross-correlation analysis. In the revised version, we will include Monte Carlo tests to evaluate the effects of noise on the determined lags, as well as a discussion addressing potential contributions from detector response differences, flat-field residuals, and atmospheric transmission. These additions will provide a quantitative assessment of the reliability of the reported 0.3-0.45 s lag. revision: yes
-
Referee: [Theoretical modeling and comparison] The comparison to RADYN is described only as “theoretical lag values fall within the range of the observed ones.” No specific simulated lag values, their uncertainties, or a quantitative metric of agreement (e.g., overlap fraction or reduced chi-squared) are given. This leaves the match qualitative and weakens the support for the claimed opacity-evolution mechanism.
Authors: We acknowledge that the RADYN comparison was presented in a qualitative manner. We will revise the manuscript to report the specific lag values from the RADYN simulations, including any associated uncertainties, and provide a quantitative measure of agreement with the observations to more firmly support the proposed opacity-evolution mechanism. revision: yes
Circularity Check
No significant circularity in derivation chain
full rationale
The paper's core result is an observational detection of 0.3-0.45 s lags between 8.2 µm and 5.2 µm channels via local cross-correlation applied to flare footpoint data. This measurement is independent of the subsequent RADYN radiation-hydrodynamics modeling, which supplies separate theoretical lag estimates based on flare-driven ionization and wavelength-dependent opacity evolution. The statement that theoretical values fall within the observed range is a consistency check, not a derivation that reduces the data product to a fitted parameter or self-citation. No equations, ansatzes, or uniqueness claims in the provided text loop back to the inputs by construction, and no load-bearing self-citations are invoked.
Axiom & Free-Parameter Ledger
axioms (1)
- domain assumption RADYN radiation hydrodynamics code accurately captures flare-induced ionization and resulting wavelength-dependent opacity variations in the chromosphere
Reference graph
Works this paper leans on
-
[1]
Infrared Technology and Applications XXXII , year = 2006, editor =
Two-color quantum well infrared photodetector focal plane arrays. Infrared Technology and Applications XXXII , year = 2006, editor =. doi:10.1117/12.665803 , adsurl =
-
[2]
Comparison of 30 THz impulsive burst time development to microwaves, H , EUV, and GOES soft X-rays. , keywords =. doi:10.1051/0004-6361/201425520 , archivePrefix =. 1512.01763 , primaryClass =
-
[3]
HATS: A Ground-Based Telescope to Explore the THz Domain. , keywords =. doi:10.1007/s11207-020-01621-3 , archivePrefix =. 2003.12907 , primaryClass =
-
[4]
The New 30 THz Solar Telescope in S \ a o Paulo, Brazil. , keywords =. doi:10.1007/s11207-015-0749-1 , adsurl =
-
[5]
Ground-based and Airborne Telescopes II , year = 2008, editor =
New telescopes for ground-based solar observations at submillimeter and mid-infrared. Ground-based and Airborne Telescopes II , year = 2008, editor =. doi:10.1117/12.788889 , adsurl =
-
[7]
Space Weather , year = 2018, month = sep, volume =
The 6 September 2017 X9 Super Flare Observed From Submillimeter to Mid-IR. Space Weather , year = 2018, month = sep, volume =. doi:10.1029/2018SW001969 , adsurl =
-
[8]
A solar flare driven by thermal conduction observed in mid-infrared. , keywords =. doi:10.1051/0004-6361/202141967 , archivePrefix =. 2110.15751 , primaryClass =
-
[9]
High-resolution Observations of an X6.4 Solar Flare in the Mid-infrared. , keywords =. doi:10.3847/2041-8213/adee95 , adsurl =
-
[10]
doi:10.5281/zenodo.840393 , publisher =
ColourBlind: A Collection of Colour-blind-friendly Colour Tables. doi:10.5281/zenodo.840393 , publisher =
-
[11]
, year = 2010, month = may, volume =
Solar Observation Target Identification Convention for use in Solar Physics. , year = 2010, month = may, volume =. doi:10.1007/s11207-010-9553-0 , adsurl =
-
[12]
Journal of Double Star Observations , year =
Harshaw, Richard and others , title =. Journal of Double Star Observations , year =
-
[13]
, year = 1964, month = dec, volume =
The McMath solar telescope of Kitt Peak National Observatory. , year = 1964, month = dec, volume =. doi:10.1364/AO.3.001337 , adsurl =
-
[14]
Solar Flare Spectroscopy. , keywords =. doi:10.1146/annurev-astro-052920-010547 , adsurl =
-
[15]
The SunPy Project: Open Source Development and Status of the Version 1.0 Core Package , journal =. doi:10.3847/1538-4357/ab4f7a , url =
-
[16]
, volume=
Speckle interferometry with adaptive optics corrected solar data , author=. , volume=. 2008 , publisher=
2008
-
[17]
2008 , journal =
Benz, Arnold O , pages =. 2008 , journal =
2008
-
[18]
Kaufmann, P. and White, S. M. and Freeland, S. L. and Marcon, R. and Fernandes, L. O. T. and Kudaka, A. S. and de Souza, R. V. and Aballay, J. L. and Fernandez, G. and Godoy, R. and Marun, A. and Valio, A. and Raulin, J.-P. and Gim. 2013 , journal =. doi:10.1088/0004-637X/768/2/134 , issn =
-
[19]
Penn, Matt and Krucker, Säm and Hudson, Hugh and Jhabvala, Murzy and Jennings, Don and Lunsford, Allen and Kaufmann, Pierre , number =. 2016 , journal =. doi:10.3847/2041-8205/819/2/L30 , issn =
-
[20]
Simões, Paulo J A and Fletcher, Lyndsay and Hudson, Hugh S and Kerr, Graham S and Penn, Matt and Lopez, Karla F , number =. 2024 , journal =. doi:10.1093/mnras/stae1511 , issn =
-
[21]
Simões, Paulo J. A. and Kerr, Graham S. and Fletcher, Lyndsay and Hudson, Hugh S. and Gim. 2017 , journal =. doi:10.1051/0004-6361/201730856 , issn =
-
[22]
Kontar, E. P. and Ratcliffe, H. and Bian, N. H. , month =. 2012 , journal =. doi:10.1051/0004-6361/201118216 , issn =
-
[23]
Welsh, W.F. , number =. 1999 , journal =. doi:10.1086/316457 , issn =
-
[24]
Gierens, Klaus and Eleftheratos, Kostas , number =. 2021 , journal =. doi:10.1127/metz/2020/0985 , issn =
-
[25]
Heinzel, P. and Avrett, E. H. , month =. 2012 , booktitle =. doi:10.1007/s11207-011-9823-5 , issn =
-
[26]
Carlsson, Mats and Fletcher, Lyndsay and Allred, Joel and Heinzel, Petr and Ka. 2023 , journal =. doi:10.1051/0004-6361/202346087 , issn =
-
[27]
Lin, R. P. and Dennis, B. R. and Hurford, G. J. and Smith, D. M. and Zehnder, A. and Harvey, P. R. and Curtis, D. W. and Pankow, D. and Turin, P. and Bester, M. and Csillaghy, A. and Lewis, M. and Madden, N. and Van Beek, H. F. and Appleby, M. and Raudorf, T. and McTiernan, J. and Ramaty, R. and Schmahl, E. and Schwartz, R. and Krucker, S. and Abiad, R. a...
-
[28]
Neupert, Werner M. , month =. 1968 , journal =. doi:10.1086/180220 , issn =
-
[29]
Steyn, Ruhann and Strauss, Du Toit and Effenberger, Frederic and Pacheco, Daniel , volume =. 2020 , journal =. doi:10.1051/swsc/2020067 , issn =
-
[30]
van Hoof, P. A.M. and Williams, R. J.R. and Volk, K. and Chatzikos, M. and Ferland, G. J. and Lykins, M. and Porter, R. L. and Wang, Y. , number =. 2014 , journal =. doi:10.1093/mnras/stu1438 , issn =
-
[31]
Probing Progression of Heating Through the Lower Flare Atmosphere via High-cadence IRIS Spectroscopy. , keywords =. doi:10.3847/1538-4357/adccc8 , archivePrefix =. 2504.10619 , primaryClass =
discussion (0)
Sign in with ORCID, Apple, or X to comment. Anyone can read and Pith papers without signing in.