Recognition: unknown
Chemical composition and kinematics of ionised gas in low-mass star-forming galaxies with extremely high [OIII]/[OII] ratios
Pith reviewed 2026-05-08 07:45 UTC · model grok-4.3
The pith
Spectrophotometry of 11 low-mass galaxies with extreme O32 ratios yields helium and oxygen abundances plus line-specific velocity dispersions that differ between inner and outer HII-region zones.
A machine-rendered reading of the paper's core claim, the machinery that carries it, and where it could break.
Core claim
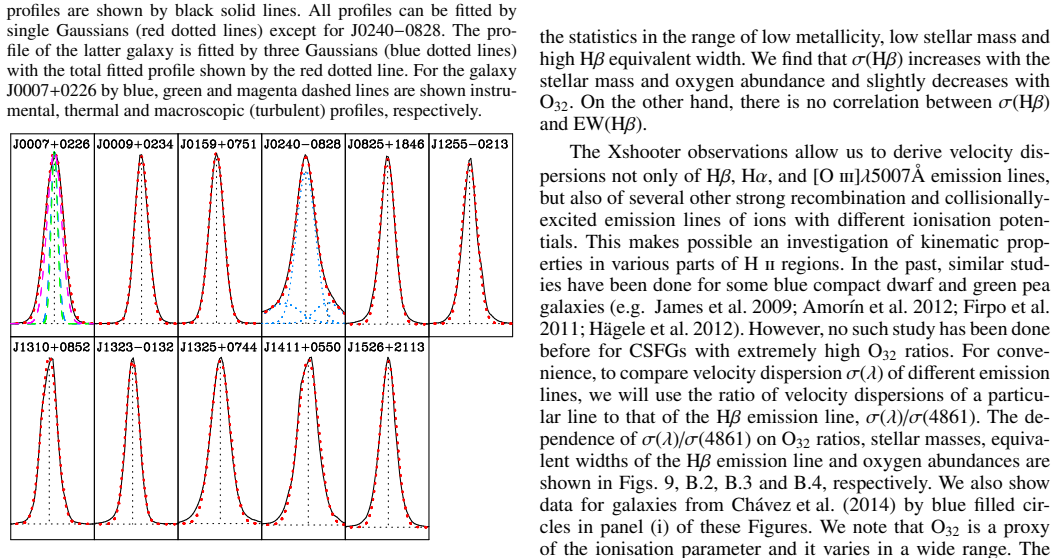
sigma(lambda)/sigma(4861) ratios for HeII 4686 and HeI 10830 are considerably higher than unity while those for [OII] 3726,3729 and [SII] 6717,6731 are lower than unity, indicating production in inner versus outer parts of HII regions.
Load-bearing premise
The assumption that differences in line widths directly trace distinct spatial zones within HII regions without significant contributions from other broadening mechanisms such as unresolved outflows or instrumental effects.
Figures


read the original abstract
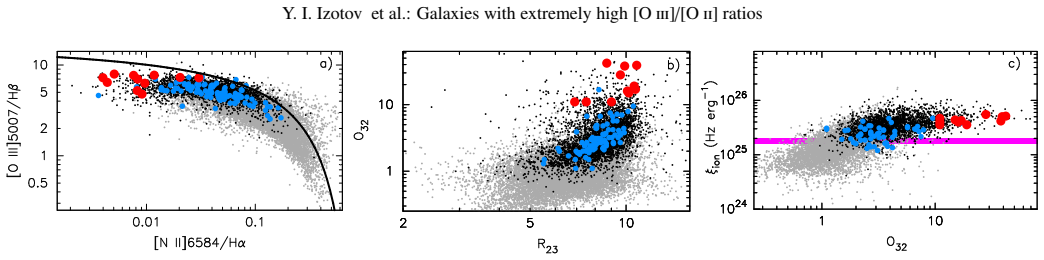
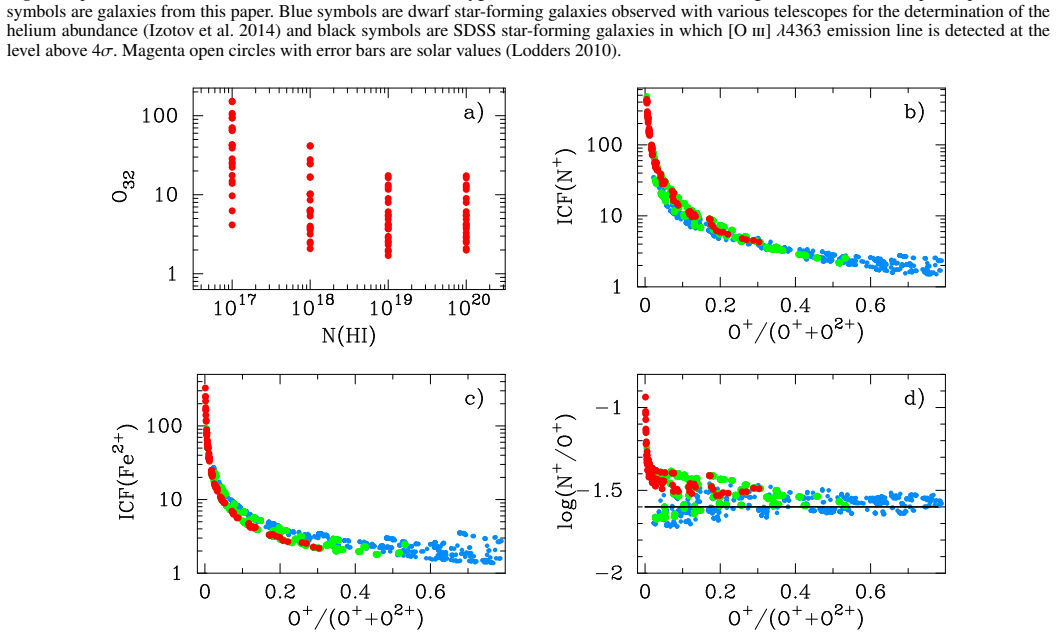
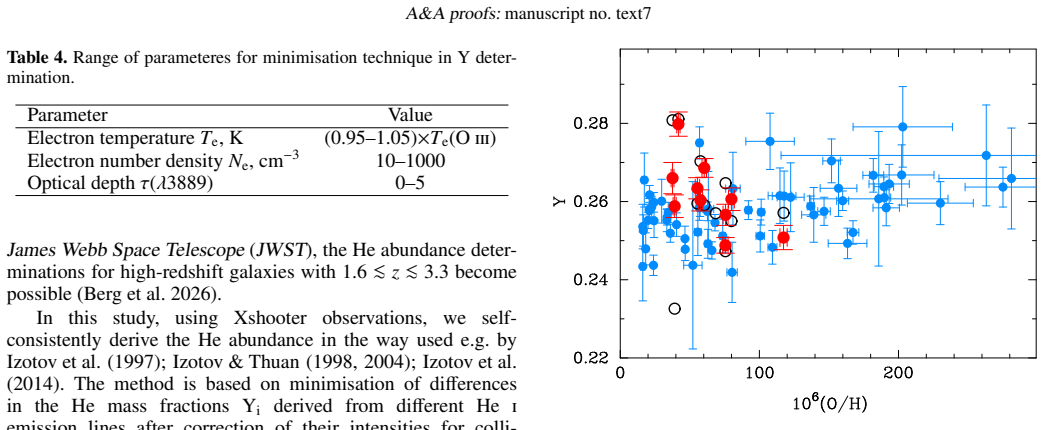
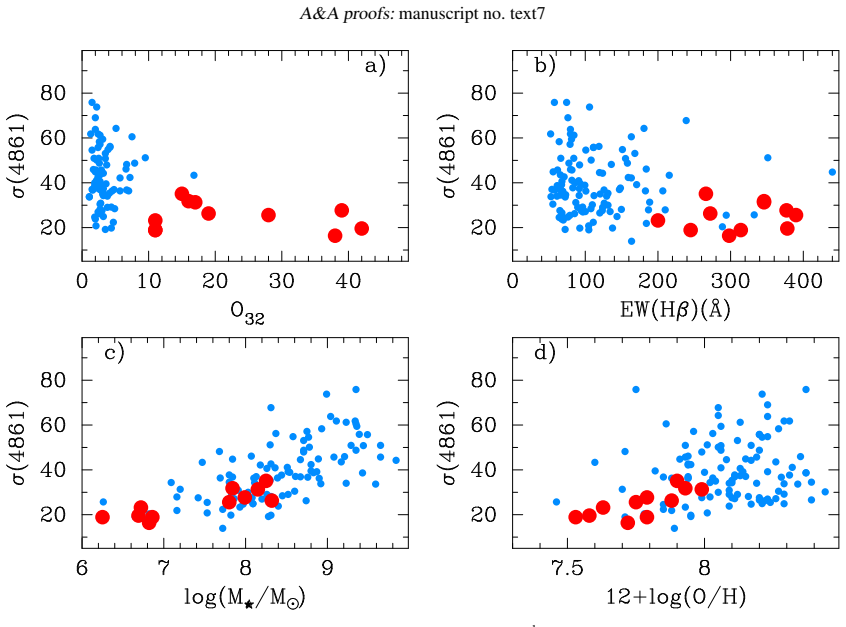
We present Very Large Telescope/Xshooter spectrophotometric observations of eleven low-redshift (z<0.085) compact star-forming galaxies (`high O32 sample'). These galaxies are characterised by extremely high emission-line ratios [OIII]$\lambda$5007/[OII]3727, ranging from 11 to 42. Galaxies with such high ratios are thought to be promising candidates for leaking large amounts of Lyman continuum radiation. They are characterized by low oxygen abundances 12+log(O/H)\,=7.5-8.0 and low stellar masses M*~10^6-10^8 Msun. Strong emission lines of various ions in all spectra are used to derive helium and oxygen abundances, and N/O, Ne/O, S/O, Cl/O, Ar/O and Fe/O abundance ratios. We also derived macroscopic velocity dispersions sigma(lambda) from various emission lines of different ions. We find that sigma(4861) of the Hbeta emission line is increased with increasing stellar mass and decreasing O32 ratio. On the other hand, sigma(lambda)/sigma(4861) ratios for various lines are close to 1. Exceptions are sigma(lambda)/sigma(4861) of two lines, HeII 4686 and HeI 10830, which are considerably higher than unity and of four lines, [OII] 3726,3729, [SII] 6717,6731, with sigma(lambda)/sigma(4861) lower than unity. The two former lines are likely produced in the inner parts of HII regions and are broadened by dynamical processes generated by massive stars, and by radiative scattering in the case of the HeI 10830 emission line. Emission in the four latter lines is produced mainly in the outer and likely more quiet parts of HII regions.
Editorial analysis
A structured set of objections, weighed in public.
Referee Report
Summary. The manuscript presents VLT/Xshooter spectrophotometric observations of eleven low-redshift (z < 0.085) compact star-forming galaxies selected for extremely high [OIII]λ5007/[OII]λ3727 ratios (11–42). It derives helium and oxygen abundances, multiple abundance ratios (N/O, Ne/O, S/O, Cl/O, Ar/O, Fe/O), and macroscopic velocity dispersions σ(λ) from a suite of emission lines. The central result is that σ(4861) increases with stellar mass and decreases with O32, while the normalized ratios σ(λ)/σ(4861) exceed unity for He II λ4686 and He I λ10830 but fall below unity for [O II] λλ3726,3729 and [S II] λλ6717,6731; these differences are interpreted as evidence that the former lines form in dynamically active inner zones of H II regions and the latter in quieter outer zones.
Significance. If the kinematic interpretation is robust, the work supplies direct observational constraints on radial stratification inside H II regions in low-mass, low-metallicity systems that are candidate Lyman-continuum leakers. The abundance measurements enlarge the empirical sample of extremely metal-poor galaxies, and the reported trends of σ(Hβ) with M* and O32 are potentially useful for photoionization and feedback modeling. The high-quality Xshooter spectra spanning UVB–VIS–NIR arms constitute a clear observational strength.
major comments (2)
- [Kinematic results section] Kinematic results (abstract and the section presenting σ(λ) measurements): The claim that σ(λ)/σ(4861) > 1 for He II λ4686 (UVB arm) and He I λ10830 (NIR arm) versus < 1 for [O II] and [S II] directly traces inner versus outer H II-region zones rests on the assumption that residual dispersions after standard instrumental correction reflect only local kinematics. No explicit test or correction for arm-to-arm resolution differences (R ~ 4000–10000) or possible unresolved outflows is described; this assumption is load-bearing for the central kinematic interpretation.
- [Results on velocity dispersions] Abundance and line-width trends (the paragraph reporting σ(4861) dependence on M* and O32): The reported increase of σ(4861) with stellar mass and decrease with O32 is presented without quantitative regression, uncertainties on the slopes, or assessment of whether the trend is driven by the two highest-mass objects; this weakens the supporting context for the radial-zone claim.
minor comments (2)
- [Abstract and abundance derivation section] The abstract lists abundance ratios (N/O, Ne/O, …) but does not indicate which lines were used for each ratio or the typical uncertainties; a short table or sentence in the methods would improve clarity.
- [Kinematic analysis] Notation for the normalized dispersions is introduced as σ(λ)/σ(4861) without an explicit statement of how the reference Hβ width was measured (single Gaussian, multi-component, etc.).
Simulated Author's Rebuttal
We thank the referee for their careful and constructive review of our manuscript. Their comments have helped us clarify the presentation of the kinematic results and strengthen the supporting analysis of the velocity dispersion trends. We address each major comment below and indicate the revisions made to the manuscript.
read point-by-point responses
-
Referee: [Kinematic results section] Kinematic results (abstract and the section presenting σ(λ) measurements): The claim that σ(λ)/σ(4861) > 1 for He II λ4686 (UVB arm) and He I λ10830 (NIR arm) versus < 1 for [O II] and [S II] directly traces inner versus outer H II-region zones rests on the assumption that residual dispersions after standard instrumental correction reflect only local kinematics. No explicit test or correction for arm-to-arm resolution differences (R ~ 4000–10000) or possible unresolved outflows is described; this assumption is load-bearing for the central kinematic interpretation.
Authors: We appreciate the referee's emphasis on the need for explicit validation of the instrumental corrections and the robustness of the kinematic interpretation. Standard corrections for instrumental broadening were applied using the measured spectral resolution of each X-shooter arm (determined from arc-lamp calibrations for the adopted slit widths). Critically, several of the reported deviations occur within the same arm, removing inter-arm resolution concerns: both He II λ4686 and [O II] λλ3726,3729 lie in the UVB arm, as do Hβ λ4861 and He II λ4686. The He I λ10830 line (NIR arm) shows a consistent elevation relative to Hβ. In the revised manuscript we have added an explicit paragraph in the kinematic results section that tabulates the resolution for each arm, confirms that the σ(λ)/σ(4861) deviations persist in intra-arm comparisons, and states the assumption that residual widths trace local gas motions after these corrections. We also note that the sample shows no broad-line components or AGN signatures; however, we acknowledge that low-level unresolved outflows cannot be entirely excluded with the present data and have inserted a corresponding caveat in the discussion. These changes make the supporting assumptions transparent while preserving the central interpretation. revision: yes
-
Referee: [Results on velocity dispersions] Abundance and line-width trends (the paragraph reporting σ(4861) dependence on M* and O32): The reported increase of σ(4861) with stellar mass and decrease with O32 is presented without quantitative regression, uncertainties on the slopes, or assessment of whether the trend is driven by the two highest-mass objects; this weakens the supporting context for the radial-zone claim.
Authors: We agree that a quantitative statistical treatment of the σ(4861)–M* and σ(4861)–O32 relations would strengthen the manuscript. In the revised version we have added a linear regression analysis for both relations, reporting the fitted slopes together with their 1σ uncertainties. We also provide the Spearman rank correlation coefficient and p-value for each trend. To address the possible influence of the two highest-mass objects, we repeated the fits after their removal; the slopes remain consistent in sign and the correlations retain significance (though reduced, as expected for N=9). These results, together with the regression lines and confidence bands, are now shown in an updated figure and described in the revised 'Results' section. This addition supplies the quantitative support requested while leaving the overall interpretation unchanged. revision: yes
Circularity Check
No circularity: direct observational derivations from spectra with no self-referential reductions.
full rationale
The paper reports spectrophotometric data from VLT/X-shooter for 11 galaxies and derives helium/oxygen abundances plus macroscopic velocity dispersions sigma(lambda) directly from measured emission-line fluxes and widths using standard nebular analysis techniques. The key interpretive step—that sigma ratios >1 for HeII 4686/HeI 10830 and <1 for [OII]/[SII] indicate inner vs. outer HII-region zones—is presented as a qualitative likelihood based on the observed values, not as a mathematical derivation or prediction that reduces to fitted parameters defined by the same dataset. No equations, ansatze, or uniqueness theorems are invoked that loop back to the paper's own inputs. Self-citations are absent from the provided text. The analysis is self-contained against external benchmarks (observed line ratios and dispersions), yielding a normal non-finding.
Axiom & Free-Parameter Ledger
axioms (2)
- domain assumption Standard nebular abundance diagnostics (e.g., direct T_e method or strong-line calibrations) accurately recover gas-phase abundances from the observed line fluxes.
- domain assumption Differences in measured velocity dispersions between lines arise from spatial stratification within HII regions rather than from instrumental resolution, outflows, or radiative transfer effects.
Reference graph
Works this paper leans on
-
[1]
O., Pérez-Montero, E., & Vílchez, J
Amorín, R. O., Pérez-Montero, E., & Vílchez, J. M. 2010, ApJ, 715, 128 Amorín, R., Vílchez, J. M., Hägele, G. F., et al. 2012, ApJ, 754, L22 Amorín, R., Rodríguez-Henríquez, M., Fernández, V ., et al. 2024, A&A, 682, L25 Arellano-Córdova, K. Z., Berg, D. A., Mingozzi, M., et al. 2025, MNRAS, 544, 1588
2010
-
[2]
J., et al
Atek, H., Labbé, I., Furtak, L. J., et al. 2024, Nature, 626, 975
2024
-
[3]
A., & Skillman, E
Aver, E., Olive, K. A., & Skillman, E. D. 2011, J. Cosmology Astropart. Phys., 3, 043
2011
-
[4]
A., & Skillman, E
Aver, E., Olive, K. A., & Skillman, E. D. 2012, J. Cosmology Astropart. Phys., 4, 004
2012
-
[5]
A., & Skillman, E
Aver, E., Olive, K. A., & Skillman, E. D. 2015, J. Cosmology Astropart. Phys., 7, 011
2015
-
[6]
A., Phillips, M
Baldwin, J. A., Phillips, M. M., & Terlevich, R. 1981, PASP, 93, 5
1981
-
[7]
A., Skillman, E
Benjamin, R. A., Skillman, E. D., & Smits, D. P. 1999, ApJ, 514, 307
1999
-
[8]
A., Skillman, E
Benjamin, R. A., Skillman, E. D., & Smits, D. P. 2002, ApJ, 569, 288
2002
-
[9]
A., Pogge, R
Berg, D. A., Pogge, R. W., Skillman, E. D., et al. 2020, ApJ, 893, 96
2020
-
[10]
A., James, B
Berg, D. A., James, B. L., King, T., et al. 2022, ApJS, 261, 31
2022
-
[11]
A., Sanders, R
Berg, D. A., Sanders, R. L., Shapley, A. E., et al. 2026, ApJ, 996, 68
2026
-
[12]
2011, ApJ, 732, 52
Bordalo, V ., & Telles, E. 2011, ApJ, 732, 52
2011
-
[13]
J., Illingworth, G
Bouwens, R. J., Illingworth, G. D., Oesch, P. A., et al. 2015, ApJ, 803, 34
2015
-
[14]
A., Clayton, G
Cardelli, J. A., Clayton, G. C., & Mathis, J. S. 1989, ApJ, 345, 245
1989
-
[15]
2023, A&A, 673, L7 Chávez, R., Terlevich, E., Terlevich, R., et al
Charbonnel, C., Schaerer, D., Prantzos, N., et al. 2023, A&A, 673, L7 Chávez, R., Terlevich, E., Terlevich, R., et al. 2012, MNRAS, 425, L56 Chávez, R., Terlevich, R., Terlevich, E., et al. 2014, MNRAS, 442, 3565
2023
-
[16]
Draine, B. T. 2026, ApJ, 999, 3
2026
-
[17]
E., Winkel, B., Sánchez Almeida, J., et al
Filho, M. E., Winkel, B., Sánchez Almeida, J., et al. 2013, A&A, 558, A18
2013
-
[18]
F., Díaz, Á
Firpo, V ., Bosch, G., Hägele, G. F., Díaz, Á. I., & Morrell, N. 2011, MNRAS, 414, 3288
2011
-
[19]
N., van Hoof, P
Gunasekera, C. N., van Hoof, P. A. M., Dehghanian, M., et al. 2025, Rev. Mexi- cana Astron. Astrofis., 61, 120 Hägele, G. F., Firpo, V ., Bosch, G., Díaz, Á. I., & Morrell, N. 2012, MNRAS, 422, 3475
2025
-
[20]
2022, ApJ, 925, 111
Isobe, Y ., Ouchi, M., Suzuki, A., et al. 2022, ApJ, 925, 111
2022
-
[21]
2023, ApJ, 959, 100
Isobe, Y ., Ouchi, M., Tominaga, N., et al. 2023, ApJ, 959, 100
2023
-
[22]
I., & Thuan, T
Izotov, Y . I., & Thuan, T. X. 1998, ApJ, 500, 188
1998
-
[23]
I., & Thuan, T
Izotov, Y . I., & Thuan, T. X. 2004, ApJ, 602, 200
2004
-
[24]
I., Thuan, T
Izotov, Y . I., Thuan, T. X., & Lipovetsky, V . A. 1997, ApJS, 108, 1
1997
-
[25]
I., Guseva, N
Izotov, Y . I., Guseva, N. G., & Thuan, T. X. 2011, ApJ, 728, 161 Izotov Y . I., Thuan T. X., & Privon, G. 2012, MNRAS, 427, 1229
2011
-
[26]
I., Stasi´nska, G., & Guseva, N
Izotov, Y . I., Stasi´nska, G., & Guseva, N. G. 2013, A&A, 558, A57
2013
-
[27]
I., Thuan, T
Izotov, Y . I., Thuan, T. X., & Guseva, N. G. 2014, MNRAS, 445, 778
2014
-
[28]
I., Guseva, N
Izotov, Y . I., Guseva, N. G., Fricke, K. J., & Henkel, C. 2016, MNRAS, 462, 4427
2016
-
[29]
I., Thuan, T
Izotov, Y . I., Thuan, T. X., & Guseva, N. G. 2017, MNRAS, 471, 548
2017
-
[30]
I., Thuan, T
Izotov, Y . I., Thuan, T. X., Guseva, N. G., & Liss, S. E. 2018, MNRAS, 473, 1956
2018
-
[31]
I., Schaerer, D., Worseck, G., et al
Izotov, Y . I., Schaerer, D., Worseck, G., et al. 2020, MNRAS, 491, 468
2020
-
[32]
I., Thuan, T
Izotov, Y . I., Thuan, T. X., Guseva, N. G. 2024, MNRAS, 527, 3486
2024
-
[33]
L., Tsamis, Y
James, B. L., Tsamis, Y . G., Barlow, M. J., et al. 2009, MNRAS, 398, 2
2009
-
[34]
E., & Oey, M
Jaskot, A. E., & Oey, M. S. 2013, ApJ, 766, 91
2013
-
[35]
E., Oey, M
Jaskot, A. E., Oey, M. S., Scarlata, C., & Dowd, T. 2017, ApJ, 851, L9
2017
-
[36]
M., White, S
Kauffmann, G., Heckman, T. M., White, S. D. M., et al. 2003, MNRAS, 341, 33
2003
-
[37]
2021, ApJ, 913, 22
Kojima, T., Ouchi, M., Rauch, M., et al. 2021, ApJ, 913, 22
2021
-
[38]
2024, A&A, 688, 159
Kouroumpatzakis, K., Svoboda, J., Zezas, A., et al. 2024, A&A, 688, 159
2024
-
[39]
2010, Principles and Perspectives in Cosmochemistry, in Astro- physics and Space Science Proceedings, ed
Lodders, K. 2010, Principles and Perspectives in Cosmochemistry, in Astro- physics and Space Science Proceedings, ed. Coswami A., & Reddy B. E. (Springer-Verlag Berlin Heidelberg), 379
2010
-
[40]
2024, A&A, 681, 30
Marques-Chaves, R., Schaerer, D., Kuruvanthodi, A., et al. 2024, A&A, 681, 30
2024
-
[41]
2022, ApJ, 941, 167
Matsumoto, A., Ouchi, M., Nakajima K., et al. 2022, ApJ, 941, 167
2022
-
[42]
2019, A&A, 599, 76
Melnick, J., Telles, E., Bordalo, V ., et al. 2019, A&A, 599, 76
2019
-
[43]
L., et al
Mingozzi, M., Garcia del Valle-Espinosa, M., James, B. L., et al. 2025, ApJ, 985, 253
2025
-
[44]
Mitra, S., Ferrara, A., & Choudhury, T. R. 2013, MNRAS, 428, L1
2013
-
[45]
2014, MNRAS, 442, 900
Nakajima, K., & Ouchi, M. 2014, MNRAS, 442, 900
2014
-
[46]
S., Iwata, I., et al
Nakajima, K., Ellis, R. S., Iwata, I., et al. 2016, ApJ, 831, L9
2016
-
[47]
2009, ApJ, 706, 1136 Planck Collaboration XVI 2014, A&A, 571, A16
Ouchi, M., Mobasher, B., Shimasaku, K., et al. 2009, ApJ, 706, 1136 Planck Collaboration XVI 2014, A&A, 571, A16
2009
-
[48]
L., Ferland, G
Porter, R. L., Ferland, G. J., Storey, P. J., & Detisch, M. J. 2012, MNRAS, 425, L28
2012
-
[49]
L., Ferland, G
Porter, R. L., Ferland, G. J., Storey, P. J., & Detisch, M. J. 2013, MNRAS, 433, L89
2013
-
[50]
E., Furlanetto, S
Robertson, B. E., Furlanetto, S. R., Schneider, E., et al. 2013, ApJ, 768, 71 Stasi´nska, G., Izotov, Y ., Morisset, C., & Guseva, N. 2015, A&A, 576, A83 Thuan T. X., & Izotov Y . I. 1997, ApJS, 161, 240
2013
-
[51]
2024, ApJ, 962, 50
Watanabe, K., Ouchi, M., Nakajima, K., et al. 2024, ApJ, 962, 50
2024
-
[52]
Wright, E. L. 2006, PASP, 118, 1711
2006
-
[53]
2022, ApJ, 933, 222
Xu, X., Heckman, T., Henry, A., et al. 2022, ApJ, 933, 222
2022
-
[54]
2011, MNRAS, 412, 411
Yajima, H., Choi, J.-H., & Nagamine, K. 2011, MNRAS, 412, 411
2011
-
[55]
Yanagisawa, H., Ouchi, M., Matsumoto, A., et al. 2025, preprint arXiv:2506.24050
work page internal anchor Pith review Pith/arXiv arXiv 2025
-
[56]
E., & Wang, J
Yang, H., Malhotra, S., Rhoads, J. E., & Wang, J. 2017, ApJ, 847, 38 Article number, page 12 Y . I. Izotov et al.: Galaxies with extremely high [Oiii]/[Oii] ratios Fig. B.1.The rest-frame spectrum of one of our galaxies, J0825+1846. Fig. B.2.The ratios of velocity dispersions of various lines to the velocity dispersion of the Hβemission line in function o...
2017
discussion (0)
Sign in with ORCID, Apple, or X to comment. Anyone can read and Pith papers without signing in.