Recognition: unknown
Constraining Galaxy Cluster Triaxiality via Weak Lensing -- I. Preparation for the Rubin Data Beyond Leading Order
Pith reviewed 2026-05-08 05:27 UTC · model grok-4.3
The pith
Galaxy clusters exhibit a projected ellipticity of 0.31 when their weak lensing signals are stacked after alignment by satellite galaxies.
A machine-rendered reading of the paper's core claim, the machinery that carries it, and where it could break.
Core claim
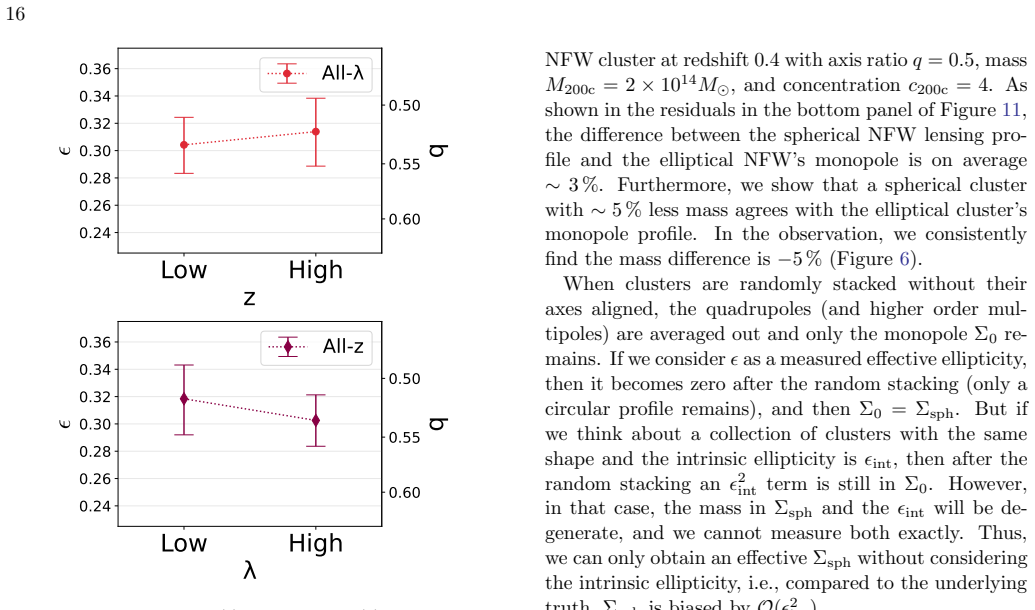
Applying the triaxiality module of the Cluster Lensing Mass Modeling software to DES Y3 data, the authors stack weak-lensing signals of clusters aligned according to satellite-galaxy major axes and expand the monopole and quadrupole to second order in ellipticity. For the selected sample they report a projected ellipticity of 0.310^{+0.017}_{-0.016} (axis ratio 0.527^{+0.018}_{-0.019}) that is statistically independent of both cluster mass and redshift within the probed range.
What carries the argument
Axis-aligned stacking of weak-lensing multipoles expanded to second order in ellipticity, with orientations supplied by the satellite galaxy distribution.
If this is right
- The measured average ellipticity supplies a direct observational anchor for the typical projected shapes assumed in cosmological simulations of cluster formation.
- Absence of mass and redshift trends implies that a single ellipticity prior can be used across the current sample range without large systematic corrections.
- Extension of the multipole analysis to second order reduces the leading-order bias in shape recovery for future wide-field surveys.
- The same pipeline scales directly to LSST, Euclid, and Roman data sets once larger cluster samples become available.
Where Pith is reading between the lines
- If satellite galaxies continue to trace halo axes in larger samples, optical catalogs alone could suffice for shape constraints without requiring multi-wavelength orientation data.
- The second-order terms may become essential for controlling projection biases in cluster mass calibration at the precision demanded by next-generation surveys.
- A larger sample would permit binning the ellipticity measurement by additional observables such as dynamical state or concentration to test for hidden dependencies.
Load-bearing premise
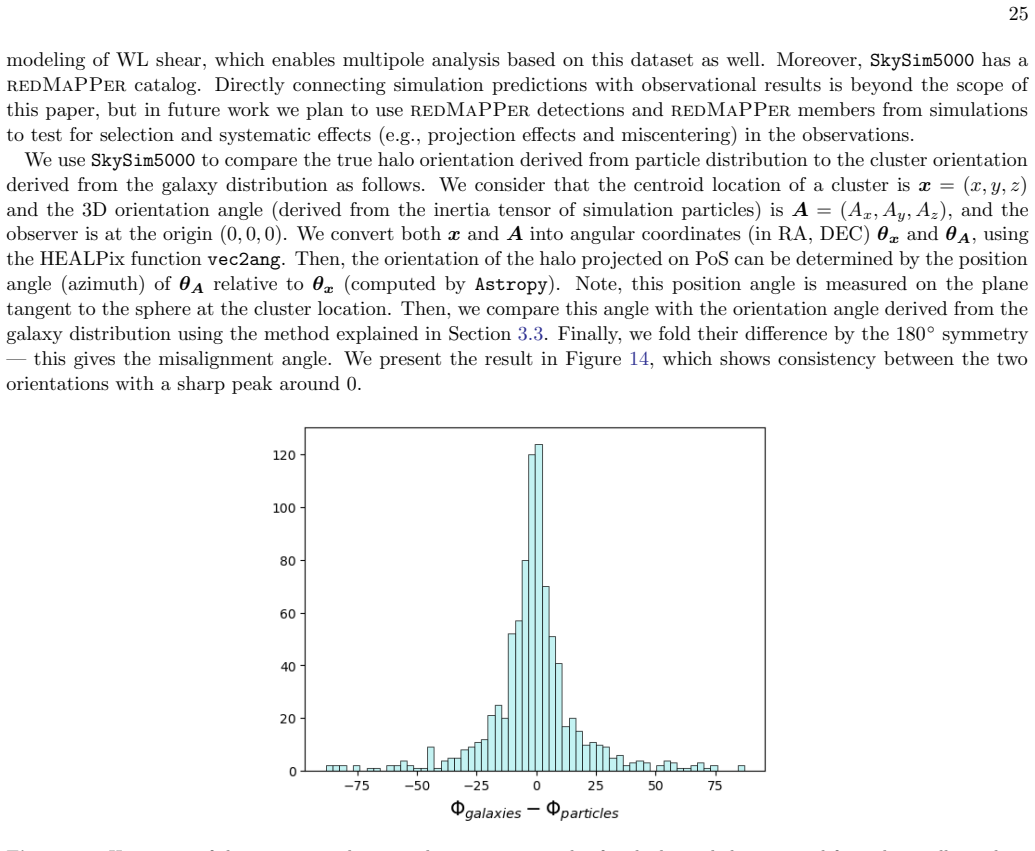
Satellite galaxies reliably indicate the major-axis orientation of the underlying dark-matter halo without introducing significant misalignment or selection bias from the centering cut.
What would settle it
Repeating the identical stacking and multipole analysis with cluster orientations taken from an independent tracer such as X-ray isophotes or direct lensing reconstruction and obtaining a statistically different ellipticity value.
Figures


read the original abstract
The 3D mass distributions of galaxy clusters are generally triaxial, a geometry that is difficult to constrain from projected observations. In this work, we measure the projected halo shapes of clusters from their weak lensing signatures using the triaxiality functionality in the Cluster Lensing Mass Modeling software, a tool developed by the Dark Energy Science Collaboration to analyze data from NSF-DOE Rubin Observatory's Legacy Survey of Space and Time (LSST). We measure ensemble halo ellipticity on the plane of the sky via axis-aligned stacking and multipole expansion of the weak lensing data. We study a precursor dataset -- the redMaPPer cluster catalog, the metacalibration shape catalog, and the Directional Neighborhood Fitting photometric redshift catalog from the Dark Energy Survey Year 3 public data release. We select clusters that have a high centering probability (>90%) of the identified central galaxy, and use the satellite galaxy distribution to determine the major-axis orientation for stacking. We extend the analysis to the second order of ellipticity in the monopole and quadrupole measurement. The projected ellipticity of the cluster sample is found to be $0.310^{+0.017}_{-0.016}$ (axis ratio $0.527^{+0.018}_{-0.019}$). The projected cluster ellipticity shows no statistically significant dependence on mass and redshift. We further verify the accuracy of the cluster shape measurement using mock catalogs. This analysis is applicable to datasets from upcoming wide-area cosmic surveys such as LSST, Euclid, and the Roman Space Telescope, where larger sample sizes will lead to tighter constraints on the cluster ellipticities.
Editorial analysis
A structured set of objections, weighed in public.
Referee Report
Summary. The paper measures the projected ellipticity of galaxy clusters from DES Y3 weak-lensing data by selecting clusters with >90% centering probability, aligning stacks using the major axis inferred from satellite galaxy positions, and extracting ellipticity from the monopole and quadrupole of the lensing signal extended to second order. Using the CLMM triaxiality module, they report a sample ellipticity of 0.310^{+0.017}_{-0.016} (axis ratio 0.527^{+0.018}_{-0.019}) with no statistically significant mass or redshift dependence, validate the pipeline on mocks, and frame the work as preparation for LSST/Rubin data.
Significance. If the alignment and centering assumptions hold without substantial bias, the result supplies a useful benchmark for cluster shapes ahead of larger LSST samples and demonstrates the practical extension of multipole analysis beyond leading order. The absence of mass/redshift trends is a clear, falsifiable outcome that could constrain formation models. The use of public DES catalogs and open CLMM software is a strength for reproducibility.
major comments (2)
- [Methodology and mock verification] The axis-aligned stacking procedure (described in the methodology) assumes satellite galaxies accurately trace the halo major axis. Simulations and observations indicate typical misalignments of 20-40 degrees, which would dilute the quadrupole amplitude and bias the reported ellipticity low. The mock verification tests the pipeline only under the assumed perfect-alignment model and does not quantify or correct for this effect, making the central numerical claim (0.310^{+0.017}_{-0.016}) dependent on an untested assumption.
- [Data selection and results] The >90% centering-probability cut is applied to select the sample, yet no robustness test varying the threshold (e.g., 80% or 95%) is shown to assess possible selection bias toward more relaxed, better-aligned systems. This directly affects the measured ellipticity and its claimed lack of mass/redshift dependence.
minor comments (2)
- [Abstract and Results] The abstract and results section would benefit from explicit statement of the covariance estimation method and any systematic error budget (e.g., photo-z, shape calibration, or mask effects) to support the quoted uncertainties.
- [Methodology] Notation for the second-order ellipticity terms in the monopole/quadrupole expansion should be cross-referenced to the relevant CLMM equations for readers unfamiliar with the software.
Simulated Author's Rebuttal
We appreciate the referee's careful review and insightful comments on our manuscript. The suggestions highlight important aspects of the methodology and data selection that we will address in the revision. Below, we provide point-by-point responses to the major comments.
read point-by-point responses
-
Referee: [Methodology and mock verification] The axis-aligned stacking procedure (described in the methodology) assumes satellite galaxies accurately trace the halo major axis. Simulations and observations indicate typical misalignments of 20-40 degrees, which would dilute the quadrupole amplitude and bias the reported ellipticity low. The mock verification tests the pipeline only under the assumed perfect-alignment model and does not quantify or correct for this effect, making the central numerical claim (0.310^{+0.017}_{-0.016}) dependent on an untested assumption.
Authors: We thank the referee for pointing out this potential source of bias. Indeed, the misalignment between satellite galaxies and the underlying halo major axis is a known effect in the literature. Our mock verification was designed to test the recovery of the input ellipticity under the assumption of perfect alignment, as stated in the paper, to validate the pipeline implementation. However, we agree that quantifying the impact of realistic misalignments is necessary. In the revised version, we will add a section discussing this effect and present results from mocks incorporating misalignment angles of 20-40 degrees, showing the expected dilution and any necessary corrections or caveats to the reported ellipticity value. revision: yes
-
Referee: [Data selection and results] The >90% centering-probability cut is applied to select the sample, yet no robustness test varying the threshold (e.g., 80% or 95%) is shown to assess possible selection bias toward more relaxed, better-aligned systems. This directly affects the measured ellipticity and its claimed lack of mass/redshift dependence.
Authors: We acknowledge the importance of testing the sensitivity to the centering probability threshold. The >90% cut was chosen to ensure reliable central galaxy identification and minimize miscentering effects on the lensing signal. To address the referee's concern, we will include in the revised manuscript additional measurements using alternative thresholds (80% and 95%) and demonstrate that the ensemble ellipticity and its lack of dependence on mass and redshift remain consistent within uncertainties. revision: yes
Circularity Check
Direct data-driven measurement via stacking and multipole expansion; no reduction to inputs by construction
full rationale
The paper's central result is an observational extraction of projected ellipticity (0.310^{+0.017}_{-0.016}) from DES Year 3 weak-lensing data. Clusters are selected by centering probability, oriented using the observed satellite galaxy distribution, stacked axis-aligned, and analyzed via monopole/quadrupole multipoles extended to second order in ellipticity. This chain operates directly on external survey data using the described pipeline; the output ellipticity is not a fitted parameter renamed as a prediction, nor does any step invoke a self-citation whose content is required to justify the numerical result. Mock verification tests the pipeline under the alignment assumption but does not substitute for the data measurement itself. The derivation is therefore self-contained against external benchmarks with no circular steps.
Axiom & Free-Parameter Ledger
axioms (2)
- domain assumption Weak lensing shear traces the projected mass distribution of the cluster
- domain assumption Satellite galaxy distribution traces the major axis of the dark matter halo
Reference graph
Works this paper leans on
-
[1]
2025, arXiv e-prints, arXiv:2507.21459, doi: 10.48550/arXiv.2507.21459
ACTDESHSC Collaboration, Aguena, M., Aiola, S., et al. 2025, arXiv e-prints, arXiv:2507.21459, doi: 10.48550/arXiv.2507.21459
-
[2]
Adhikari, S., Chue, C. Y. R., & Dalal, N. 2015, JCAP, 2015, 009, doi: 10.1088/1475-7516/2015/01/009
-
[3]
2021, MNRAS, 508, 6092, doi: 10.1093/mnras/stab2764
Aguena, M., Avestruz, C., Combet, C., et al. 2021, MNRAS, 508, 6092, doi: 10.1093/mnras/stab2764
-
[4]
2018, PASJ, 70, S4, doi: 10.1093/pasj/psx066
Aihara, H., Arimoto, N., Armstrong, R., et al. 2018, PASJ, 70, S4, doi: 10.1093/pasj/psx066
-
[5]
Allen, S. W., Evrard, A. E., & Mantz, A. B. 2011, ARA&A, 49, 409, doi: 10.1146/annurev-astro-081710-102514
-
[6]
Allgood, B., Flores, R. A., Primack, J. R., et al. 2006, MNRAS, 367, 1781, doi: 10.1111/j.1365-2966.2006.10094.x Astropy Collaboration, Robitaille, T. P., Tollerud, E. J., et al. 2013, A&A, 558, A33, doi: 10.1051/0004-6361/201322068 30 Astropy Collaboration, Price-Whelan, A. M., Sip˝ ocz, B. M., et al. 2018, AJ, 156, 123, doi: 10.3847/1538-3881/aabc4f Ast...
-
[7]
Becker, M. R., & Kravtsov, A. V. 2011, ApJ, 740, 25, doi: 10.1088/0004-637X/740/1/25
-
[8]
Benson, A. J. 2012, NewA, 17, 175, doi: 10.1016/j.newast.2011.07.004
-
[9]
E., Bocquet, S., Stalder, B., et al
Bleem, L. E., Bocquet, S., Stalder, B., et al. 2020, ApJS, 247, 25, doi: 10.3847/1538-4365/ab6993
-
[10]
Bocquet, S., Dietrich, J. P., Schrabback, T., et al. 2019, ApJ, 878, 55, doi: 10.3847/1538-4357/ab1f10
-
[11]
doi:10.1166/asl.2011.1209 , eprint =
Borgani, S., & Kravtsov, A. 2011, Advanced Science Letters, 4, 204, doi: 10.1166/asl.2011.1209
-
[12]
2025, A&A, 704, A110, doi: 10.1051/0004-6361/202554942
Chiu, I.-N., Ghirardini, V., Grandis, S., et al. 2025, A&A, 704, A110, doi: 10.1051/0004-6361/202554942
-
[13]
2016, MNRAS, 457, 4135, doi: 10.1093/mnras/stw254
Clampitt, J., & Jain, B. 2016, MNRAS, 457, 4135, doi: 10.1093/mnras/stw254
-
[14]
2013, Python and HDF5: unlocking scientific data (O’Reilly Media, Inc.)
Collette, A. 2013, Python and HDF5: unlocking scientific data (O’Reilly Media, Inc.)
2013
-
[15]
doi:10.1093/mnras/sty2111 , archiveprefix =
Cui, W., Knebe, A., Yepes, G., et al. 2018, MNRAS, 480, 2898, doi: 10.1093/mnras/sty2111 de Jong, R. S., Agertz, O., Berbel, A. A., et al. 2019, The Messenger, 175, 3, doi: 10.18727/0722-6691/5117 De Vicente, J., S´ anchez, E., & Sevilla-Noarbe, I. 2016, MNRAS, 459, 3078, doi: 10.1093/mnras/stw857 DES Collaboration, Abbott, T. M. C., Aguena, M., et al. 20...
-
[16]
2017, MNRAS, 466, 181, doi: 10.1093/mnras/stw3129
Tormen, G. 2017, MNRAS, 466, 181, doi: 10.1093/mnras/stw3129
-
[17]
Diemer, B. 2018, ApJS, 239, 35, doi: 10.3847/1538-4365/aaee8c
-
[18]
Diemer, B., & Joyce, M. 2019, ApJ, 871, 168, doi: 10.3847/1538-4357/aafad6
-
[19]
Diemer, B., & Kravtsov, A. V. 2014, ApJ, 789, 1, doi: 10.1088/0004-637X/789/1/1
-
[20]
Donahue, M., Ettori, S., Rasia, E., et al. 2016, ApJ, 819, 36, doi: 10.3847/0004-637X/819/1/36
-
[21]
Einasto, J. 1965, Trudy Astrofizicheskogo Instituta Alma-Ata, 5, 87 Euclid Collaboration, Scaramella, R., Amiaux, J., et al. 2022, A&A, 662, A112, doi: 10.1051/0004-6361/202141938
-
[22]
2016, The Journal of Open Source Software, 1, 24, doi: 10.21105/joss.00024
Foreman-Mackey, D. 2016, The Journal of Open Source Software, 1, 24, doi: 10.21105/joss.00024
-
[23]
Foreman-Mackey, D., Hogg, D. W., Lang, D., & Goodman, J. 2013, PASP, 125, 306, doi: 10.1086/670067
-
[24]
2021, Physics Theses and Dissertations, Brown University
Fu, S. 2021, Physics Theses and Dissertations, Brown University. https://repository.library.brown.edu/studio/item/bdr: nwqbzmrw/
2021
-
[25]
2024a, MNRAS, 530, 2251, doi: 10.1093/mnras/stae950
Fu, S., Zhang, Y., Avestruz, C., & Coronel, R. 2024a, MNRAS, 530, 2251, doi: 10.1093/mnras/stae950
-
[26]
2024b, ApJ, 974, 69, doi: 10.3847/1538-4357/ad67c6
Fu, S., Dell’Antonio, I., Escalante, Z., et al. 2024b, ApJ, 974, 69, doi: 10.3847/1538-4357/ad67c6
-
[27]
Gatti, M., Sheldon, E., Amon, A., et al. 2021, MNRAS, 504, 4312, doi: 10.1093/mnras/stab918
-
[28]
J., Hoffmann, K., Gazta˜ naga, E., et al
Gonzalez, E. J., Hoffmann, K., Gazta˜ naga, E., et al. 2022, MNRAS, 517, 4827, doi: 10.1093/mnras/stac3038
-
[29]
J., Rodr´ ıguez-Medrano, A., Pereyra, L., & Garc´ ıa Lambas, D
Gonzalez, E. J., Rodr´ ıguez-Medrano, A., Pereyra, L., & Garc´ ıa Lambas, D. 2024, MNRAS, 528, 3075, doi: 10.1093/mnras/stae099 G´ orski, K. M., Hivon, E., Banday, A. J., et al. 2005, ApJ, 622, 759, doi: 10.1086/427976
-
[30]
Gunn, J. E., Carr, M., Rockosi, C., et al. 1998, AJ, 116, 3040, doi: 10.1086/300645
-
[31]
Harris, C. R., Millman, K. J., van der Walt, S. J., et al. 2020, Nature, 585, 357, doi: 10.1038/s41586-020-2649-2
-
[32]
2019, ApJS, 245, 16, doi: 10.3847/1538-4365/ab4da1
Heitmann, K., Finkel, H., Pope, A., et al. 2019, ApJS, 245, 16, doi: 10.3847/1538-4365/ab4da1
-
[33]
Herbonnet, R., von der Linden, A., Allen, S. W., et al. 2019, MNRAS, 490, 4889, doi: 10.1093/mnras/stz2913
-
[34]
Herbonnet, R., Crawford, A., Avestruz, C., et al. 2022, MNRAS, 513, 2178, doi: 10.1093/mnras/stac997 Hern´ andez-Mart´ ın, B., Schrabback, T., Hoekstra, H., et al. 2020, A&A, 640, A117, doi: 10.1051/0004-6361/202037844
-
[35]
2006, ApJ, 647, 8, doi: 10.1086/505255
Ho, S., Bahcall, N., & Bode, P. 2006, ApJ, 647, 8, doi: 10.1086/505255
-
[36]
Hopkins, P. F., Bahcall, N. A., & Bode, P. 2005, ApJ, 618, 1, doi: 10.1086/425993
-
[37]
Metacalibration: Direct Self-Calibration of Biases in Shear Measurement
Huff, E., & Mandelbaum, R. 2017, arXiv e-prints, arXiv:1702.02600, doi: 10.48550/arXiv.1702.02600
-
[38]
Hunter, J. D. 2007, Computing in Science and Engineering, 9, 90, doi: 10.1109/MCSE.2007.55 Ivezi´ c,ˇZ., Kahn, S. M., Tyson, J. A., et al. 2019, ApJ, 873, 111, doi: 10.3847/1538-4357/ab042c
-
[39]
Joachimi, B., Cacciato, M., Kitching, T. D., et al. 2015, SSRv, 193, 1, doi: 10.1007/s11214-015-0177-4 K¨ afer, F., Finoguenov, A., Eckert, D., et al. 2019, A&A, 628, A43, doi: 10.1051/0004-6361/201935124
-
[40]
Kasun, S. F., & Evrard, A. E. 2005, ApJ, 629, 781, doi: 10.1086/430811
-
[41]
Keeton, C. R. 2001, arXiv e-prints, astro, doi: 10.48550/arXiv.astro-ph/0102341
work page internal anchor Pith review doi:10.48550/arxiv.astro-ph/0102341 2001
-
[42]
Korytovet al.[LSST Dark Energy Science], Astrophys
Korytov, D., Hearin, A., Kovacs, E., et al. 2019, ApJS, 245, 26, doi: 10.3847/1538-4365/ab510c 31
-
[43]
F., Marulli, F., Moscardini, L., et al
Lesci, G. F., Marulli, F., Moscardini, L., et al. 2022, A&A, 659, A88, doi: 10.1051/0004-6361/202040194
-
[44]
2025, ApJ, 979, 200, doi: 10.3847/1538-4357/ada362
Liu, Z., Zhang, J., Liu, C., & Li, H. 2025, ApJ, 979, 200, doi: 10.3847/1538-4357/ada362
-
[45]
Lokken, M., van Engelen, A., Aguena, M., et al. 2025, ApJ, 982, 186, doi: 10.3847/1538-4357/adb622 LSST Dark Energy Science Collaboration (LSST DESC),
-
[46]
2021, ApJS, 253, 31, doi: 10.3847/1538-4365/abd62c L¨ u, J., Zou, Y.-C., Lei, W.-H., et al
Abolfathi, B., Alonso, D., et al. 2021, ApJS, 253, 31, doi: 10.3847/1538-4365/abd62c LSST Science Collaboration, Abell, P. A., Allison, J., et al. 2009, arXiv e-prints, arXiv:0912.0201, doi: 10.48550/arXiv.0912.0201
-
[47]
Dark Energy Survey Y3 results: blending shear and redshift biases in image simulations
MacCrann, N., Becker, M. R., McCullough, J., et al. 2022, MNRAS, 509, 3371, doi: 10.1093/mnras/stab2870
-
[48]
McClintock, T., Varga, T. N., Gruen, D., et al. 2019, MNRAS, 482, 1352, doi: 10.1093/mnras/sty2711
-
[49]
2021, JCAP, 2021, 020, doi: 10.1088/1475-7516/2021/05/020
McDaniel, A., Jeltema, T., & Profumo, S. 2021, JCAP, 2021, 020, doi: 10.1088/1475-7516/2021/05/020
-
[50]
Medezinski, E., Oguri, M., Nishizawa, A. J., et al. 2018, PASJ, 70, 30, doi: 10.1093/pasj/psy009
-
[51]
Meurer, A., Smith, C. P., Paprocki, M., et al. 2017, PeerJ Computer Science, 3, e103, doi: 10.7717/peerj-cs.103
-
[52]
, year = 1997, month = dec, volume = 490, pages =
Navarro, J. F., Frenk, C. S., & White, S. D. M. 1997, ApJ, 490, 493, doi: 10.1086/304888 Observations Time Allocation Committee, R., & Community Survey Definition Committees, C. 2025, arXiv e-prints, arXiv:2505.10574, doi: 10.48550/arXiv.2505.10574
-
[53]
2010, PASJ, 62, 1017, doi: 10.1093/pasj/62.4.1017
Oguri, M. 2010, PASJ, 62, 1017, doi: 10.1093/pasj/62.4.1017
-
[54]
2021, PASP, 133, 074504, doi: 10.1088/1538-3873/ac12db
Oguri, M. 2021, PASP, 133, 074504, doi: 10.1088/1538-3873/ac12db
-
[55]
Oguri, M., Takada, M., Okabe, N., & Smith, G. P. 2010, MNRAS, 405, 2215, doi: 10.1111/j.1365-2966.2010.16622.x
-
[56]
2018, MNRAS, 477, 2141, doi: 10.1093/mnras/sty762
Okumura, T. 2018, MNRAS, 477, 2141, doi: 10.1093/mnras/sty762
-
[57]
2023, arXiv e-prints, arXiv:2310.08175, doi: 10.48550/arXiv.2310.08175
Combet, C. 2023, arXiv e-prints, arXiv:2310.08175, doi: 10.48550/arXiv.2310.08175
-
[58]
2025, A&A, 700, A34, doi: 10.1051/0004-6361/202554107 Planck Collaboration, Ade, P
Payerne, C., Zhang, Z., Aguena, M., et al. 2025, A&A, 700, A34, doi: 10.1051/0004-6361/202554107 Planck Collaboration, Ade, P. A. R., Aghanim, N., et al. 2016, A&A, 594, A27, doi: 10.1051/0004-6361/201525823
-
[59]
2021, PhRvD, 103, 043503, doi: 10.1103/PhysRevD.103.043503
Porredon, A., Crocce, M., Fosalba, P., et al. 2021, PhRvD, 103, 043503, doi: 10.1103/PhysRevD.103.043503
-
[60]
2022, PhRvD, 106, 103530, doi: 10.1103/PhysRevD.106.103530
Porredon, A., Crocce, M., Elvin-Poole, J., et al. 2022, PhRvD, 106, 103530, doi: 10.1103/PhysRevD.106.103530
-
[61]
2019, MNRAS, 488, 3646, doi: 10.1093/mnras/stz1815
Robertson, A., Harvey, D., Massey, R., et al. 2019, MNRAS, 488, 3646, doi: 10.1093/mnras/stz1815
-
[62]
Robison, B., Hudson, M. J., Cuillandre, J.-C., et al. 2023, MNRAS, 523, 1614, doi: 10.1093/mnras/stad1519
-
[63]
Rykoff, E. S., Rozo, E., Busha, M. T., et al. 2014, ApJ, 785, 104, doi: 10.1088/0004-637X/785/2/104
-
[64]
S., Rozo, E., Hollowood, D., et al
Rykoff, E. S., Rozo, E., Hollowood, D., et al. 2016, ApJS, 224, 1, doi: 10.3847/0067-0049/224/1/1
-
[65]
2025, A&A, 700, A128, doi: 10.1051/0004-6361/202555719
Saxena, H., Sayers, J., Gavidia, A., et al. 2025, A&A, 700, A128, doi: 10.1051/0004-6361/202555719
-
[66]
2005, arXiv e-prints, astro, doi: 10.48550/arXiv.astro-ph/0509252
Schneider, P. 2005, arXiv e-prints, astro, doi: 10.48550/arXiv.astro-ph/0509252
-
[67]
1990, A&A, 231, 19
Schramm, T. 1990, A&A, 231, 19
1990
-
[68]
Sevilla-Noarbe, I., Bechtol, K., Carrasco Kind, M., et al. 2021, ApJS, 254, 24, doi: 10.3847/1538-4365/abeb66
-
[69]
Sheldon, E. S., & Huff, E. M. 2017, ApJ, 841, 24, doi: 10.3847/1538-4357/aa704b
-
[70]
2018, MNRAS, 475, 2421, doi: 10.1093/mnras/stx3366
Shin, T.-h., Clampitt, J., Jain, B., et al. 2018, MNRAS, 475, 2421, doi: 10.1093/mnras/stx3366
-
[71]
2026, arXiv e-prints, arXiv:2603.23689, doi: 10.48550/arXiv.2603.23689
Srinivasan, R., Shin, T.-h., von der Linden, A., et al. 2026, arXiv e-prints, arXiv:2603.23689, doi: 10.48550/arXiv.2603.23689
-
[72]
2020, MNRAS, 496, 4468, doi: 10.1093/mnras/staa1646
Sunayama, T., Park, Y., Takada, M., et al. 2020, MNRAS, 496, 4468, doi: 10.1093/mnras/staa1646
-
[73]
2025, PhRvD, 112, 063537, doi: 10.1103/ynqj-6hsb
To, C.-H., Krause, E., Chang, C., et al. 2025, PhRvD, 112, 063537, doi: 10.1103/ynqj-6hsb
-
[74]
The Projected Dark and Baryonic Ellipsoidal Structure of 20 CLASH Galaxy Clusters.Astrophys
Umetsu, K., Sereno, M., Tam, S.-I., et al. 2018, ApJ, 860, 104, doi: 10.3847/1538-4357/aac3d9 van Uitert, E., Hoekstra, H., Joachimi, B., et al. 2017, MNRAS, 467, 4131, doi: 10.1093/mnras/stx344
-
[75]
N., DeRose, J., Gruen, D., et al
Varga, T. N., DeRose, J., Gruen, D., et al. 2019, MNRAS, 489, 2511, doi: 10.1093/mnras/stz2185
-
[76]
2025, A&A, 703, A45, doi: 10.1051/0004-6361/202555162
Vecchi, F., Harvey, D., Nightingale, J., et al. 2025, A&A, 703, A45, doi: 10.1051/0004-6361/202555162
-
[77]
Virtanen, P., Gommers, R., Oliphant, T. E., et al. 2020, Nature Medicine, 17, 261, doi: 10.1038/s41592-019-0686-2
-
[78]
Wright, C. O., & Brainerd, T. G. 2000, ApJ, 534, 34, doi: 10.1086/308744
-
[79]
2022, MNRAS, 515, 4471, doi: 10.1093/mnras/stac2048
Wu, H.-Y., Costanzi, M., To, C.-H., et al. 2022, MNRAS, 515, 4471, doi: 10.1093/mnras/stac2048
-
[80]
Yamamoto, M., Becker, M. R., Sheldon, E., et al. 2025, MNRAS, 543, 4156, doi: 10.1093/mnras/staf1661
discussion (0)
Sign in with ORCID, Apple, or X to comment. Anyone can read and Pith papers without signing in.