Recognition: no theorem link
Scylla VI: Parsec-Scale Dust Extinction Maps in the SMC and LMC
Pith reviewed 2026-05-11 00:56 UTC · model grok-4.3
The pith
A statistical method produces 1-parsec dust extinction maps of the Magellanic Clouds from HST data.
A machine-rendered reading of the paper's core claim, the machinery that carries it, and where it could break.
Core claim
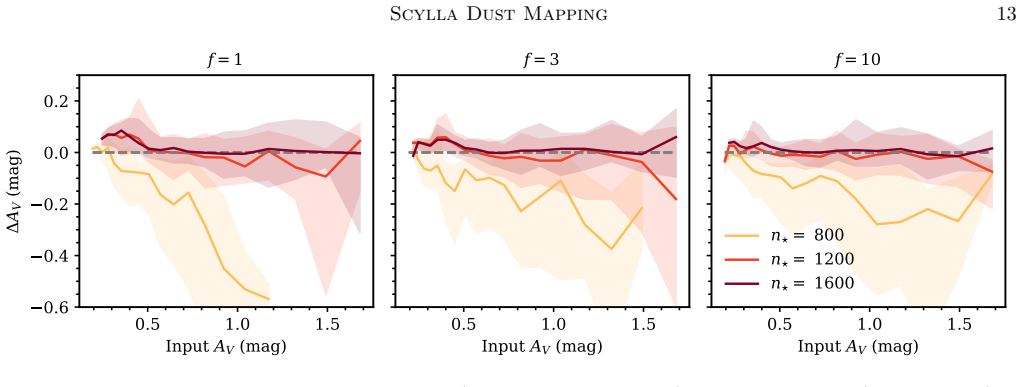
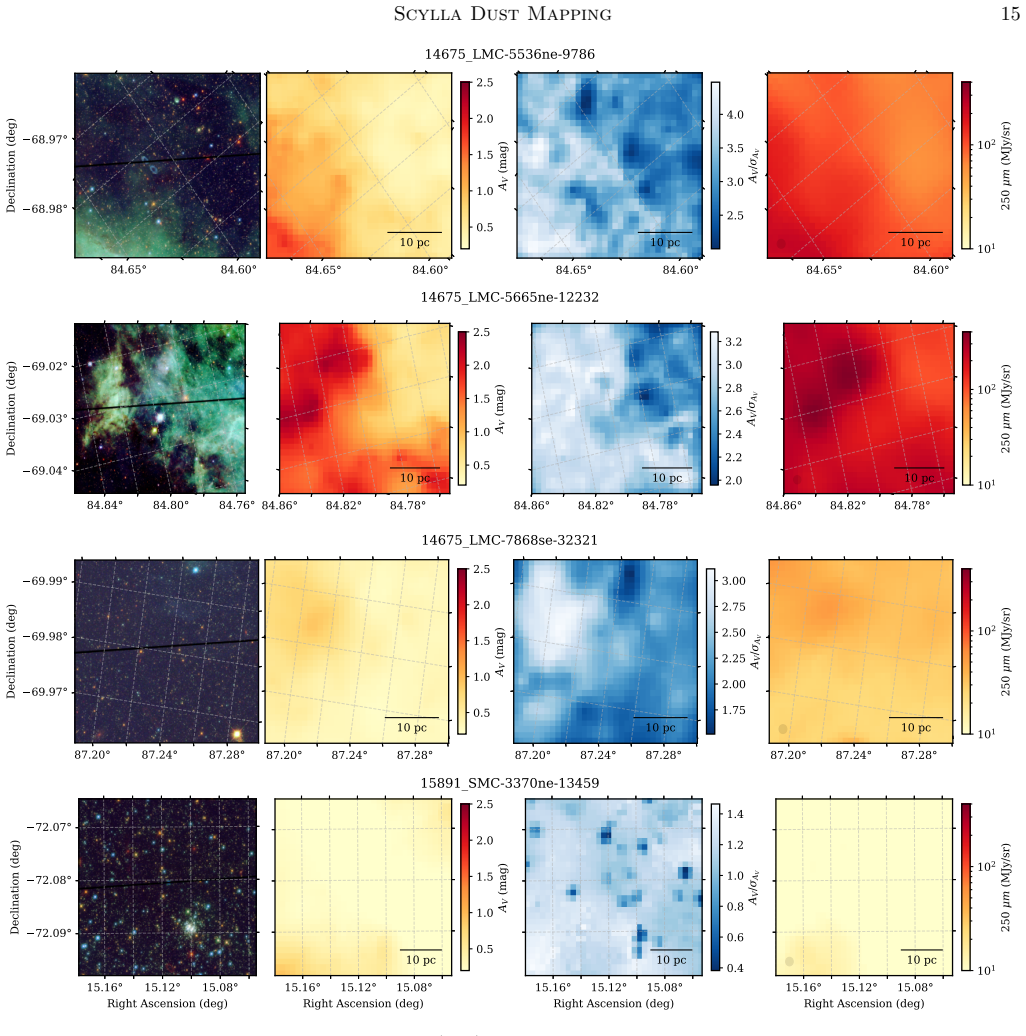
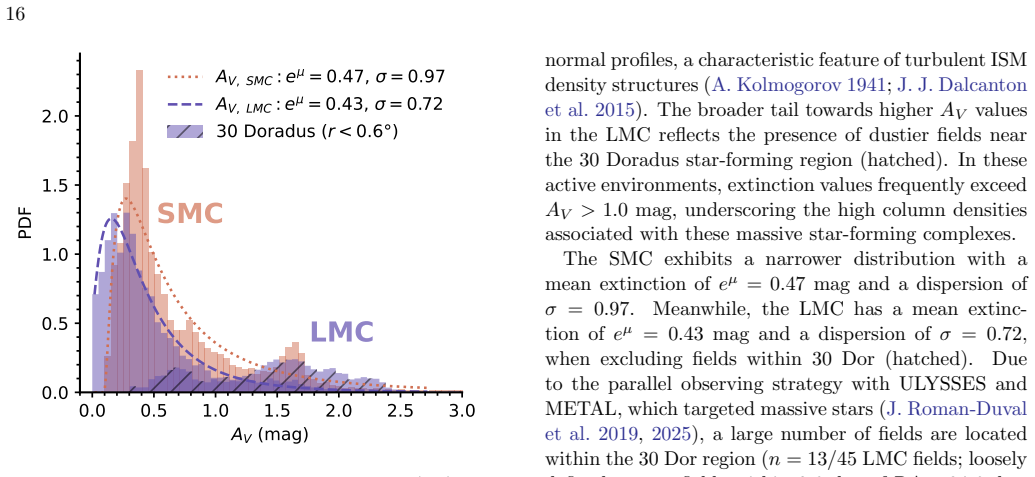
We present a novel methodology for mapping dust extinction in nearby galaxies at parsec-scale resolution. We apply it to 68 HST fields within the SMC and LMC using multi-band photometry. The technique uses kriging combined with Gaussian mixture modeling to isolate background sources and account for line-of-sight depth effects. Simulations recover column densities to A_V ≈ 0.1 mag accuracy with at least 1000 sources. The 4'' (~1-pc) maps show detailed structure and spatial correlation with ISM tracers in regions like 30 Doradus. Column densities follow log-normal profiles, with SMC mean extinction (e^μ=0.47 mag) slightly higher than LMC (e^μ=0.43 mag). Systematic offsets appear between dust ṁ
What carries the argument
Kriging interpolation combined with Gaussian mixture modeling to isolate background stellar sources and correct for line-of-sight depth effects while generating the extinction maps.
If this is right
- The maps provide the highest-resolution dust extinction data available for the SMC and LMC.
- Total column densities follow log-normal distributions in both galaxies.
- The SMC exhibits slightly higher mean extinction than the LMC due to line-of-sight depths.
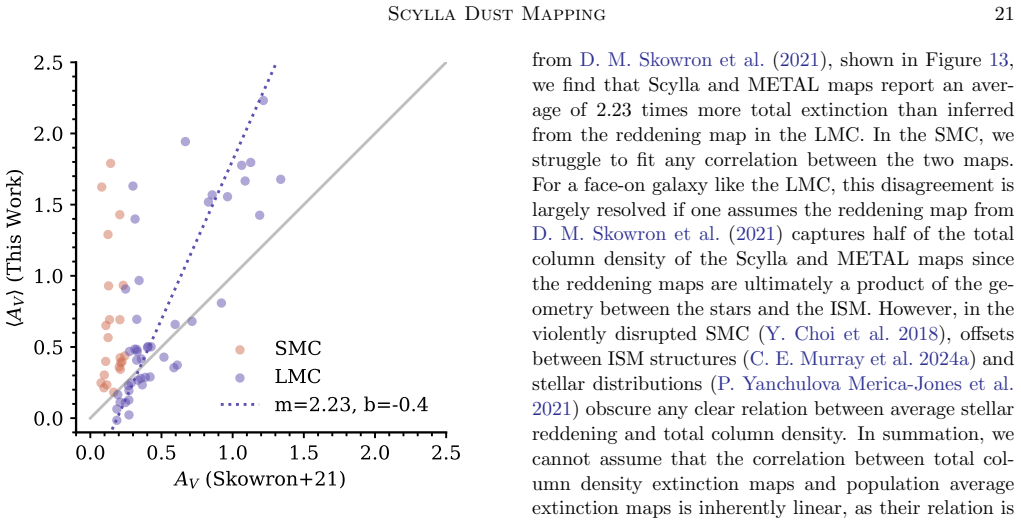
- Systematic offsets exist between dust mass surface densities from extinction and from FIR emission.
- The maps serve as benchmarks for dust emissivity, CO-dark gas fractions, and ISM structure in low-metallicity environments.
Where Pith is reading between the lines
- The same kriging and mixture modeling approach could be tested on multi-band imaging of other nearby galaxies to produce comparable resolution maps.
- The observed offsets between extinction and FIR dust masses may reflect real variations in grain properties or temperature at low metallicity.
- Cross-checks with independent extinction tracers like background galaxies or gamma-ray bursts could test the simulation-based validation.
- These maps enable direct comparison of dust distribution to young star clusters to study how extinction affects star formation on parsec scales.
Load-bearing premise
The kriging interpolation combined with Gaussian mixture modeling accurately accounts for line-of-sight depth effects and isolates background sources without introducing biases in the extinction estimates.
What would settle it
Independent measurements of dust column density in the same fields, such as from molecular line maps or submillimeter continuum, that show mismatches in spatial structure or values exceeding 0.1 mag in regions like 30 Doradus would indicate the method does not recover true extinctions reliably.
Figures


read the original abstract
We present a novel methodology for mapping dust extinction in nearby galaxies at parsec-scale resolution. We apply it to HST 68 fields within the Small and Large Magellanic Clouds (23 fields in the SMC and 45 fields in the LMC) using multi-band HST photometry from the Scylla and METAL surveys. Our technique leverages \textit{kriging}, a geostatistical interpolation method built on the principles of Gaussian Process regression, combined with Gaussian mixture modeling to statistically isolate background stellar sources and account for line-of-sight depth effects. 3D dust simulations demonstrate the method's capability to recover column densities to an accuracy of $A_V \approx 0.1$ mag in fields with at least 1000 sources. The resulting $4^{\prime\prime}$ resolution ($\sim1$-pc) dust maps reveal detailed structure and strong spatial correlation with ancillary ISM tracers, especially in star-forming regions like 30 Doradus. Global extinction of total column densities follows log-normal profiles in both galaxies, with the SMC exhibiting slightly higher mean extinction ($e^{\mu}=0.47$ mag) than the broader LMC ($e^{\mu}=0.43$ mag), likely due to significant line-of-sight depths. We find systematic offsets between dust mass surface densities ($\Sigma_{D}$) derived from extinction versus FIR emission in both galaxies, with $\Sigma_{D, FIR}/\Sigma_{D, A_V}$ ratios ranging from $0.6-1.8$. This work provides the highest-resolution dust extinction maps in SMC and LMC to date, which offer a vital independent benchmark for constraining dust emissivity, $\text{CO}$-dark gas fractions, and the multi-scale structure of the ISM in low-metallicity environments.
Editorial analysis
A structured set of objections, weighed in public.
Referee Report
Summary. The paper introduces a kriging (Gaussian process) interpolation method combined with Gaussian mixture modeling applied to HST multi-band photometry from the Scylla and METAL surveys across 68 fields (23 SMC, 45 LMC). It validates the approach via 3D dust simulations that recover A_V to ~0.1 mag accuracy for fields with >=1000 sources, then presents the resulting 4'' (~1 pc) extinction maps, their spatial correlations with ISM tracers (especially in regions like 30 Doradus), log-normal distributions of total column densities (SMC e^μ=0.47 mag vs LMC e^μ=0.43 mag), and systematic offsets between extinction-derived and FIR-derived dust surface densities (ratios 0.6-1.8).
Significance. If the core assumptions hold, this delivers the highest-resolution dust extinction maps yet for the Magellanic Clouds and supplies an independent benchmark for dust emissivity, CO-dark gas fractions, and multi-scale ISM structure in low-metallicity systems. The simulation validation demonstrating quantitative recovery accuracy is a clear strength, as are the reported correlations with ancillary tracers.
major comments (2)
- [Abstract and method validation] The validation that kriging+GMM successfully isolates background sources and corrects for the known kpc-scale line-of-sight depth (Abstract; implied in the method description) rests exclusively on idealized 3D simulations with prescribed stellar populations and depth distributions. Real SMC/LMC fields contain mixed-age stars, spatially varying reddening laws, and depth variations that may not match the simulation priors; any residual bias would propagate directly into the reported spatial correlations, log-normal parameters, and Σ_D,FIR/Σ_D,A_V ratios. A cross-check against independent real-data extinction measurements (e.g., from other surveys or spectroscopic samples) is needed to confirm the claimed 0.1 mag accuracy.
- [Results and discussion of FIR comparison] The systematic offsets between extinction-based and FIR-based dust surface densities (Abstract; ratios ranging 0.6-1.8) are highlighted as a key result but are described as not fully resolved. Because this directly affects constraints on dust emissivity and CO-dark gas, the manuscript should expand the discussion of possible causes (e.g., assumptions in the FIR modeling or residual depth biases in the A_V maps) with quantitative tests.
minor comments (2)
- [Abstract] The abstract states 'strong spatial correlation with ancillary ISM tracers'; quantify the correlation coefficients or specify the exact tracers (e.g., HI, CO, Hα) and their spatial scales for clarity.
- The kriging hyperparameters (length scale, variance) and GMM component number are free parameters; provide a table or explicit justification for the adopted values and any sensitivity tests performed.
Simulated Author's Rebuttal
We thank the referee for their constructive and detailed review. Their comments identify areas where additional discussion and transparency will improve the manuscript. We address each major comment below, indicating planned revisions where appropriate.
read point-by-point responses
-
Referee: The validation that kriging+GMM successfully isolates background sources and corrects for the known kpc-scale line-of-sight depth (Abstract; implied in the method description) rests exclusively on idealized 3D simulations with prescribed stellar populations and depth distributions. Real SMC/LMC fields contain mixed-age stars, spatially varying reddening laws, and depth variations that may not match the simulation priors; any residual bias would propagate directly into the reported spatial correlations, log-normal parameters, and Σ_D,FIR/Σ_D,A_V ratios. A cross-check against independent real-data extinction measurements (e.g., from other surveys or spectroscopic samples) is needed to confirm the claimed 0.1 mag accuracy.
Authors: We appreciate the referee's emphasis on validation robustness. Our 3D simulations incorporate stellar populations and depth distributions drawn from observational constraints in the literature for the SMC and LMC, including mixed stellar ages and kpc-scale depths, with parameter variations to test sensitivity. We acknowledge that they remain idealized with respect to spatially varying reddening laws. A full cross-check against independent real-data extinction maps at 1-pc resolution is not feasible at present, as no such uniform datasets exist for the 68 fields. We will revise the methods and discussion sections to provide greater detail on simulation priors, their limitations, and any available lower-resolution comparisons with literature values (e.g., in 30 Doradus). This constitutes a partial revision focused on transparency rather than new empirical validation. revision: partial
-
Referee: The systematic offsets between extinction-based and FIR-based dust surface densities (Abstract; ratios ranging 0.6-1.8) are highlighted as a key result but are described as not fully resolved. Because this directly affects constraints on dust emissivity and CO-dark gas, the manuscript should expand the discussion of possible causes (e.g., assumptions in the FIR modeling or residual depth biases in the A_V maps) with quantitative tests.
Authors: We agree that the offsets merit expanded quantitative discussion given their relevance to dust emissivity and CO-dark gas. In the revised manuscript we will add tests that perturb FIR modeling assumptions (dust temperature and emissivity index) via Monte Carlo realizations and quantify their effect on the Σ_D,FIR/Σ_D,A_V ratios. We will also examine whether the offsets correlate with field properties such as local star-formation activity or estimated line-of-sight depth to assess possible residual biases in the A_V maps. These additions will clarify the range of plausible causes without altering the reported measurements. revision: yes
Circularity Check
No significant circularity detected
full rationale
The paper's core derivation applies kriging interpolation combined with Gaussian mixture modeling directly to HST multi-band photometry from the Scylla and METAL surveys to produce extinction maps at 4 arcsec resolution. Validation of recovery accuracy (A_V ≈ 0.1 mag for fields with ≥1000 sources) is performed on independent 3D dust simulations with prescribed depth distributions, which are external to the observational inputs. Reported results such as log-normal column-density profiles (e^μ = 0.47 mag in SMC, 0.43 mag in LMC), spatial correlations with ISM tracers, and Σ_D,FIR / Σ_D,A_V ratios are direct statistical summaries of the output maps rather than quantities fitted or defined in terms of the inputs. No self-citations, ansatzes, or uniqueness theorems are invoked as load-bearing steps in the provided text, and the method does not rename or reconstruct known results by construction.
Axiom & Free-Parameter Ledger
free parameters (2)
- Kriging hyperparameters (e.g., length scale, variance)
- Number of components in Gaussian mixture model
axioms (2)
- standard math Assumptions of Gaussian Process regression for spatial interpolation
- domain assumption Line-of-sight depth effects can be statistically modeled with GMM
Reference graph
Works this paper leans on
-
[1]
The Wide Field Infrared Survey Telescope: 100 Hubbles for the 2020s
Akeson, R., Armus, L., Bachelet, E., et al. 2019, arXiv e-prints, arXiv:1902.05569, doi: 10.48550/arXiv.1902.05569 Astropy Collaboration, Robitaille, T. P., Tollerud, E. J., et al. 2013, A&A, 558, A33, doi: 10.1051/0004-6361/201322068 Astropy Collaboration, Price-Whelan, A. M., Sip˝ ocz, B. M., et al. 2018, AJ, 156, 123, doi: 10.3847/1538-3881/aabc4f
-
[2]
doi:10.1111/j.1365-2966.2009.15598.x , archivePrefix =
Bekki, K., & Stanimirovi´ c, S. 2009, MNRAS, 395, 342, doi: 10.1111/j.1365-2966.2009.14514.x
-
[3]
2007, ApJ, 668, 949, doi: 10.1086/521385
Besla, G., Kallivayalil, N., Hernquist, L., et al. 2007, ApJ, 668, 949, doi: 10.1086/521385
-
[4]
Bestenlehner, J. M., Crowther, P. A., Caballero-Nieves, S. M., et al. 2020, MNRAS, 499, 1918, doi: 10.1093/mnras/staa2801
-
[5]
Block, D. L., Puerari, I., Elmegreen, B. G., & Bournaud, F. 2010, ApJL, 718, L1, doi: 10.1088/2041-8205/718/1/L1
-
[6]
Boggess, N. W., Mather, J. C., Weiss, R., et al. 1992, ApJ, 397, 420, doi: 10.1086/171797
-
[7]
P., et al
Boulanger, F., Abergel, A., Bernard, J. P., et al. 1996, A&A, 312, 256
1996
-
[8]
Bressan, A., Marigo, P., Girardi, L., et al. 2012, MNRAS, 427, 127, doi: 10.1111/j.1365-2966.2012.21948.x
-
[9]
Burhenne, C., McQuinn, K. B. W., Cohen, R. E., et al. 2025, arXiv e-prints, arXiv:2511.02947, doi: 10.48550/arXiv.2511.02947
-
[10]
Burkhart, B., Collins, D. C., & Lazarian, A. 2015, ApJ, 808, 48, doi: 10.1088/0004-637X/808/1/48
-
[11]
Cardelli, J. A., Clayton, G. C., & Mathis, J. S. 1989, ApJ, 345, 245, doi: 10.1086/167900
-
[12]
M., Berta, S., B´ ethermin, M., et al
Casey, C. M., Berta, S., B´ ethermin, M., et al. 2012, ApJ, 761, 140, doi: 10.1088/0004-637X/761/2/140
-
[13]
Chen, B. Q., Guo, H. L., Gao, J., et al. 2022, MNRAS, 511, 1317, doi: 10.1093/mnras/stac072
-
[14]
Chevance, M., Madden, S. C., Fischer, C., et al. 2020, MNRAS, 494, 5279, doi: 10.1093/mnras/staa1106
-
[15]
Choi, Y., Olsen, K. A. G., Besla, G., et al. 2022, ApJ, 927, 153, doi: 10.3847/1538-4357/ac4e90
-
[16]
Choi, Y., Nidever, D. L., Olsen, K., et al. 2018, ApJ, 866, 90, doi: 10.3847/1538-4357/aae083 24
-
[17]
Choi, Y., Dalcanton, J. J., Williams, B. F., et al. 2020, The Astrophysical Journal, 902, 54, doi: 10.3847/1538-4357/abb467
-
[18]
Clark, C. J. R., Roman-Duval, J. C., Gordon, K. D., Bot, C., & Smith, M. W. L. 2021, ApJ, 921, 35, doi: 10.3847/1538-4357/ac16d4
-
[19]
Clark, C. J. R., Roman-Duval, J. C., Gordon, K. D., et al. 2023, ApJ, 946, 42, doi: 10.3847/1538-4357/acbb66
-
[20]
1992, Terra Nova, 4, 613, doi: 10.1111/j.1365-3121.1992.tb00605.x
Cressie, N. 1992, Terra Nova, 4, 613, doi: 10.1111/j.1365-3121.1992.tb00605.x
-
[21]
Crowther, P. A., Caballero-Nieves, S. M., Bostroem, K. A., et al. 2016, MNRAS, 458, 624, doi: 10.1093/mnras/stw273
-
[22]
Cullinane, L. R., Mackey, A. D., Da Costa, G. S., et al. 2022, MNRAS, 510, 445, doi: 10.1093/mnras/stab3350
-
[23]
Dalcanton, J. J., Williams, B. F., Lang, D., et al. 2012, ApJS, 200, 18, doi: 10.1088/0067-0049/200/2/18
-
[24]
Dalcanton, J. J., Fouesneau, M., Hogg, D. W., et al. 2015, ApJ, 814, 3, doi: 10.1088/0004-637X/814/1/3 de Grijs, R., & Bono, G. 2015, AJ, 149, 179, doi: 10.1088/0004-6256/149/6/179 de Grijs, R., Wicker, J. E., & Bono, G. 2014, AJ, 147, 122, doi: 10.1088/0004-6256/147/5/122
-
[25]
Dharmawardena, T. E., Bailer-Jones, C. A. L., Fouesneau, M., et al. 2023, MNRAS, 519, 228, doi: 10.1093/mnras/stac2790
-
[26]
Dolphin, A. E. 2002, MNRAS, 332, 91, doi: 10.1046/j.1365-8711.2002.05271.x D’Onghia, E., & Fox, A. J. 2016, ARA&A, 54, 363, doi: 10.1146/annurev-astro-081915-023251
-
[27]
Draine, B. T. 2003, ARA&A, 41, 241, doi: 10.1146/annurev.astro.41.011802.094840
-
[28]
Draine, B. T., Dale, D. A., Bendo, G., et al. 2007, ApJ, 663, 866, doi: 10.1086/518306
-
[29]
T., Aniano, G., Krause, O., et al
Draine, B. T., Aniano, G., Krause, O., et al. 2014, ApJ, 780, 172, doi: 10.1088/0004-637X/780/2/172
-
[30]
Edenhofer, G., Zucker, C., Frank, P., et al. 2024, A&A, 685, A82, doi: 10.1051/0004-6361/202347628
-
[31]
G., Kim, S., & Staveley-Smith, L
Elmegreen, B. G., Kim, S., & Staveley-Smith, L. 2001, ApJ, 548, 749, doi: 10.1086/319021
-
[32]
Federrath, C., Roman-Duval, J., Klessen, R. S., Schmidt, W., & Mac Low, M.-M. 2010, A&A, 512, A81, doi: 10.1051/0004-6361/200912437
-
[33]
Fitzpatrick, E. L. 1999, PASP, 111, 63, doi: 10.1086/316293
-
[34]
Fox, A. J., Barger, K. A., Wakker, B. P., et al. 2018, ApJ, 854, 142, doi: 10.3847/1538-4357/aaa9bb Gaia Collaboration, Helmi, A., van Leeuwen, F., et al. 2018, A&A, 616, A12, doi: 10.1051/0004-6361/201832698
-
[35]
Gilbert, K. M., Choi, Y., Boyer, M. L., et al. 2025, ApJS, 276, 8, doi: 10.3847/1538-4365/ad76af
-
[36]
Gordon, K. D., Clayton, G. C., Decleir, M., et al. 2023, ApJ, 950, 86, doi: 10.3847/1538-4357/accb59
-
[37]
Gordon, K. D., Clayton, G. C., Misselt, K. A., Landolt, A. U., & Wolff, M. J. 2003, ApJ, 594, 279, doi: 10.1086/376774
-
[38]
D., Roman-Duval, J., Bot, C., et al
Gordon, K. D., Roman-Duval, J., Bot, C., et al. 2014, ApJ, 797, 85, doi: 10.1088/0004-637X/797/2/85
-
[39]
D., Fouesneau, M., Arab, H., et al
Gordon, K. D., Fouesneau, M., Arab, H., et al. 2016, ApJ, 826, 104, doi: 10.3847/0004-637X/826/2/104 G´ orski, M., Zgirski, B., Pietrzy´ nski, G., et al. 2020, ApJ, 889, 179, doi: 10.3847/1538-4357/ab65ed
-
[40]
Harris, C. R., Millman, K. J., van der Walt, S. J., et al. 2020, Nature, 585, 357, doi: 10.1038/s41586-020-2649-2
-
[41]
Haschke, R., Grebel, E. K., & Duffau, S. 2011, AJ, 141, 158, doi: 10.1088/0004-6256/141/5/158
-
[42]
2024, A&A, 688, A105, doi: 10.1051/0004-6361/202245588
Hawcroft, C., Sana, H., Mahy, L., et al. 2024, A&A, 688, A105, doi: 10.1051/0004-6361/202245588
-
[43]
Henize, K. G. 1956, ApJS, 2, 315, doi: 10.1086/190025
-
[44]
Hunter, D. A., Shaya, E. J., Holtzman, J. A., et al. 1995, ApJ, 448, 179, doi: 10.1086/175950
-
[45]
Hunter, J. D. 2007, Computing in Science and Engineering, 9, 90, doi: 10.1109/MCSE.2007.55
-
[46]
2007, ApJ, 662, 969, doi: 10.1086/517911 Ivezi´ c,ˇZ., Kahn, S
Imara, N., & Blitz, L. 2007, ApJ, 662, 969, doi: 10.1086/517911 Ivezi´ c,ˇZ., Kahn, S. M., Tyson, J. A., et al. 2019, ApJ, 873, 111, doi: 10.3847/1538-4357/ab042c
-
[47]
Jacyszyn-Dobrzeniecka, A. M., Skowron, D. M., Mr´ oz, P., et al. 2016, AcA, 66, 149, doi: 10.48550/arXiv.1602.09141
-
[48]
A., Staveley-Smith, L., & Bessell, M
Kim, S., Dopita, M. A., Staveley-Smith, L., & Bessell, M. S. 1999, AJ, 118, 2797, doi: 10.1086/301116 K¨ ohler, M., Ysard, N., & Jones, A. P. 2015, A&A, 579, A15, doi: 10.1051/0004-6361/201525646
-
[49]
1941, Akademiia Nauk SSSR Doklady, 30, 301
Kolmogorov, A. 1941, Akademiia Nauk SSSR Doklady, 30, 301
1941
-
[50]
Leike, R. H., Glatzle, M., & Enßlin, T. A. 2020, A&A, 639, A138, doi: 10.1051/0004-6361/202038169
-
[51]
Lindberg, C. W., Murray, C. E., Dalcanton, J. J., Peek, J. E. G., & Gordon, K. D. 2024, ApJ, 963, 58, doi: 10.3847/1538-4357/ad18cc
-
[52]
Lindberg, C. W., Murray, C. E., Yanchulova Merica-Jones, P., et al. 2025, ApJ, 982, 33, doi: 10.3847/1538-4357/adb4e8
-
[53]
2014, ApJ, 783, 17, doi: 10.1088/0004-637X/783/1/17
Liszt, H. 2014, ApJ, 783, 17, doi: 10.1088/0004-637X/783/1/17
-
[54]
Massana, P., Ruiz-Lara, T., No¨ el, N. E. D., et al. 2022, MNRAS, 513, L40, doi: 10.1093/mnrasl/slac030
-
[55]
doi:10.1111/j.1365-2966.2009.15598.x , archivePrefix =
Mastropietro, C., Burkert, A., & Moore, B. 2009, MNRAS, 399, 2004, doi: 10.1111/j.1365-2966.2009.15406.x
-
[56]
1963, Economic Geology, 58, 1246, doi: 10.2113/gsecongeo.58.8.1246 Scylla Dust Mapping25
Matheron, G. 1963, Economic Geology, 58, 1246, doi: 10.2113/gsecongeo.58.8.1246 Scylla Dust Mapping25
-
[57]
McClure-Griffiths, N. M., Pisano, D. J., Calabretta, M. R., et al. 2009, ApJS, 181, 398, doi: 10.1088/0067-0049/181/2/398
-
[58]
Meixner, M., Gordon, K. D., Indebetouw, R., et al. 2006, AJ, 132, 2268, doi: 10.1086/508185
-
[59]
2013, AJ, 146, 62, doi: 10.1088/0004-6256/146/3/62
Meixner, M., Panuzzo, P., Roman-Duval, J., et al. 2013, AJ, 146, 62, doi: 10.1088/0004-6256/146/3/62
-
[60]
C., Anderson, L., Leistedt, B., et al
Miller, A. C., Anderson, L., Leistedt, B., et al. 2022, arXiv e-prints, arXiv:2202.06797, doi: 10.48550/arXiv.2202.06797
-
[61]
2021, GeoStat-Framework/PyKrige: v1.6.0, v1.6.0 Zenodo, doi: 10.5281/zenodo.4661732
Murphy, B., M¨ uller, S., & Yurchak, R. 2021, GeoStat-Framework/PyKrige: v1.6.0, v1.6.0 Zenodo, doi: 10.5281/zenodo.4661732
-
[62]
Murray, C. E., Peek, J. E. G., Di Teodoro, E. M., et al. 2019, ApJ, 887, 267, doi: 10.3847/1538-4357/ab510f
-
[63]
Murray, C. E., Hasselquist, S., Peek, J. E. G., et al. 2024a, ApJ, 962, 120, doi: 10.3847/1538-4357/ad1591
-
[64]
Murray, C. E., Lindberg, C. W., Yanchulova Merica-Jones, P., et al. 2024b, ApJS, 275, 5, doi: 10.3847/1538-4365/ad6de2
-
[65]
Neugebauer, G., Habing, H. J., van Duinen, R., et al. 1984, ApJL, 278, L1, doi: 10.1086/184209
-
[66]
Nidever, D. L., Majewski, S. R., & Butler Burton, W. 2008, ApJ, 679, 432, doi: 10.1086/587042
-
[67]
Nidever, D. L., Olsen, K., Walker, A. R., et al. 2017, AJ, 154, 199, doi: 10.3847/1538-3881/aa8d1c
-
[68]
2001, ApJL, 555, L33, doi: 10.1086/321735
Padoan, P., Kim, S., Goodman, A., & Staveley-Smith, L. 2001, ApJL, 555, L33, doi: 10.1086/321735
-
[69]
2020, ApJ, 893, 121, doi: 10.3847/1538-4357/ab7b75
Patel, E., Kallivayalil, N., Garavito-Camargo, N., et al. 2020, ApJ, 893, 121, doi: 10.3847/1538-4357/ab7b75
-
[70]
Pietrzynski, G., Graczyk, D., Gallenne, A., et al. 2019, arXiv e-prints. https://arxiv.org/abs/1903.08096
-
[71]
M., Dempsey, J., McClure-Griffiths, N
Pingel, N. M., Dempsey, J., McClure-Griffiths, N. M., et al. 2022, PASA, 39, e005, doi: 10.1017/pasa.2021.59 Planck Collaboration, Ade, P. A. R., Aghanim, N., et al. 2011, A&A, 536, A1, doi: 10.1051/0004-6361/201116464 Planck Collaboration, Ade, P. A. R., Aghanim, N., et al. 2016, A&A, 586, A132, doi: 10.1051/0004-6361/201424945
-
[72]
Rachford, B. L., Snow, T. P., Destree, J. D., et al. 2009, ApJS, 180, 125, doi: 10.1088/0067-0049/180/1/125 Rezaei Kh., S., Bailer-Jones, C. A. L., Hogg, D. W., &
-
[73]
Schultheis, M. 2018, A&A, 618, A168, doi: 10.1051/0004-6361/201833284
-
[74]
Roman-Duval, J., Jenkins, E. B., Williams, B., et al. 2019, ApJ, 871, 151, doi: 10.3847/1538-4357/aaf8bb
-
[75]
Roman-Duval, J., Jenkins, E. B., Tchernyshyov, K., et al. 2021, ApJ, 910, 95, doi: 10.3847/1538-4357/abdeb6
-
[76]
Roman-Duval, J., Fischer, W. J., Fullerton, A. W., et al. 2025, ApJ, 985, 109, doi: 10.3847/1538-4357/adc45b
-
[77]
Romaniello, M., Panagia, N., Scuderi, S., & Kirshner, R. P. 2002, AJ, 123, 915, doi: 10.1086/338430
-
[78]
Russell, S. C., & Dopita, M. A. 1992, ApJ, 384, 508, doi: 10.1086/170893
-
[79]
Sabbi, E., Anderson, J., Lennon, D. J., et al. 2013, AJ, 146, 53, doi: 10.1088/0004-6256/146/3/53
-
[80]
Scowcroft, V., Freedman, W. L., Madore, B. F., et al. 2016, ApJ, 816, 49, doi: 10.3847/0004-637X/816/2/49
discussion (0)
Sign in with ORCID, Apple, or X to comment. Anyone can read and Pith papers without signing in.