Recognition: 2 theorem links
· Lean TheoremAnisotropic Thermal Conduction as a Driver of Jet Collimation and Magnetic Field Amplification on Cold Fronts
Pith reviewed 2026-05-11 00:59 UTC · model grok-4.3
The pith
Anisotropic thermal conduction along magnetic fields increases inner cocoon pressure to collimate AGN jets by a factor of four and amplify fields on cold fronts by 1.5 times.
A machine-rendered reading of the paper's core claim, the machinery that carries it, and where it could break.
Core claim
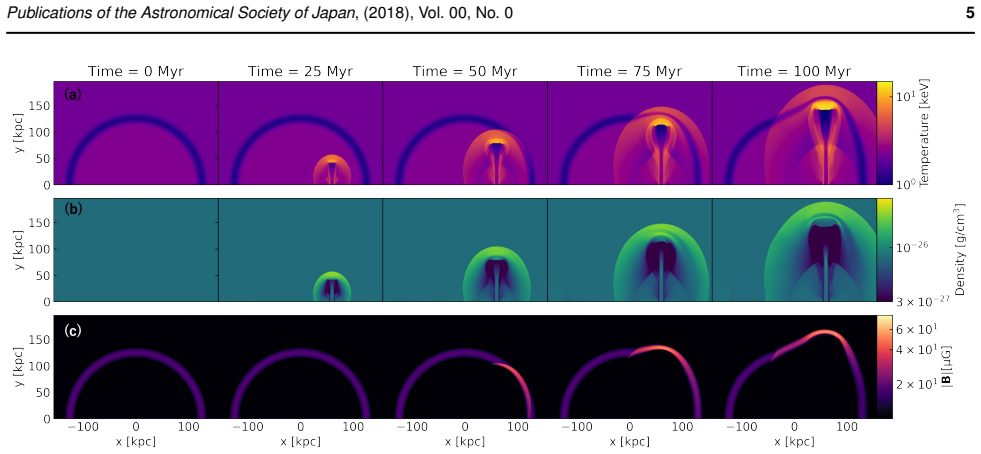
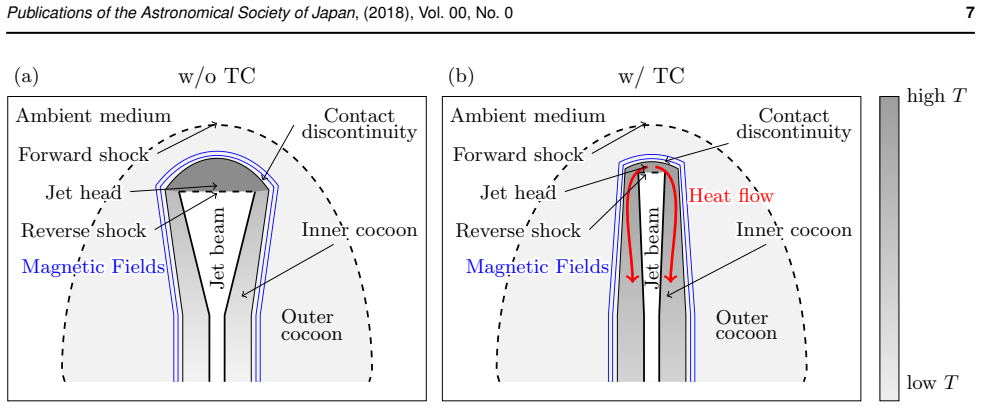
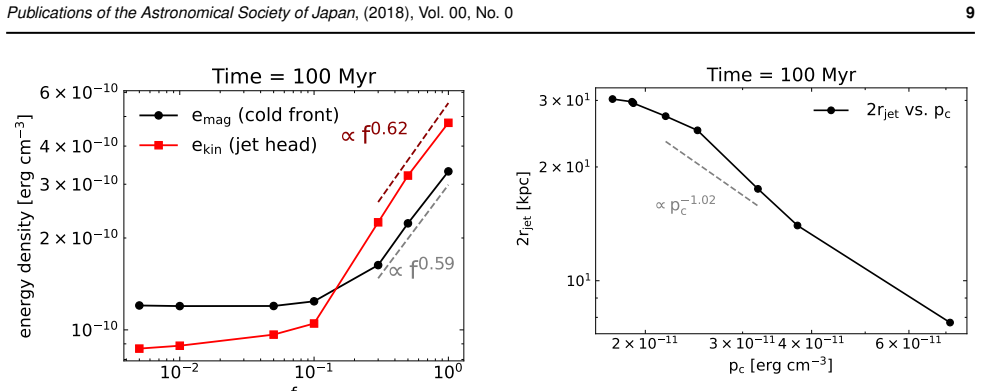
In two-dimensional magnetohydrodynamic simulations of an AGN jet propagating through the intracluster medium with cold fronts, anisotropic thermal conduction transports heat from the jet head backward along magnetic field lines into the inner cocoon. This heat addition raises the pressure in the inner cocoon, enhancing jet collimation by a factor of approximately four relative to models without conduction. The stronger collimation stretches the magnetic fields along the cold-front surface, resulting in a maximum field strength up to a factor of 1.5 larger. Jet collimation increases as conduction efficiency increases, supporting anisotropic thermal conduction as a driver of both jet collimati
What carries the argument
Anisotropic thermal conduction along magnetic field lines, which carries heat into the inner cocoon to raise its pressure and produce conductive collimation of the jet.
If this is right
- Jet collimation strengthens as conduction efficiency increases.
- Magnetic fields along cold-front surfaces reach up to 1.5 times higher peak strength.
- Anisotropic conduction operates effectively on AGN jet scales within galaxy clusters.
- Accounting for conduction changes interpretations of observed jet morphology and magnetic field configurations in merging clusters.
Where Pith is reading between the lines
- Three-dimensional versions of the simulations could show how turbulence or instabilities modify the pressure buildup and collimation.
- Polarization maps or Faraday rotation measures from radio observations of cold-front regions could test the predicted field stretching.
- The mechanism may alter estimates of how much energy AGN jets deposit into the surrounding intracluster medium.
- Similar heat-transport effects could appear in other magnetized jet systems where field lines connect hot and cooler plasma regions.
Load-bearing premise
The two-dimensional MHD approximation with anisotropic conduction accurately represents three-dimensional plasma dynamics in galaxy clusters without major numerical artifacts or missing effects such as turbulence.
What would settle it
High-resolution X-ray or radio observations of jet opening angles and magnetic field strengths near cold fronts in a merging cluster that show no enhancement compared to non-conducting models would falsify the mechanism.
Figures


read the original abstract
Galaxy clusters contain a hot, diffuse, and weakly magnetized plasma known as the intracluster medium (ICM). In this environment, how thermal conduction influences plasma dynamics and the conditions under which it operates efficiently remain open questions in cluster physics. Systems in which active galactic nuclei (AGN) jets interact with cold fronts produced by cluster mergers provide a unique setting to examine the interplay between conduction, jet dynamics, and ordered magnetic fields. To interpret the detailed structures revealed by recent observations, it is therefore important, as a first theoretical step, to quantify how thermal conduction modifies AGN jet morphology and the surrounding magnetic-field configuration. We perform two-dimensional magnetohydrodynamic (MHD) simulations of an AGN jet in an ICM environment, incorporating anisotropic thermal conduction with varying efficiency. The simulations show that thermal conduction transports heat from the jet head backward along magnetic field lines into the inner cocoon. This process increases the inner cocoon pressure, enhancing jet collimation by a factor of $\sim 4$ compared to models without conduction. This stronger collimation stretches the magnetic fields along the cold-front surface, resulting in a maximum field strength up to a factor of $\sim 1.5$ larger. Jet collimation increases as the conduction efficiency increases, which is interpreted as a conductive collimation mechanism. These results suggest that anisotropic thermal conduction can operate effectively on jet scales in galaxy clusters, and that accounting for conduction may be important when interpreting jet morphology and magnetic field structure in merging cluster environments.
Editorial analysis
A structured set of objections, weighed in public.
Referee Report
Summary. The manuscript reports 2D axisymmetric MHD simulations of an AGN jet propagating into an ICM with cold fronts, including anisotropic thermal conduction at varying efficiencies. It claims that conduction carries heat from the jet head backward along field lines into the inner cocoon, raising its pressure and thereby collimating the jet by a factor of ∼4 relative to no-conduction runs; the enhanced collimation then stretches and amplifies the magnetic field along the cold-front surface by up to a factor of ∼1.5. Jet collimation is reported to increase monotonically with conduction efficiency, interpreted as a 'conductive collimation' mechanism.
Significance. If robust, the result would identify a previously under-appreciated role for anisotropic conduction in setting jet morphology and magnetic-field structure on cold fronts, with direct implications for interpreting X-ray and radio observations of merging clusters. The systematic variation of conduction efficiency provides a clear, falsifiable trend that strengthens the causal interpretation.
major comments (2)
- [§2 and §3] §2 (Numerical Setup) and §3 (Results): All quantitative claims (factor-of-∼4 collimation boost, factor-of-∼1.5 B amplification) rest on 2D axisymmetric geometry. The mechanism requires long, ordered field lines connecting the jet head to the inner cocoon; 3D Kelvin-Helmholtz and current-driven instabilities at the jet-cocoon and cold-front interfaces would tangle these lines and shorten the effective conduction path. No 3D control runs, resolution study of these modes, or explicit discussion of dimensionality limitations are presented, so the reported factors may not survive in 3D.
- [§3] §3 (Results): The collimation factor is stated as ∼4 and the field amplification as ∼1.5, but the manuscript does not define the precise metric (e.g., jet opening angle at a fixed distance, cocoon aspect ratio, or half-width at half-maximum) nor report how these quantities are extracted from the snapshots. Without this definition and without convergence tests at different resolutions, it is impossible to assess whether the quoted numbers are robust or resolution-dependent.
minor comments (2)
- [Abstract and Introduction] The abstract and introduction use 'cold fronts produced by cluster mergers' without citing the specific observational papers that motivate the setup; adding 1–2 key references would improve context.
- Figure captions should explicitly state the conduction efficiency parameter (e.g., f_cond = 0, 0.1, 1) for each panel rather than relying on the legend alone.
Simulated Author's Rebuttal
We thank the referee for the careful and constructive review of our manuscript. The comments highlight important limitations of our 2D study and the need for clearer definitions of our quantitative metrics. We address each point below and will revise the manuscript accordingly where possible.
read point-by-point responses
-
Referee: [§2 and §3] §2 (Numerical Setup) and §3 (Results): All quantitative claims (factor-of-∼4 collimation boost, factor-of-∼1.5 B amplification) rest on 2D axisymmetric geometry. The mechanism requires long, ordered field lines connecting the jet head to the inner cocoon; 3D Kelvin-Helmholtz and current-driven instabilities at the jet-cocoon and cold-front interfaces would tangle these lines and shorten the effective conduction path. No 3D control runs, resolution study of these modes, or explicit discussion of dimensionality limitations are presented, so the reported factors may not survive in 3D.
Authors: We agree that the restriction to 2D axisymmetric geometry is a genuine limitation for the quantitative factors we report. The conductive collimation mechanism we identify depends on the maintenance of long, coherent magnetic field lines that enable efficient heat transport from the jet head to the inner cocoon. In 3D, the Kelvin-Helmholtz and current-driven instabilities cited by the referee would likely tangle these lines, shortening the effective conduction path and reducing both the pressure enhancement and the resulting collimation boost. Our choice of 2D was driven by the need to maintain high spatial resolution over long evolutionary times to capture the anisotropic conduction layers, which remains computationally prohibitive for equivalent 3D runs at present. We will add an explicit subsection in the revised manuscript discussing these dimensionality caveats, stating that the reported factors of ∼4 and ∼1.5 should be viewed as upper limits obtained in the idealized 2D case. We will also emphasize the need for future 3D simulations to test the robustness of the mechanism. We cannot provide 3D control runs within the scope of this revision. revision: partial
-
Referee: [§3] §3 (Results): The collimation factor is stated as ∼4 and the field amplification as ∼1.5, but the manuscript does not define the precise metric (e.g., jet opening angle at a fixed distance, cocoon aspect ratio, or half-width at half-maximum) nor report how these quantities are extracted from the snapshots. Without this definition and without convergence tests at different resolutions, it is impossible to assess whether the quoted numbers are robust or resolution-dependent.
Authors: We apologize for the insufficient detail on how the quantitative metrics were defined and extracted. In the revised manuscript we will explicitly define the collimation factor as the ratio of the jet half-width (measured via the full width at half-maximum of the radial velocity profile) at a fixed distance of 80 kpc from the AGN in the no-conduction run to the corresponding width in each conduction run. The magnetic-field amplification will be defined as the ratio of the peak |B| value sampled along the cold-front surface (identified by the density jump) in the conduction case to the no-conduction case. We will also describe the precise snapshot extraction procedure and averaging window used. Regarding convergence, the primary results are taken from our highest-resolution runs; we will add a short resolution study demonstrating that the monotonic trend of increasing collimation with conduction efficiency and the approximate magnitude of the factors remain consistent (within ∼15 %) when the grid spacing is coarsened by a factor of two. These additions will be incorporated into §3 and the methods section. revision: yes
Circularity Check
No circularity: results follow from direct simulation comparisons
full rationale
The paper reports outcomes from 2D MHD simulations that vary anisotropic conduction efficiency as an input parameter. Collimation factor ~4 and field amplification ~1.5 are measured by comparing runs with and without conduction; no parameters are fitted to observed targets, no self-citations underpin the central mechanism, and no uniqueness theorems or ansatzes are invoked. The derivation chain consists of the numerical evolution itself, which is independent of the reported quantitative factors.
Axiom & Free-Parameter Ledger
free parameters (1)
- conduction efficiency
axioms (2)
- standard math Standard MHD equations govern the plasma dynamics
- domain assumption Anisotropic thermal conduction follows magnetic field lines
Lean theorems connected to this paper
-
IndisputableMonolith/Foundation/Cost/FunctionalEquation.leanwashburn_uniqueness_aczel (J-cost uniqueness) unclearWe perform two-dimensional magnetohydrodynamic (MHD) simulations of an AGN jet in an ICM environment, incorporating anisotropic thermal conduction with varying efficiency... Jet collimation increases as the conduction efficiency increases, which is interpreted as a conductive collimation mechanism.
-
IndisputableMonolith/Foundation/AbsoluteFloorClosure.leanabsolute_floor_iff_bare_distinguishability unclearThe simulations show that thermal conduction transports heat from the jet head backward along magnetic field lines into the inner cocoon.
Reference graph
Works this paper leans on
-
[1]
2004, ApJ, 606, L105
Asai, N., Fukuda, N., & Matsumoto, R. 2004, ApJ, 606, L105
2004
-
[2]
2005, Adv
Asai, N., Fukuda, N., & Matsumoto, R. 2005, Adv. Space Res, 36, 636
2005
-
[3]
2007, ApJ, 663, 816
Asai, N., Fukuda, N., & Matsumoto, R. 2007, ApJ, 663, 816
2007
-
[4]
A., & McKee, C
Balbus, S. A., & McKee, C. F. 1982, ApJ, 252, 529
1982
-
[5]
2022, ApJ, 666, A71
Olivares, V. 2022, ApJ, 666, A71
2022
-
[6]
Braginskii, S. I. 1965, Rev. Plasma Phys., 1, 205
1965
-
[7]
O., et al
Chibueze, J. O., et al. 2023, PASJ, 75, S97
2023
-
[8]
O., Sakemi, H., Ohmura, T., et al
Chibueze, J. O., Sakemi, H., Ohmura, T., et al. 2021, Nature, 593, 47 (C21)
2021
-
[9]
L., & McKee, F
Cowie, L. L., & McKee, F. C. 1977, ApJ, 211, 135
1977
-
[10]
D., Schnitzer, T., & Wesenberg, M
Dedner, A., Kemm, F., Kröner, D., Munz, C. D., Schnitzer, T., & Wesenberg, M. 2002, JCoPh, 175, 645
2002
-
[11]
J., & Pfrommer, C
Dursi, L. J., & Pfrommer, C. 2008, ApJ, 677, 993
2008
-
[12]
D., Roe, P
Einfeldt, B., Munz, C. D., Roe, P. L., & Sjögreen, B. 1991, JCoPh, 92, 273
1991
-
[13]
E., Guo, F., Yuan, Y
Fang, X. E., Guo, F., Yuan, Y. F., & Mou, G. 2018, ApJ, 863, 177
2018
-
[14]
2022, ApJ, 934, 49
Giacintucci, S., et al. 2022, ApJ, 934, 49
2022
-
[15]
P., & Briel, U
Henry, J. P., & Briel, U. 1996, ApJ, 472, 137
1996
-
[16]
2006, MNRAS, 373, 73
Lyutikov, M. 2006, MNRAS, 373, 73
2006
-
[17]
2003, ApJ, 586, L19
Markevitch, M., et al. 2003, ApJ, 586, L19
2003
-
[18]
2007, Phys
Markevitch, M., & Vikhlinin, A. 2007, Phys. Rep., 443, 1
2007
-
[19]
D., Balsara, D
Meyer, C. D., Balsara, D. S., & Aslam, T. D. 2012, MNRAS, 422, 2102
2012
-
[20]
D., Balsara, D
Meyer, C. D., Balsara, D. S., & Aslam, T. D. 2014, JCoPh, 257, 594
2014
-
[21]
Narayan, R., & Medvedev, M. V. 2001, ApJ, 562, L129
2001
-
[22]
H., Smarr, L., & Smith, M
Norman, M., Winkler, K. H., Smarr, L., & Smith, M. 1982, A&A, 113, 285
1982
-
[23]
J., Quataert, E., & Sharma, P
Parrish, I. J., Quataert, E., & Sharma, P. 2009, ApJ, 703, 96
2009
-
[24]
2022, MNRAS, 514, 3925
Ceccobello, C. 2022, MNRAS, 514, 3925
2022
-
[25]
2025, J High Energy Astrophys, 47, 100394
Rezgui, G., & Preiner, R. 2025, J High Energy Astrophys, 47, 100394
2025
-
[26]
Sarazin, C. L. 1988, X-ray emission from clusters of galaxies (Cambridge: Cambridge University Press), chap.5
1988
-
[27]
2025, ApJ, 992, 14
Sakemi, H., et al. 2025, ApJ, 992, 14
2025
-
[28]
1962, Physics of fully ionized gases (Geneva: Interscience), chap.5 van Leer, B
Spitzer, L. 1962, Physics of fully ionized gases (Geneva: Interscience), chap.5 van Leer, B. 1979, JCoPh, 32, 101
1962
-
[29]
A., & Markevitch, M
Vikhlinin, A. A., & Markevitch, M. L. 2002, AstL, 28, 495
2002
-
[30]
Voit, G. M. 2005, RvMP, 77, 207
2005
-
[31]
A., & Roediger, E
ZuHone, J. A., & Roediger, E. 2016, JPlPh, 82
2016
discussion (0)
Sign in with ORCID, Apple, or X to comment. Anyone can read and Pith papers without signing in.