Recognition: 2 theorem links
· Lean TheoremA Unified Framework for the Detection and Classification of Fatty Pancreas in Ultrasound Images
Pith reviewed 2026-05-11 01:59 UTC · model grok-4.3
The pith
A segmentation-guided texture comparison framework classifies fatty pancreas in ultrasound images with 89.7 percent cross-validated accuracy.
A machine-rendered reading of the paper's core claim, the machinery that carries it, and where it could break.
Core claim
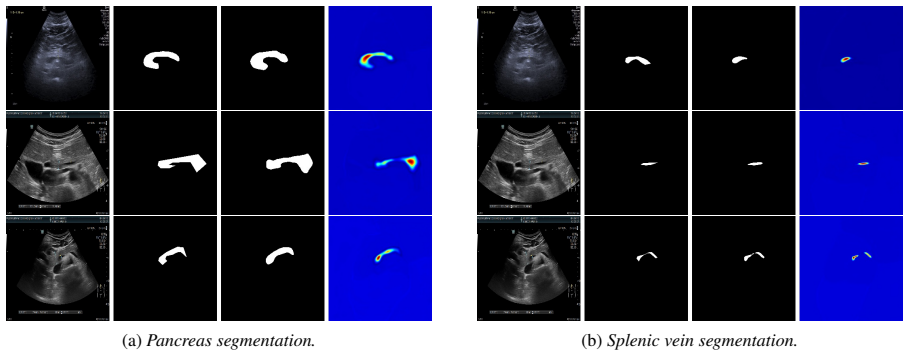
The central claim is that the proposed end-to-end framework, which uses a TransUNet architecture with ResNet encoder and transformer bottleneck initialized via transfer learning from liver segmentation to delineate the pancreas and splenic vein, followed by anatomically-guided patch extraction and patient-level classification via pairwise texture comparison of peri-venous fat to pancreatic parenchyma, achieves a mean cross-validated accuracy of 89.7% ± 1.8% and F1 of 0.898 ± 0.019 with SVM using RBF kernel on 107 labeled cases, while unsupervised K-Means reaches 87.8% accuracy.
What carries the argument
The pairwise texture comparison of peri-venous fat echogenicity to pancreatic parenchyma after segmentation-guided patch extraction, which provides an interpretable signal mimicking clinical assessment.
If this is right
- Subjective visual assessment in diagnosis can be replaced by consistent automated classification.
- The extracted features capture sufficient clinical signal to allow effective classification even without supervised labels.
- Domain-specific transfer learning from liver segmentation aids in accurate pancreas and vein delineation.
- Patient-level decisions can be made reliably from the texture comparison in a full pipeline.
Where Pith is reading between the lines
- Such a system might enable broader screening for non-alcoholic fatty pancreas disease in patients with metabolic syndrome.
- Similar segmentation and texture methods could apply to detecting fat infiltration in other abdominal organs via ultrasound.
- The unsupervised performance suggests the core signal is robust and could be tested on multi-center datasets for generalization.
Load-bearing premise
The texture difference between peri-venous fat and pancreatic tissue reliably signals fatty infiltration, and the segmentation model accurately identifies the relevant structures across varying image qualities and patient anatomies.
What would settle it
A study on a larger independent dataset of ultrasound images where the model's classifications are compared against expert consensus and show accuracy significantly below 80 percent would falsify the claim of reliable detection.
Figures


read the original abstract
Non-alcoholic fatty pancreas disease (NAFPD) is an underdiagnosed condition associated with metabolic syndrome, insulin resistance, and increased risk of pancreatic cancer. Diagnosis typically relies on subjective visual assessment of ultrasound images by clinicians. We propose an end-to-end framework for automatically classifying normal versus fatty pancreas from abdominal ultrasound images. Our method employs a TransUNet-based segmentation architecture with a ResNet encoder and transformer bottleneck to delineate the pancreas and the splenic vein, followed by anatomically-guided patch extraction and patient-level classification through pairwise texture comparison. The feature engineering mimics clinical reasoning by comparing the echogenicity of peri-venous fat to the pancreatic parenchyma, providing an interpretable signal for classification. The segmentation models are initialized via domain-specific transfer learning from a liver segmentation task. We validate the full pipeline on a clinical dataset of 214 abdominal ultrasound images with 107 expert-labeled cases using 5-fold cross-validation. SVM with RBF kernel achieves a mean cross-validated accuracy of 89.7\%\,$\pm$\,1.8\% and F1 of 0.898\,$\pm$\,0.019, while the unsupervised K-Means baseline reaches 87.8\% accuracy, demonstrating that the proposed features capture the relevant clinical signal even without labeled training data. To our knowledge, this is the first end-to-end automated framework for fatty pancreas classification from ultrasound using segmentation-guided texture analysis.
Editorial analysis
A structured set of objections, weighed in public.
Referee Report
Summary. The manuscript proposes an end-to-end automated framework for detecting and classifying fatty pancreas (NAFPD) in abdominal ultrasound images. It utilizes a TransUNet architecture with ResNet encoder and transformer bottleneck to segment the pancreas and splenic vein, followed by anatomically-guided peri-venous patch extraction and texture comparison features that mimic clinical echogenicity assessment. Classification is performed using SVM with RBF kernel or unsupervised K-Means on a dataset of 214 images (107 labeled), achieving mean 5-fold CV accuracy of 89.7% ± 1.8% and F1 0.898 ± 0.019 for SVM, and 87.8% for K-Means.
Significance. If the segmentation step is shown to be reliable, the work could be significant as the first end-to-end pipeline for this underdiagnosed condition, with interpretable features grounded in clinical texture comparison and a strong unsupervised baseline. The 5-fold cross-validation with error bars and direct comparison to K-Means provide concrete support for the claim that the engineered features capture relevant signal on this dataset.
major comments (1)
- [Validation section] Validation section (and abstract): no Dice, IoU, or boundary-error metrics are reported for the TransUNet segmentation of pancreas and splenic vein on the 107 labeled cases. Because the classification pipeline depends entirely on accurate anatomical delineations to extract peri-venous patches and compute texture ratios, the absence of these metrics makes it impossible to verify that the reported 89.7% ± 1.8% accuracy reflects genuine clinical signal rather than segmentation success on the small dataset.
minor comments (1)
- [Abstract] Abstract: the description of domain-specific transfer learning from a liver segmentation task lacks any quantitative detail on the source dataset size or transfer performance, which would clarify the contribution of the initialization.
Simulated Author's Rebuttal
We thank the referee for the constructive feedback on our manuscript. The point raised about segmentation validation is well taken, and we address it directly below. We have revised the manuscript to incorporate the requested metrics.
read point-by-point responses
-
Referee: [Validation section] Validation section (and abstract): no Dice, IoU, or boundary-error metrics are reported for the TransUNet segmentation of pancreas and splenic vein on the 107 labeled cases. Because the classification pipeline depends entirely on accurate anatomical delineations to extract peri-venous patches and compute texture ratios, the absence of these metrics makes it impossible to verify that the reported 89.7% ± 1.8% accuracy reflects genuine clinical signal rather than segmentation success on the small dataset.
Authors: We agree that quantitative segmentation metrics are necessary to substantiate the reliability of the anatomical delineations that drive the downstream patch extraction and texture analysis. The original manuscript emphasized end-to-end classification performance and the unsupervised baseline, but did not report Dice, IoU, or boundary-error statistics for the TransUNet outputs on the 107 labeled cases. In the revised version we have added these metrics (computed via 5-fold cross-validation on the labeled subset) to the Validation section, including mean Dice and IoU for pancreas and splenic vein as well as average Hausdorff distance. We have also updated the abstract to reference the segmentation performance. These additions allow readers to assess whether the reported classification accuracy is supported by sufficiently accurate delineations. We note that the unsupervised K-Means result still provides supporting evidence that the texture features are informative, yet we accept that segmentation metrics are required for a complete validation of the pipeline. revision: yes
Circularity Check
Standard empirical ML pipeline with no circular derivation
full rationale
The paper describes a conventional applied ML pipeline: TransUNet segmentation of pancreas and vein, followed by explicit peri-venous patch extraction and texture-feature comparison (echogenicity ratio) for SVM/K-Means classification. No mathematical derivation, first-principles prediction, or equation chain is claimed. Features are hand-engineered to mimic clinical reasoning rather than fitted in a self-referential loop. Results come from 5-fold CV on 107 cases; no self-citation load-bearing uniqueness theorems, ansatz smuggling, or renaming of known results appear. This is a typical medical-image classification study whose central claim rests on empirical performance, not tautological reduction to inputs.
Axiom & Free-Parameter Ledger
free parameters (2)
- SVM hyperparameters (C, gamma for RBF)
- Patch extraction parameters
axioms (2)
- domain assumption The echogenicity difference between peri-venous fat and pancreatic parenchyma indicates fatty infiltration.
- domain assumption Transfer learning from liver segmentation improves pancreas segmentation in ultrasound.
Lean theorems connected to this paper
-
IndisputableMonolith/Cost/FunctionalEquation.leanwashburn_uniqueness_aczel unclear?
unclearRelation between the paper passage and the cited Recognition theorem.
TransUNet-based segmentation... pairwise texture comparison... SVM with RBF kernel achieves 89.7% accuracy
What do these tags mean?
- matches
- The paper's claim is directly supported by a theorem in the formal canon.
- supports
- The theorem supports part of the paper's argument, but the paper may add assumptions or extra steps.
- extends
- The paper goes beyond the formal theorem; the theorem is a base layer rather than the whole result.
- uses
- The paper appears to rely on the theorem as machinery.
- contradicts
- The paper's claim conflicts with a theorem or certificate in the canon.
- unclear
- Pith found a possible connection, but the passage is too broad, indirect, or ambiguous to say the theorem truly supports the claim.
Reference graph
Works this paper leans on
-
[1]
Breiman, L. (2001). Random forests.Machine Learn- ing, 45(1), pp. 5–32
work page 2001
-
[2]
Cao, H., Wang, Y ., Chen, J., Jiang, D., Zhang, X., Tian, Q., Wang, M. (2022). Swin-Unet: Unet-like pure transformer for medical image segmentation. In Proceedings of the European Conference on Com- puter Vision (ECCV) Workshops
work page 2022
-
[3]
Chen, J., Lu, Y ., Yu, Q., Luo, X., Adeli, E., Wang, Y ., Lu, L., Yuille, A.L., Zhou, Y . (2021). TransUNet: Transformers make strong encoders for medical image segmentation.arXiv preprint arXiv:2102.04306
work page internal anchor Pith review arXiv 2021
-
[4]
Cortes, C., Vapnik, V . (1995). Support-vector net- works.Machine Learning, 20(3), pp. 273–297
work page 1995
-
[5]
Cover, T., Hart, P. (1967). Nearest neighbor pattern classification.IEEE Transactions on Information The- ory, 13(1), pp. 21–27
work page 1967
-
[6]
Cox, D.R. (1958). The regression analysis of binary sequences.Journal of the Royal Statistical Society: Series B, 20(2), pp. 215–242
work page 1958
-
[7]
Friedman, J.H. (2001). Greedy function approxima- tion: A gradient boosting machine.Annals of Statis- tics, 29(5), pp. 1189–1232
work page 2001
-
[8]
Hosseinzadeh Taher, M.R., Haghighi, F., Feng, R., Gotway, M.B., Liang, J. (2021). A systematic bench- marking analysis of transfer learning for medical im- age analysis. InDomain Adaptation and Representa- tion Transfer (DART), Springer, pp. 3–13
work page 2021
-
[9]
Hu, H.H., Kim, H.W., Nayak, K.S., Goran, M.I. (2010). Comparison of fat-water MRI and single- voxel MRS in the assessment of hepatic and pancre- atic fat fractions in humans.Obesity, 18(4), pp. 841– 847
work page 2010
-
[10]
Lee, J.S., Kim, S.H., Jun, D.W., Han, J.H., Jang, E.C., Park, J.Y ., Son, B.K., Kim, S.H., Jo, Y .J., Park, Y .S., Kim, Y .S. (2009). Clinical implications of fatty pancreas: Correlations between fatty pancreas and metabolic syndrome.World Journal of Gastroenterol- ogy, 15(15), pp. 1869–1875
work page 2009
-
[11]
MacQueen, J. (1967). Some methods for classification and analysis of multivariate observations. InProceed- ings of the Fifth Berkeley Symposium on Mathematical Statistics and Probability, V ol. 1, pp. 281–297
work page 1967
-
[12]
Ma, J., He, Y ., Li, F., Han, L., You, C., Wang, B. (2024). Segment anything in medical images.Nature Communications, 15, 654
work page 2024
-
[13]
Ronneberger, O., Fischer, P., Brox, T. (2015). U-Net: Convolutional networks for biomedical image seg- mentation. InProceedings of MICCAI, Springer, pp. 234–241
work page 2015
-
[14]
Roth, H.R., Lu, L., Farag, A., Sohn, A., Sum- mers, R.M. (2018). Spatial aggregation of holistically- nested convolutional neural networks for automated pancreas localization and segmentation.Medical Im- age Analysis, 45, pp. 94–107
work page 2018
-
[15]
Sepe, P.S., Ohri, A., Sanaka, S., Berzin, T.M., Se- ber, S., Gupte, G., Chuang, M., Misra, S., Banks, P.A., Conwell, D.L. (2011). A prospective evaluation of fatty pancreas by using EUS.Gastrointestinal En- doscopy, 73(5), pp. 987–993
work page 2011
-
[16]
Smits, M.M., van Geenen, E.J.M. (2011). The clinical significance of pancreatic steatosis.Nature Reviews Gastroenterology & Hepatology, 8(3), pp. 169–177
work page 2011
-
[17]
Tajbakhsh, N., Shin, J.Y ., Gurudu, S.R., Hurst, R.T., Kendall, C.B., Gotway, M.B., Liang, J. (2016). Con- volutional neural networks for medical image analy- sis: Full training or fine tuning?IEEE Transactions on Medical Imaging, 35(5), pp. 1299–1312
work page 2016
-
[18]
Tariq, H., Nayudu, S., Akella, S., Glandt, M., Chilimuri, S. (2016). Non-alcoholic fatty pancreatic disease: A review of literature.Gastroenterology Re- search, 9(6), pp. 87–91
work page 2016
- [19]
-
[20]
Zhou, Y ., Li, Z., Bai, S., Wang, C., Chen, X., Han, M., Fishman, E., Yuille, A.L. (2019). Prior-aware neural network for partially-supervised multi-organ segmen- tation. InProceedings of the IEEE/CVF International Conference on Computer Vision (ICCV), pp. 10672– 10681
work page 2019
-
[21]
Ahmad, M., et al. (2026). High prevalence of fatty pancreas disease in type 2 dia- betes mellitus: a meta analysis.Diabetes Research and Clinical Practice, 113149. https://doi.org/10.1016/j.diabres.2026.113149
-
[22]
Sakai, N.S., et al. (2018). Obesity, metabolic disease and the pancreas - Quantitative imaging of pancre- atic fat.British Journal of Radiology, 91, 20180267. https://doi.org/10.1259/BJR.20180267
-
[23]
K ¨uhn, J.P., et al. (2015). Pancreatic Steatosis Demon- strated at MR Imaging in the General Popula- tion: Clinical Relevance.Radiology, 276, 129–136. https://doi.org/10.1148/radiol.15140446
-
[24]
Ryu, T., Jang, J.Y ., Chang, Y ., Chung, K.H., Jeong, S.W., Cho, Y .D. (2023). Clinical im- pact of fatty pancreas and its correlation with metabolic disease: Focusing on the cellular mechanism and the ultrasonographic findings. Daehanimsangchoeumpahakoejinull, 8(2), 43–52. https://doi.org/10.18525/cu.2023.8.2.43
-
[25]
Oh, H., Park, H.J., Oh, J., Lee, E.S., Park, S.B., Cha, M.J., Ahn, S. (2021). Hyperechoic pancreas on ultrasonography: An analysis of its severity and clinical implications.Ultrasonography. https://doi.org/10.14366/USG.21099
-
[26]
Oh, J., Park, H.J., Lee, E.S., Park, S.B., Choi, B.I., Ahn, S. (2021). Severity of hyperechoic pancreas on ultrasonography as a risk factor for glycemic progression.Ultrasonography, 40(4), 499–
work page 2021
-
[27]
https://doi.org/10.14366/USG.20122
-
[28]
Starodubova, A.V ., Kosyura, S.D., Livantsova, E.N., Varaeva, Y .R., Krasilova, A.A. (2019). Di- agnosing pancreatic steatosis in obese patients. https://doi.org/10.33149/VKP.2019.04.03
-
[29]
Keihanian, T., Jawaid, S.A., Abidi, W., Qureshi, W., Othman, M.O. (2023). Patterns of Fatty In- filtration in Pancreas on Endoscopic Ultrasound: A Novel Classification System.The American Journal of Gastroenterology, 118(10S), S51–S52. https://doi.org/10.14309/01.ajg.0000949872.17370.d8
-
[30]
Sun, Y ., et al. (2024). Non-invasive diagnosis of pancreatic steatosis with ultrasound images using deep learning network.Heliyon, 10(17), e37580. https://doi.org/10.1016/j.heliyon.2024.e37580
-
[31]
P ˘atras,cu, A.V ., Ceaus,escu, C.-M., Alexe, B. (2025). From Semantic Segmentation of Natural Images to Medical Image Segmentation Using ViT-Based Ar- chitectures.In: Torsello, A., Rossi, L., Cosmo, L., Minello, G. (eds) Structural, Syntactic, and Statistical Pattern Recognition. Springer, Cham, pp. 112–121. https://doi.org/10.1007/978-3-031-80507-3 12
-
[32]
He, K., Zhang, X., Ren, S., Sun, J. (2016). Deep Residual Learning for Image Recognition.In: Pro- ceedings of the IEEE Conference on Computer Vi- sion and Pattern Recognition (CVPR), pp. 770–778. https://doi.org/10.1109/CVPR.2016.90
-
[33]
Xu, Y ., Zheng, B., Liu, X., Wu, T., Ju, J., Wang, S., Lian, Y ., Zhang, H., Liang, T., Sang, Y ., Jiang, R., Wang, G., Ren, J., Chen, T. (2022). Anno- tated Ultrasound Liver Images.Zenodo. Version v1. https://doi.org/10.5281/zenodo.7272660
discussion (0)
Sign in with ORCID, Apple, or X to comment. Anyone can read and Pith papers without signing in.