Recognition: no theorem link
Robust and Reliable AI for Predictive Quality in Semiconductor Materials Manufacturing with MLOps and Uncertainty Quantification
Pith reviewed 2026-05-11 01:50 UTC · model grok-4.3
The pith
A fixed retraining cadence every five production batches without hyperparameter retuning outperforms strategies that include optimization for semiconductor quality prediction under drift.
A machine-rendered reading of the paper's core claim, the machinery that carries it, and where it could break.
Core claim
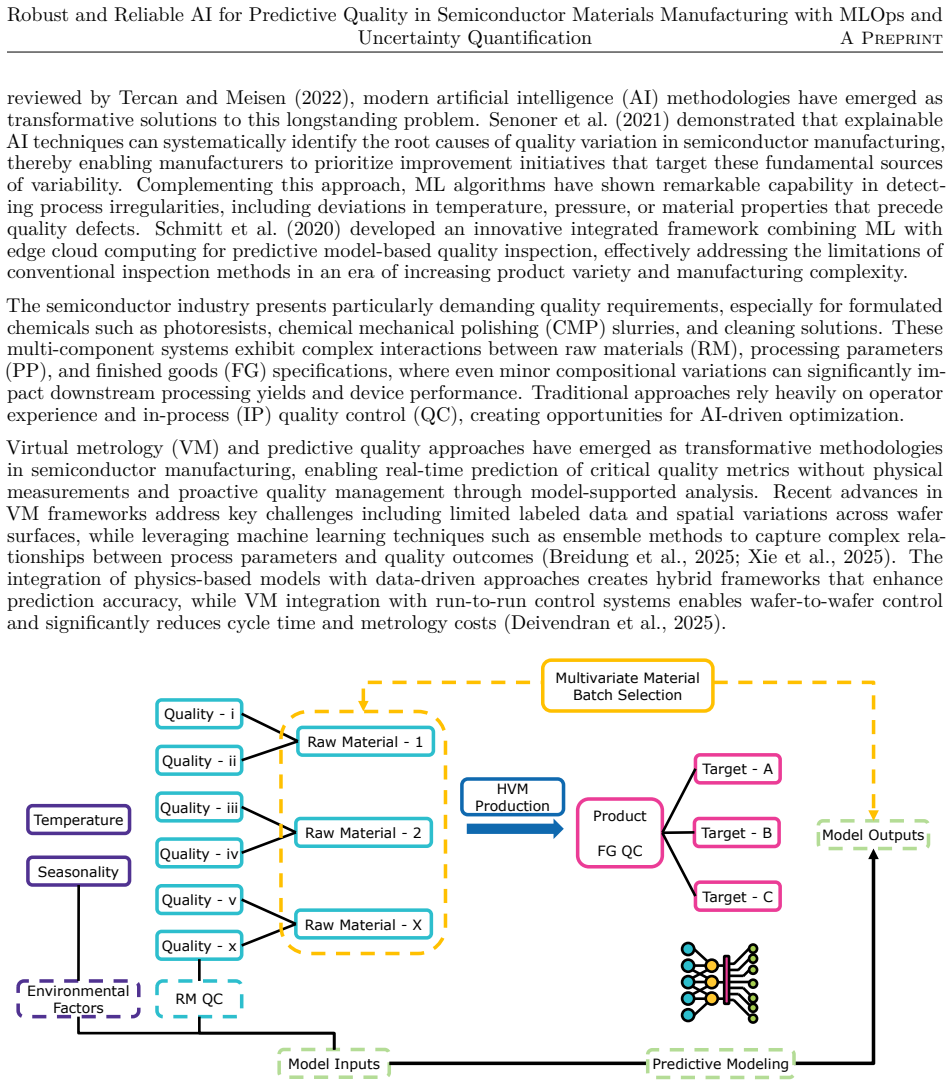
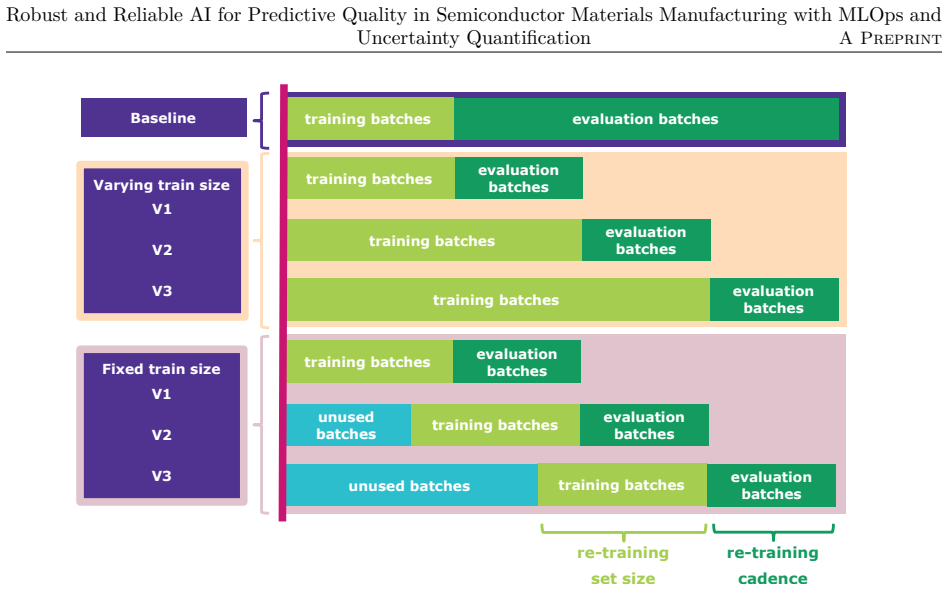
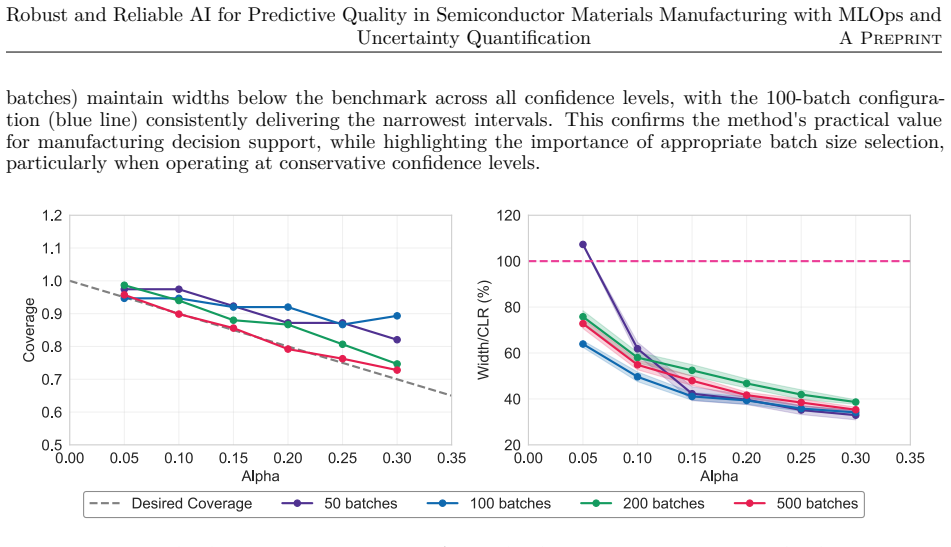
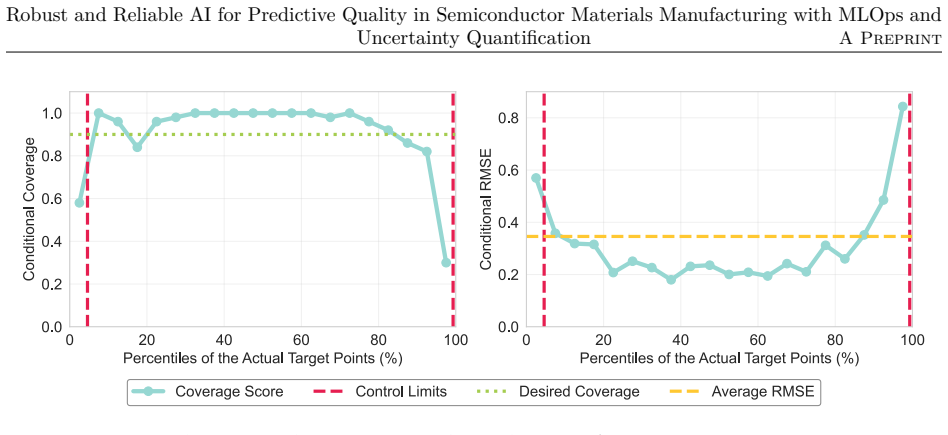
Benchmarking retraining strategies on five years of manufacturing data demonstrates that a fixed retraining cadence every five production batches without hyperparameter retuning achieves superior performance across all drift conditions while significantly reducing computational overhead compared to strategies incorporating hyperparameter optimization. This fixed approach maintains accuracy during abrupt process changes and gradual equipment degradation. Conformal prediction is added to produce prediction intervals with statistical guarantees, allowing manufacturers to move from reactive to predictive quality management by checking whether intervals fall inside acceptable control limits.
What carries the argument
The fixed five-batch retraining schedule evaluated by the control-limit-normalized-residual metric, paired with conformal prediction intervals that carry statistical coverage guarantees.
If this is right
- Model accuracy stays high during both abrupt process shifts and slow equipment degradation without extra tuning steps.
- Computational cost drops substantially because hyperparameter optimization is omitted at each retraining point.
- Prediction intervals with guaranteed coverage let operators flag unreliable forecasts before they affect production decisions.
- The results supply concrete MLOps guidelines for any manufacturing setting that needs both efficiency and reliable uncertainty estimates.
Where Pith is reading between the lines
- The same fixed-cadence principle could be tested in other continuous-process industries that experience comparable gradual and abrupt drifts.
- Relying on uncertainty intervals may encourage tighter control limits or earlier intervention thresholds than current practice allows.
- Repeating the benchmark across multiple independent manufacturing lines would show whether the five-batch interval is broadly stable or line-specific.
Load-bearing premise
The five-year dataset from this single manufacturing line and the control-limit-normalized-residual metric together represent the full variety of real-world drift patterns and that the tested frequencies will remain optimal on other lines.
What would settle it
A dataset collected from a different semiconductor line or under a new set of drift patterns in which either a different retraining frequency or the addition of hyperparameter optimization produces measurably lower normalized residuals or higher computational cost.
Figures


read the original abstract
Semiconductor materials manufacturing presents unique challenges for machine learning deployment due to evolving process conditions, equipment degradation, and raw material variability that can cause model performance deterioration over time. This study benchmarks machine learning operations (MLOps) retraining strategies using five years of real manufacturing data to identify optimal retraining approaches for quality prediction. We evaluate various retraining frequencies and hyperparameter optimization strategies using control limit normalized residuals as key performance metric. Results demonstrate that a fixed retraining cadence every five production batches without hyperparameter retuning achieves superior performance across all drift conditions while significantly reducing computational overhead compared to strategies incorporating hyperparameter optimization. This approach effectively maintains model accuracy during both abrupt process changes and gradual equipment degradation patterns. To address the critical need for uncertainty quantification in manufacturing decision-making, we implement conformal prediction to generate prediction confidence intervals with strong statistical guarantees. This enables proactive quality control by identifying when prediction intervals fall within acceptable control limits, transforming traditional reactive quality management into a predictive framework. The findings provide practical guidelines for implementing robust MLOps strategies in manufacturing environments where computational efficiency and reliable uncertainty quantification are paramount for operational success.
Editorial analysis
A structured set of objections, weighed in public.
Referee Report
Summary. The manuscript benchmarks MLOps retraining strategies for quality prediction in semiconductor materials manufacturing using five years of real production data. It evaluates retraining frequencies and hyperparameter optimization approaches with control-limit-normalized residuals as the primary metric, claiming that a fixed retraining cadence every five batches without hyperparameter retuning outperforms alternatives across all drift conditions while reducing computational overhead. The work also applies conformal prediction to produce statistically guaranteed prediction intervals for proactive quality control.
Significance. If the empirical ranking holds under broader conditions, the study supplies actionable guidelines for computationally efficient MLOps pipelines in drift-prone manufacturing settings and demonstrates a concrete use of conformal prediction to shift from reactive to predictive quality management. The use of a multi-year real-world trace is a positive feature; however, the single-trace evaluation restricts the result's broader applicability.
major comments (2)
- [Abstract and Results] Abstract and Results section: the headline claim that fixed five-batch retraining 'achieves superior performance across all drift conditions' rests on evaluation of a single five-year manufacturing trace using control-limit-normalized residuals derived from that same trace. No cross-validation, synthetic drift regimes, or additional production lines are reported, so the ranking cannot be shown to generalize beyond the observed aging rates and change frequencies in this dataset.
- [Experimental design] Experimental design (presumably §4 or §5): the manuscript provides no information on data splits, temporal cross-validation strategy, statistical significance tests, or sensitivity of the ranking to the choice of normalized-residual metric. Without these, post-hoc selection of the five-batch policy cannot be ruled out.
minor comments (2)
- The conformal-prediction implementation and the exact procedure for deciding when an interval falls 'within acceptable control limits' should be described with sufficient algorithmic detail (e.g., nonconformity score definition, calibration-set construction) to allow reproduction.
- Figure captions and table legends would benefit from explicit statements of the number of batches per drift regime and the precise definition of 'computational overhead' (wall-clock time, GPU-hours, etc.).
Simulated Author's Rebuttal
We thank the referee for the constructive comments on our manuscript. We address each major comment below, providing clarifications on the evaluation scope and experimental details while revising the text to better reflect the limitations of a single real-world trace.
read point-by-point responses
-
Referee: [Abstract and Results] Abstract and Results section: the headline claim that fixed five-batch retraining 'achieves superior performance across all drift conditions' rests on evaluation of a single five-year manufacturing trace using control-limit-normalized residuals derived from that same trace. No cross-validation, synthetic drift regimes, or additional production lines are reported, so the ranking cannot be shown to generalize beyond the observed aging rates and change frequencies in this dataset.
Authors: We agree that the evaluation is confined to a single five-year real production trace and that this inherently limits broad generalization claims. The dataset's value lies in its authentic capture of gradual equipment degradation and abrupt process changes over an extended period. We have revised the abstract and results sections to qualify the headline claim, stating that the fixed five-batch retraining without hyperparameter retuning 'achieves superior performance under the drift conditions observed in this dataset' rather than 'across all drift conditions.' We have also added a limitations paragraph noting the absence of synthetic regimes or multi-line validation and the need for future work on additional traces. No new experiments were feasible within the revision scope. revision: partial
-
Referee: [Experimental design] Experimental design (presumably §4 or §5): the manuscript provides no information on data splits, temporal cross-validation strategy, statistical significance tests, or sensitivity of the ranking to the choice of normalized-residual metric. Without these, post-hoc selection of the five-batch policy cannot be ruled out.
Authors: We acknowledge that the original manuscript omitted explicit details on these aspects. Because the data is a continuous time-series from production, we used a temporal forward-chaining split: models were trained on initial batches and retrained sequentially on subsequent batches to simulate real deployment. We have added a new subsection in the experimental design section describing this temporal split strategy, the rationale for avoiding standard k-fold cross-validation (to prevent leakage from future data), and the batch-wise evaluation protocol. Statistical significance testing was not performed due to the single-trace nature, but we have included a sensitivity analysis to alternative normalized-residual formulations in the supplementary material to demonstrate robustness of the ranking. revision: yes
- The single-trace evaluation prevents demonstration of generalization to other production lines or synthetic drift regimes without new data collection.
Circularity Check
No circularity: purely empirical policy comparison on fixed dataset
full rationale
The paper's central result is an empirical ranking of retraining frequencies and hyperparameter strategies evaluated on a single five-year manufacturing trace using control-limit-normalized residuals. No derivation, equation, or prediction is shown to reduce by construction to a fitted parameter, self-citation, or ansatz imported from prior work by the same authors. The superiority claim for the five-batch fixed schedule is presented as the direct numerical outcome of that benchmark rather than a mathematical identity or self-referential definition. Conformal prediction is invoked only for uncertainty intervals and does not underpin the retraining comparison. Because the work contains no load-bearing self-referential steps of the enumerated kinds, the derivation chain is self-contained.
Axiom & Free-Parameter Ledger
Reference graph
Works this paper leans on
-
[1]
Amrit, C. and Narayanappa, A. K. (2025). An analysis of the challenges in the adoption of MLOps. 10(1):100637
work page 2025
-
[2]
Angelopoulos, A. N. and Bates, S. (2021). A gentle introduction to conformal prediction and distribution-free uncertainty quantification. arXiv preprint
work page 2021
-
[3]
Baena-Garcia, M., Del Campo-A vila, J., Fidalgo, R., and Bifet, A. (2006). Early drift detection method. In Proc. of the 4th ECML PKDD International Workshop on Knowledge Discovery from Data Streams , pages 77–86, Berlin. 16 Robust and Reliable AI for Predictive Quality in Semiconductor Materials Manufacturing with MLOps and Uncertainty Quantification A Preprint
work page 2006
-
[4]
Bagui, S. S., Khan, M. P., Valmyr, C., Bagui, S. C., and Mink, D. (2025). Model retraining upon concept drift detection in network traffic big data. Future Internet, 17(8):328
work page 2025
-
[5]
Baier, L., Jöhren, F., and Seebacher, S. (2019). Challenges in the deployment and operation of machine learning in practice. In 27th European Conference on Information Systems: Information Systems for a Sharing Society (ECIS)
work page 2019
-
[6]
Barber, R. F., Candès, E. J., Ramdas, A., and Tibshirani, R. J. (2021). Predictive inference with the jackknife+. The Annals of Statistics , 49(1):486–507
work page 2021
-
[7]
Bergstra, J. and Bengio, Y. (2012). Random search for hyper-parameter optimization. Journal of Machine Learning Research, 13(10):281–305
work page 2012
-
[8]
Bertolini, M., Mezzogori, D., Neroni, M., and Zammori, F. (2021). Machine learning for industrial applica- tions: A comprehensive literature review. Expert Systems with Applications , 175:114820
work page 2021
-
[9]
Breidung, M., Rothe, T., Lauff, A., Thieme, P., Langer, J., Günther, M., and Kuhn, H. (2025). Process data-driven machine learning for non-uniformity prediction and virtual metrology in chemical mechanical planarization. Journal of Intelligent Manufacturing
work page 2025
-
[10]
Breiman, L. (2001). Random forests. Machine Learning, 45(1):5–32
work page 2001
-
[11]
Chen, T., Sampath, V., May, M. C., Shan, S., Jorg, O. J., Aguilar Martin, J. J., and Calaon, M. (2023). Machine learning in manufacturing towards industry 4.0: From ‘For Now’ to ‘Four-Know’ . 13(3):1903
work page 2023
-
[12]
Cordier, T., Vincent, B., Louis, L., Thomas, M., Arnaud, C., and Nicolas, B. (2023). Flexible and systematic uncertainty estimation with conformal prediction via the MAPIE library. In Proceedings of Machine Learning Research, volume 204, pages 549–581
work page 2023
-
[13]
S., Nadimpalli, N., and Runkana, V
Deivendran, B., Masampall, V. S., Nadimpalli, N., and Runkana, V. (2025). Virtual metrology for chemical mechanical planarization of semiconductor wafers. Journal of Intelligent Manufacturing , 36:1923–1942
work page 2025
-
[14]
Dogan, A. and Birant, D. (2011). Machine learning and data mining in manufacturing. Expert Systems with Applications, 166:114060
work page 2011
-
[15]
Gama, J., Zliobaite, I., Bifet, A., Pechenizkiy, M., and Bouchachia, A. (2014). A survey on concept drift adaptation. ACM Computing Surveys , 46(4):1–37
work page 2014
-
[16]
Gelman, A., Carlin, J., Stern, H., Dunson, D., Vehtari, A., and Rubin, D. (2013). Bayesian Data Analysis . Chapman and Hall/CRC, 3 edition
work page 2013
-
[17]
Gibbs, I., Cherian, J. J., and Candès, E. J. (2025). Conformal prediction with conditional guarantees. Journal of the Royal Statistical Society Series B: Statistical Methodology , pages 1100–1126. Grömping, U. (2009). Variable importance assessment in regression: Linear regression versus random forest. The American Statistician , 63(4):308–319. Grünwald, ...
work page 2025
-
[18]
John, M., Olsson, H., and Bosch, J. (2021). Towards MLOps: A framework and maturity model. In 2021 47th Euromicro Conference on Software Engineering and Advanced Applications (SEAA) , pages 1–8
work page 2021
-
[19]
Kompa, B., Snoek, J., and Beam, A. L. (2021). Empirical frequentist coverage of deep learning uncertainty quantification procedures. Entropy, 23(12):1608
work page 2021
-
[20]
Lujan-Moreno, G., Howard, P., Rojas, O., and Montgomery, D. (2018). Design of experiments and response surface methodology to tune machine learning hyperparameters, with a random forest case-study. Expert Systems with Applications , 109:195–205
work page 2018
-
[21]
Mallick, A., Hsieh, K., Arzani, B., and Joshi, G. (2022). Matchmaker: Data drift mitigation in machine learning for large-scale systems. In Proceedings of Machine Learning and Systems , volume 4, pages 77–94
work page 2022
-
[22]
Meinshausen, N. (2006). Quantile regression forests. Journal of Machine Learning Research , 7:983–999
work page 2006
-
[23]
G., Raeder, T., Alaiz-Rodríguez, R., Chawla, N
Moreno-Torres, J. G., Raeder, T., Alaiz-Rodríguez, R., Chawla, N. V., and Herrera, F. (2012). A unifying view on dataset shift in classification. Pattern Recognition, 45(1):521–530. Msakni MK, M., Risan, A., and Schütz, P. (2023). Using machine learning prediction models for quality control: a case study from the automotive industry. Computational Managem...
work page 2012
-
[24]
Nguyen, C., Bhuyan, M., and Elmroth, E. (2024). Enhancing machine learning performance in dynamic cloud environments with auto-adaptive models. In 2024 IEEE International Conference on Cloud Computing Technology and Science (CloudCom) , pages 184–191, Abu Dhabi, United Arab Emirates
work page 2024
-
[25]
Oakland, J. and Oakland, J. S. (2007). Statistical Process Control. Routledge. Ördek, B., Borgianni, Y., and Coatanea, E. (2024). Machine learning-supported manufacturing: a review and directions for future research. Production & Manufacturing Research , 12(1)
work page 2007
-
[26]
Pedregosa, F., Varoquaux, G., Gramfort, A., Michel, V., Thirion, B., Grisel, O., et al. (2011). Scikit-learn: Machine learning in python. Journal of Machine Learning Research , 12:2825–2830
work page 2011
-
[27]
A., Alharbi, B., Wang, S., and Zhang, X
Qahtan, A. A., Alharbi, B., Wang, S., and Zhang, X. (2015). A PCA-based change detection framework for multidimensional data streams: Change detection in multidimensional data streams. In Proceedings of the 21st ACM SIGKDD International Conference on Knowledge Discovery and Data Mining , pages 935–944. Association for Computing Machinery
work page 2015
-
[28]
Qin, S. J. (2012). Survey on data-driven industrial process monitoring and diagnosis. Annual Reviews in Control, pages 220–234
work page 2012
-
[29]
Rai, R., Tiwari, M. K., Ivanov, D., and Dolgui, A. (2021). Machine learning in manufacturing and industry 4.0 applications. International Journal of Production Research , 59(16):4773–4778
work page 2021
-
[30]
Rainio, O., Teuho, J., and Klénr, R. (2024). Evaluation metrics and statistical tests for machine learning. Scientific Reports, 14:6086
work page 2024
-
[31]
Ravichandran, J. (2019). A review of specification limits and control limits from the perspective of Six Sigma quality processes. 11(1):58–72
work page 2019
- [32]
-
[33]
Schmitt, J., Bönig, J., Borggräfe, T., Breitinger, G., and Deuse, J. (2020). Predictive model-based quality in- spection using machine learning and edge cloud computing. Advanced Engineering Informatics, 45:101101
work page 2020
-
[34]
Senoner, J., Netland, T., and Feuerriegel, S. (2021). Using explainable artificial intelligence to improve process quality: Evidence from semiconductor manufacturing. Management Science , 68(8):5704–5723
work page 2021
-
[35]
Shayesteh, B., Ebrahimzadeh, C. F., and Glitho, R. (2021). Auto-adaptive fault prediction system for edge cloud environments in the presence of concept drift. In 2021 IEEE International Conference on Cloud Engineering (IC2E) , pages 217–223, San Francisco, CA, USA
work page 2021
-
[36]
Tercan, H. and Meisen, T. (2022). Machine learning and deep learning based predictive quality in manufac- turing: a systematic review. Journal of Intelligent Manufacturing , 33:1879–1905
work page 2022
-
[37]
Treveil, M., Omont, N., Stenac, C., Lefevre, K., Phan, D., Zentici, J., and Heidmann, L. (2020). Introducing MLOps. O’Reilly Media, Inc
work page 2020
-
[38]
Varma, S. and Simon, R. (2006). Bias in error estimation when using cross-validation for model selection. BMC Bioinformatics , 7:91
work page 2006
-
[39]
Velthoen, J., Dombry, C., Cai, J.-J., and Engelke, S. (2023). Gradient boosting for extreme quantile regres- sion. Extremes, pages 639–667
work page 2023
-
[40]
Vovk, V. (2021). Conditional validity of inductive conformal predictors. In Proceedings of the Asian Con- ference on Machine Learning , volume 25 of Proceedings of Machine Learning Research , pages 475–490
work page 2021
-
[41]
Wan, Y., Liu, D., and Ren, J.-C. (2024). A modeling method of wide random forest multi-output soft sensor with attention mechanism for quality prediction of complex industrial processes. Advanced Engineering Informatics, 59:102255. 18 Robust and Reliable AI for Predictive Quality in Semiconductor Materials Manufacturing with MLOps and Uncertainty Quantifi...
work page 2024
-
[42]
Xie, W., Wu, J., Wang, Y., and Chen, Y. (2025). S2GA-VM: self-supervised and global-aware virtual metrology for accurate film thickness prediction in semiconductor manufacturing. Journal of Intelligent Manufacturing. Žliobaitė, I. (2010). Learning under concept drift: an overview. arXiv preprint. 19
work page 2025
discussion (0)
Sign in with ORCID, Apple, or X to comment. Anyone can read and Pith papers without signing in.