Recognition: no theorem link
CHASM: Online Changepoint Detection in Temporal and Cross-Variable Dependence
Pith reviewed 2026-05-11 02:25 UTC · model grok-4.3
The pith
CHASM detects online changepoints in multivariate dependence by tracking the truncated eigenvalues of a recursively estimated dynamic mode decomposition operator.
A machine-rendered reading of the paper's core claim, the machinery that carries it, and where it could break.
Core claim
CHASM monitors the truncated eigenvalue sequence of the recursively estimated dynamic mode decomposition operator to detect changepoints in temporal and cross-variable dependence. The approach uses optimal linear assignment to handle permutation invariance of eigendecompositions and a novel augmented monitoring scheme for complex-valued series. Theoretical analysis under the vector autoregressive model supports the design, and empirical tests show competitive or better performance than existing methods on synthetic and real-world datasets.
What carries the argument
The truncated eigenvalue sequence of the recursively estimated dynamic mode decomposition (DMD) operator, with optimal linear assignment to resolve permutation invariance and an augmented scheme to accommodate complex values.
If this is right
- The method runs online and unsupervised with only a small number of interpretable parameters.
- It requires no distributional assumptions beyond finite moments.
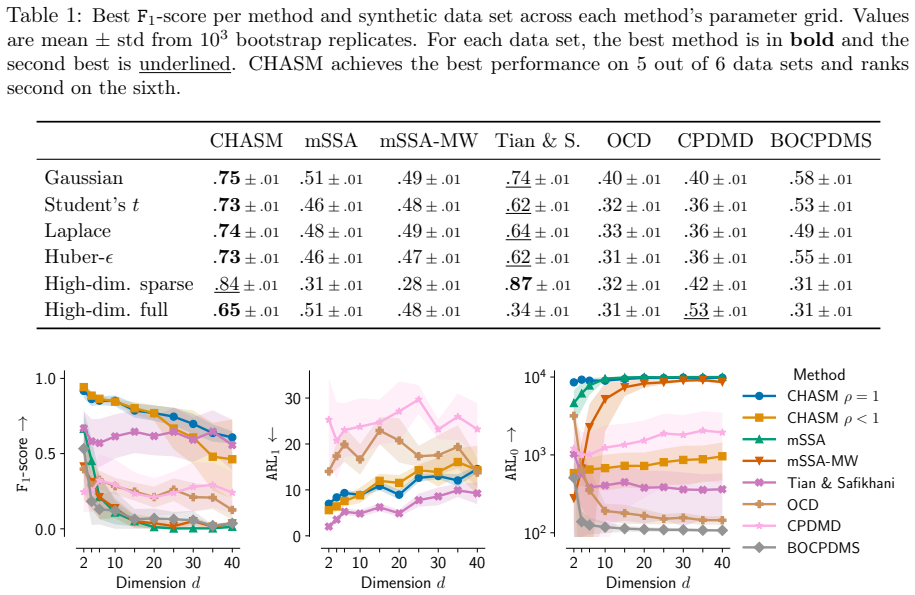
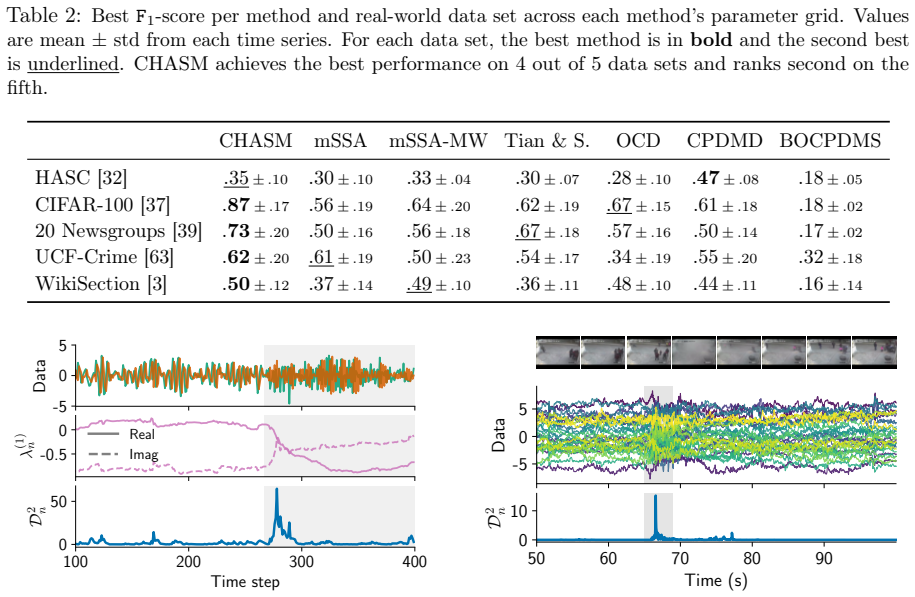
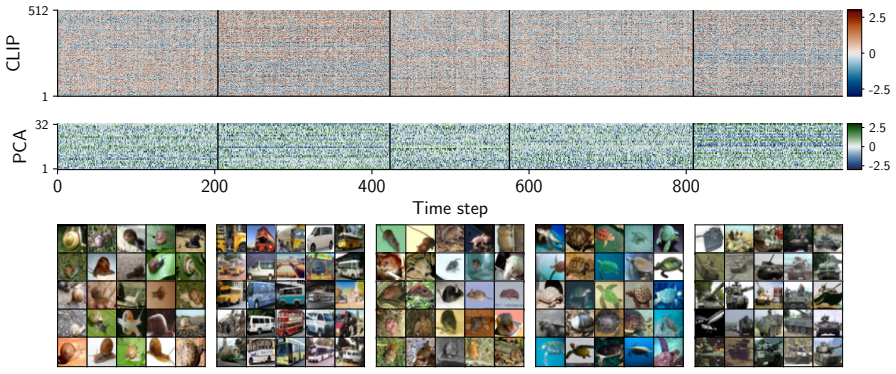
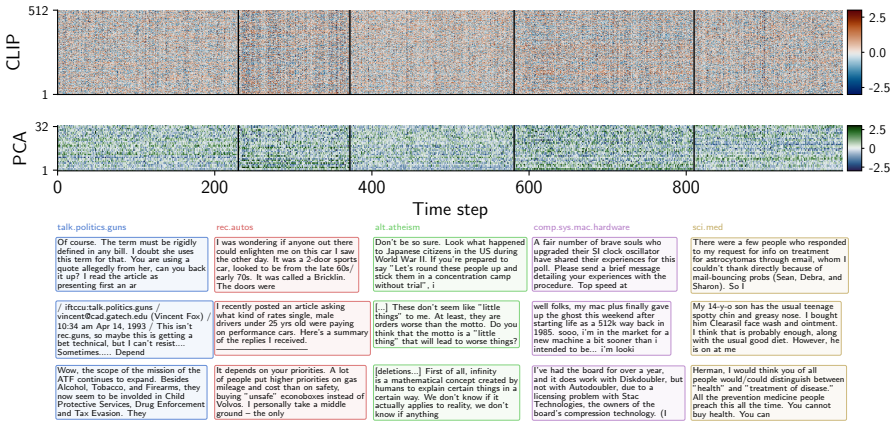
- Performance is competitive or superior to modern alternatives on synthetic data and on challenging real data including video and text.
- The algorithmic choices are directly motivated by the estimator's properties under the canonical vector autoregressive model.
Where Pith is reading between the lines
- Eigenvalue sequences from linear dynamical approximations may serve as compact statistics for detecting global dependence changes that scalar functionals miss.
- The same recursive DMD monitoring idea could be tested on streaming data from domains such as sensor networks or biological signals where dependence shifts are diagnostically important.
- Hybrid detectors that combine the eigenvalue monitor with reconstruction-error methods might reduce false alarms while retaining sensitivity to subtle dependence changes.
Load-bearing premise
Shifts in cross-variable and temporal dependence reliably appear as changes in the truncated eigenvalue sequence of the recursive DMD operator once permutation invariance and complex-valued issues are resolved by the assignment and augmentation steps.
What would settle it
A controlled multivariate series containing a clear change in dependence structure but no corresponding shift in the monitored eigenvalue sequence, or a series with no dependence change that nevertheless triggers a detection.
Figures


read the original abstract
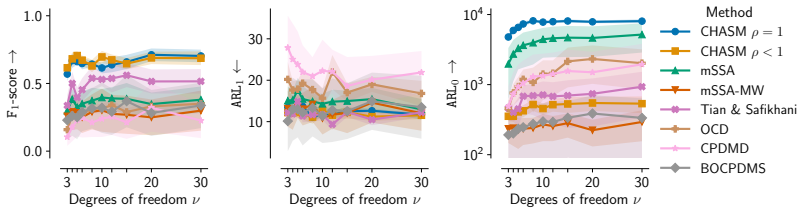
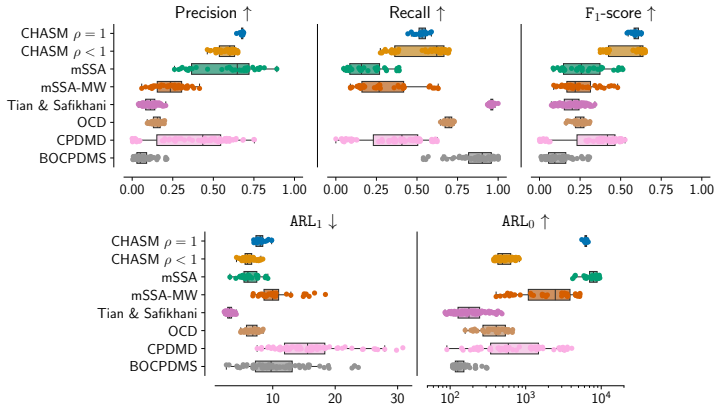
Changepoint detection identifies times when the generative process of a time series changes, with applications in healthcare, cybersecurity, and finance. In multivariate settings, changes in cross-variable and temporal dependence are particularly challenging to detect, as they are often less pronounced than shifts in marginal statistics such as the mean or variance. Existing methods detect changes using reconstruction error, which provides only an indirect measure of dynamical change, or rely on scalar functionals that may be too coarse to capture global structure. We introduce CHASM, an online nonparametric method that monitors the truncated eigenvalue sequence of the recursively estimated dynamic mode decomposition operator. Designing such an approach raises two challenges: the permutation invariance of eigendecompositions, resolved via optimal linear assignment, and the lack of online changepoint methods for multivariate complex-valued time series, addressed through a novel augmented monitoring scheme. We study the theoretical properties of the dynamics estimator under the canonical vector autoregressive model, which directly motivates our algorithmic design. The proposed method achieves competitive or superior performance to modern competitors across synthetic and real-world data sets, including challenging settings in video and text data. It is unsupervised, depends on a small number of interpretable parameters, and requires no distributional assumptions beyond finite moments, making it readily deployable across scientific domains.
Editorial analysis
A structured set of objections, weighed in public.
Referee Report
Summary. The paper introduces CHASM, an online nonparametric changepoint detection method for multivariate time series that monitors the truncated eigenvalue sequence of a recursively estimated dynamic mode decomposition (DMD) operator. It resolves permutation invariance of eigendecompositions via optimal linear assignment and addresses online monitoring of complex-valued series via a novel augmented scheme. Theoretical properties of the estimator are derived under the canonical vector autoregressive (VAR) model, which motivates the design. The method is claimed to achieve competitive or superior performance to modern competitors on synthetic and real-world datasets (including video and text), while remaining unsupervised, depending on a small number of interpretable parameters, and requiring no distributional assumptions beyond finite moments.
Significance. If the empirical claims hold, the work provides a practical, assumption-light approach to detecting changes in cross-variable and temporal dependence structures rather than marginal moments, which addresses a recognized gap in online multivariate changepoint detection. Credit is due for grounding the algorithmic choices in VAR consistency results and for testing on challenging non-linear data types such as video and text. The unsupervised character and limited parameter count are genuine strengths for deployability.
major comments (2)
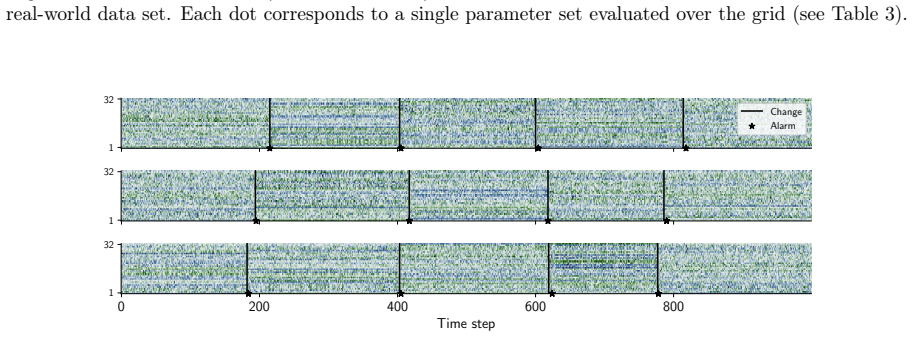
- [§3] §3 (Theoretical properties): Consistency of the recursively estimated DMD operator and its truncated eigenvalues is established only under the canonical VAR model. The central claim of reliable detection on video and text data (with no assumptions beyond finite moments) therefore rests on the unproven assertion that dependence shifts will produce detectable changes in the truncated eigenvalue sequence even when the linear approximation is poor; no robustness analysis or counter-example study under nonlinear dynamics is provided to support this extrapolation.
- [§5] §5 (Experiments, real-data results): The reported competitive performance on video and text datasets is presented without ablation isolating the contribution of the optimal linear assignment and augmented monitoring scheme. It is therefore unclear whether the gains are attributable to the DMD-eigenvalue statistic itself or to the permutation/complex-value corrections; this directly affects the load-bearing claim that the method reliably captures cross-variable and temporal dependence changes.
minor comments (2)
- [§2] Notation for the truncation level and detection threshold should be introduced with explicit symbols in the method section rather than only in the algorithm box, to improve readability.
- [Abstract] The abstract states 'no distributional assumptions beyond finite moments,' but the text should clarify whether this applies to the online recursion or only to the offline consistency result.
Simulated Author's Rebuttal
We thank the referee for the constructive and detailed feedback. We address each major comment below, indicating planned revisions where appropriate.
read point-by-point responses
-
Referee: [§3] §3 (Theoretical properties): Consistency of the recursively estimated DMD operator and its truncated eigenvalues is established only under the canonical VAR model. The central claim of reliable detection on video and text data (with no assumptions beyond finite moments) therefore rests on the unproven assertion that dependence shifts will produce detectable changes in the truncated eigenvalue sequence even when the linear approximation is poor; no robustness analysis or counter-example study under nonlinear dynamics is provided to support this extrapolation.
Authors: We acknowledge that the consistency results for the DMD estimator and truncated eigenvalues are derived specifically under the canonical VAR model, which provides a linear approximation that directly motivates the algorithmic design. The method itself is nonparametric and requires only finite moments, with no further distributional assumptions. While we do not provide a dedicated robustness analysis or counterexamples for strongly nonlinear regimes, the empirical results on inherently nonlinear data such as video and text demonstrate that shifts in the truncated eigenvalue sequence remain detectable in practice. In the revision we will clarify the scope of the theoretical results in §3, explicitly noting that the VAR analysis serves as a motivating case rather than a universal guarantee, and we will add a short discussion of the empirical support for broader applicability. revision: partial
-
Referee: [§5] §5 (Experiments, real-data results): The reported competitive performance on video and text datasets is presented without ablation isolating the contribution of the optimal linear assignment and augmented monitoring scheme. It is therefore unclear whether the gains are attributable to the DMD-eigenvalue statistic itself or to the permutation/complex-value corrections; this directly affects the load-bearing claim that the method reliably captures cross-variable and temporal dependence changes.
Authors: We agree that an ablation isolating the optimal linear assignment and augmented monitoring components would strengthen the presentation. The current experiments evaluate the full CHASM pipeline against competitors but do not decompose the contribution of these two elements. We will add an ablation study to the revised §5, reporting performance of CHASM variants with and without each component on the video and text datasets. This will clarify whether the observed gains stem primarily from the DMD-eigenvalue monitoring statistic or from the permutation and complex-value handling. revision: yes
Circularity Check
No significant circularity; derivation self-contained via external VAR motivation and novel components
full rationale
The paper motivates CHASM from the canonical VAR model (external to the present work) and introduces new algorithmic elements (optimal linear assignment for permutation invariance; augmented monitoring for complex-valued series) to monitor the truncated DMD eigenvalue sequence. Theoretical consistency is studied under VAR assumptions, but this does not reduce the online detection statistic or performance claims to a fit or self-referential equation. Empirical results on synthetic/real data (video/text) are presented as independent validation without renaming fitted quantities as predictions or relying on load-bearing self-citations for the core uniqueness or correctness. No quoted step equates a claimed result to its own inputs by construction.
Axiom & Free-Parameter Ledger
free parameters (2)
- eigenvalue truncation level
- changepoint detection threshold
axioms (2)
- domain assumption Time series possess finite moments
- domain assumption Canonical vector autoregressive model governs the dynamics for theoretical analysis
Reference graph
Works this paper leans on
- [1]
-
[2]
A. Alanqary, A. Alomar, and D. Shah. Change Point Detection via Multivariate Singular Spectrum Analysis. InAdvances in Neural Information Processing Systems, volume 34, pages 23218–23230, 2021
work page 2021
- [3]
-
[4]
A. Aue, S. Hörmann, L. Horváth, and M. Reimherr. Break detection in the covariance structure of multivariate time series models.The Annals of Statistics, 37(6B):4046–4087, 2009
work page 2009
-
[5]
P. Bai, A. Safikhani, and G. Michailidis. Multiple Change Points Detection in Low Rank and Sparse High Dimensional Vector Autoregressive Models.IEEE Transactions on Signal Processing, 68: 3074–3089, 2020
work page 2020
-
[6]
P. Bai, A. Safikhani, and G. Michailidis. Multiple Change Point Detection in Reduced Rank High Dimensional Vector Autoregressive Models.Journal of the American Statistical Association, 118 (544):2776–2792, 2023
work page 2023
-
[7]
D. Bartz and K.-R. Müller. Covariance shrinkage for autocorrelated data. InAdvances in Neural Information Processing Systems, volume 27, 2014
work page 2014
-
[8]
S. Basu and G. Michailidis. Regularized Estimation in Sparse High-Dimensional Time Series Models. The Annals of Statistics, pages 1535–1567, 2015
work page 2015
-
[9]
S. Basu, X. Li, and G. Michailidis. Low Rank and Structured Modeling of High-Dimensional Vector Autoregressions.IEEE Transactions on Signal Processing, 67(5):1207–1222, 2019
work page 2019
- [10]
-
[11]
Bertsimas.Introduction to Linear Optimization
D. Bertsimas.Introduction to Linear Optimization. Athena Scientific, 1997
work page 1997
-
[12]
D. A. Bodenham and N. M. Adams. Continuous monitoring for changepoints in data streams using adaptive estimation.Statistics and Computing, 27(5):1257–1270, 2017
work page 2017
-
[13]
R. A. Borsoi, C. Richard, A. Ferrari, J. Chen, and J. C. M. Bermudez. Online Graph-Based Change Point Detection in Multiband Image Sequences. In28th European Signal Processing Conference, pages 850–854. IEEE, 2021
work page 2021
-
[14]
S. L. Brunton and J. N. Kutz.Data-Driven Science and Engineering: Machine Learning, Dynamical Systems, and Control. Cambridge University Press, 2022
work page 2022
-
[15]
S. L. Brunton, M. Budišić, E. Kaiser, and J. N. Kutz. Modern Koopman Theory for Dynamical Systems.SIAM Review, 64(2):229–340, 2022
work page 2022
-
[16]
T. Cai, W. Liu, and Y. Xia. Two-Sample Covariance Matrix Testing and Support Recovery in High-Dimensional and Sparse Settings.Journal of the American Statistical Association, 108(501): 265–277, 2013
work page 2013
-
[17]
H. P. Chan. Optimal sequential detection in multi-stream data.The Annals of Statistics, 45(6): 2736–2763, 2017
work page 2017
-
[18]
Y. Chen, T. Wang, and R. J. Samworth. High-dimensional, multiscale online changepoint detection. Journal of the Royal Statistical Society Series B: Statistical Methodology, 84(1):234–266, 2022
work page 2022
-
[19]
F. Enikeeva, O. Klopp, and M. Rousselot. Change-point detection in low-rank VAR processes. Bernoulli, 31(2):1058–1083, 2025. 12
work page 2025
-
[20]
P. Fearnhead and P. Fryzlewicz. Detecting A Single Change-Point.arXiv preprint arXiv:2210.07066, 2022
-
[21]
A. Foi, M. Trimeche, V. Katkovnik, and K. Egiazarian. Practical Poissonian-Gaussian Noise Modeling and Fitting for Single-Image Raw-Data.IEEE Transactions on Image Processing, 17(10):1737–1754, 2008
work page 2008
-
[22]
Y. Fridman, M. Rusanovsky, and G. Oren. ChangeChip: A Reference-Based Unsupervised Change Detection for PCB Defect Detection. InIEEE Physical Assurance and Inspection of Electronics, pages 1–8, 2021
work page 2021
-
[23]
C. M. Garcia, R. Abilio, A. L. Koerich, A. S. Britto Jr, and J. P. Barddal. Concept Drift Adaptation in Text Stream Mining Settings: A Systematic Review.ACM Transactions on Intelligent Systems and Technology, 16(2):1–67, 2025
work page 2025
-
[24]
M. Gavish and D. L. Donoho. The Optimal Hard Threshold for Singular Values is4/ √ 3.IEEE Transactions on Information Theory, 60(8):5040–5053, 2014
work page 2014
-
[25]
G. H. Golub and C. F. Van Loan.Matrix Computations. Johns Hopkins University Press, 2013
work page 2013
-
[26]
C. Gorrostieta, H. Ombao, P. Bédard, and J. N. Sanes. Investigating brain connectivity using mixed effects vector autoregressive models.NeuroImage, 59(4):3347–3355, 2012
work page 2012
-
[27]
J. D. Hamilton.Time Series Analysis. Princeton University Press, 1994
work page 1994
-
[28]
R. A. Horn and C. R. Johnson.Matrix Analysis. Cambridge University Press, 2012
work page 2012
- [29]
- [30]
-
[31]
R. Jonker and A. Volgenant. A Shortest Augmenting Path Algorithm for Dense and Sparse Linear Assignment Problems.Computing, 38(4):325–340, 1987
work page 1987
-
[32]
N. Kawaguchi, N. Ogawa, Y. Iwasaki, K. Kaji, T. Terada, K. Murao, S. Inoue, Y. Kawahara, Y. Sumi, and N. Nishio. HASC Challenge: Gathering Large Scale Human Activity Corpus for the Real-World Activity Understandings. InProceedings of the 2nd Augmented Human International Conference, pages 1–5, 2011
work page 2011
- [33]
- [34]
-
[35]
R. Killick, P. Fearnhead, and I. A. Eckley. Optimal Detection of Changepoints With a Linear Computational Cost.Journal of the American Statistical Association, 107(500):1590–1598, 2012
work page 2012
-
[36]
J. Knoblauch and T. Damoulas. Spatio-temporal Bayesian On-line Changepoint Detection with Model Selection. InInternational Conference on Machine Learning, pages 2718–2727, 2018
work page 2018
-
[37]
A. Krizhevsky and G. Hinton. Learning Multiple Layers of Features from Tiny Images. Technical report, University of Toronto, 2009
work page 2009
-
[38]
A. Kusupati, G. Bhatt, A. Rege, M. Wallingford, A. Sinha, V. Ramanujan, W. Howard-Snyder, K. Chen, S. Kakade, P. Jain, and A. Farhadi. Matryoshka Representation Learning. InAdvances in Neural Information Processing Systems, volume 35, pages 30233–30249, 2022
work page 2022
-
[39]
K. Lang. NewsWeeder: Learning to Filter Netnews. InMachine Learning Proceedings, pages 331–339. Elsevier, 1995. 13
work page 1995
- [40]
-
[41]
R. B. Lehoucq, D. C. Sorensen, and C. Yang.ARPACK Users’ Guide: Solution of Large-Scale Eigenvalue Problems with Implicitly Restarted Arnoldi Methods. SIAM, 1998
work page 1998
- [42]
- [43]
-
[44]
S. Liu, D. Marinelli, L. Bruzzone, and F. Bovolo. A Review of Change Detection in Multitemporal Hyperspectral Images: Current techniques, applications, and challenges.IEEE Geoscience and Remote Sensing Magazine, 7(2):140–158, 2019
work page 2019
-
[45]
C. A. Lowry, W. H. Woodall, C. W. Champ, and S. E. Rigdon. A Multivariate Exponentially Weighted Moving Average Control Chart.Technometrics, 34(1):46–53, 1992
work page 1992
-
[46]
F. M. Megahed, L. J. Wells, J. A. Camelio, and W. H. Woodall. A Spatiotemporal Method for the Monitoring of Image Data.Quality and Reliability Engineering International, 28(8):967–980, 2012
work page 2012
-
[47]
Y. Mei. Efficient scalable schemes for monitoring a large number of data streams.Biometrika, 97(2): 419–433, 2010
work page 2010
-
[48]
G. Michailidis and F. d’Alché Buc. Autoregressive models for gene regulatory network inference: Sparsity, stability and causality issues.Mathematical Biosciences, 246(2):326–334, 2013
work page 2013
-
[49]
C. M. Michel and M. M. Murray. Towards the utilization of EEG as a brain imaging tool.Neuroimage, 61(2):371–385, 2012
work page 2012
-
[50]
J. Munkres. Algorithms for the Assignment and Transportation Problems.Journal of the Society for Industrial and Applied Mathematics, 5(1):32–38, 1957
work page 1957
-
[51]
E. S. Page. Continuous Inspection Schemes.Biometrika, 41(1/2):100–115, 1954
work page 1954
- [52]
-
[53]
A. Radford, J. W. Kim, C. Hallacy, A. Ramesh, G. Goh, S. Agarwal, G. Sastry, A. Askell, P. Mishkin, J. Clark, G. Krueger, and I. Sutskever. Learning Transferable Visual Models From Natural Language Supervision. InInternational Conference on Machine Learning, pages 8748–8763, 2021
work page 2021
-
[54]
S. E. Rigdon. An integral equation for the in-control average run length of a multivariate exponentially weighted moving average control chart.Journal of Statistical Computation and Simulation, 52(4): 351–365, 1995
work page 1995
-
[55]
G. C. Runger and S. S. Prabhu. A Markov Chain Model for the Multivariate Exponentially Weighted Moving Averages Control Chart.Journal of the American Statistical Association, 91(436):1701–1706, 1996
work page 1996
-
[56]
S. Ryan and R. Killick. Detecting Changes in Covariance via Random Matrix Theory.Technometrics, 65(4):480–491, 2023
work page 2023
-
[57]
P. J. Schmid. Dynamic mode decomposition of numerical and experimental data.Journal of Fluid Mechanics, 656:5–28, 2010
work page 2010
-
[58]
P. J. Schmid. Dynamic Mode Decomposition and Its Variants.Annual Review of Fluid Mechanics, 54(1):225–254, 2022
work page 2022
-
[59]
P. J. Schreier and L. L. Scharf.Statistical Signal Processing of Complex-Valued Data: The Theory of Improper and Noncircular Signals. Cambridge University Press, 2010. 14
work page 2010
-
[60]
X. Shi, C. Beaulieu, R. Killick, and R. Lund. Changepoint Detection: An Analysis of the Central England Temperature Series.Journal of Climate, 35(19):6329–6342, 2022
work page 2022
-
[61]
J. H. Stock and M. W. Watson. Vector Autoregressions.Journal of Economic Perspectives, 15(4): 101–115, 2001
work page 2001
- [62]
-
[63]
W. Sultani, C. Chen, and M. Shah. Real-World Anomaly Detection in Surveillance Videos. In Proceedings of the IEEE Conference on Computer Vision and Pattern Recognition, pages 6479–6488, 2018
work page 2018
-
[64]
N. Takeishi, Y. Kawahara, and T. Yairi. Learning koopman Invariant Subspaces for Dynamic Mode Decomposition. InAdvances in Neural Information Processing Systems, volume 30, 2017
work page 2017
-
[65]
Y. Tian and A. Safikhani. Sequential Change Point Detection in High-Dimensional Vector Auto- regressive Models.Statistica Sinica, 2024
work page 2024
- [66]
-
[67]
Y. Wang and C. Goutte. Real-time Change Point Detection using On-line Topic Models. In Proceedings of the 27th International Conference on Computational Linguistics, pages 2505–2515, 2018
work page 2018
- [68]
- [69]
-
[70]
Qwen3 Embedding: Advancing Text Embedding and Reranking Through Foundation Models
Y. Zhang, M. Li, D. Long, X. Zhang, H. Lin, B. Yang, P. Xie, A. Yang, D. Liu, J. Lin, F. Huang, and J. Zhou. Qwen3 Embedding: Advancing Text Embedding and Reranking Through Foundation Models.arXiv preprint arXiv:2506.05176, 2025
work page internal anchor Pith review Pith/arXiv arXiv 2025
-
[71]
X. Zheng and S. Mak. BLAST: Bayesian online change-point detection with structured image data. arXiv preprint arXiv:2504.09783, 2025. 15 A Extended background A.1 Vector autoregressive processes Definition 1.A d-dimensional vector autoregressive process of orderp, denoted VARd(p), d, p∈N, is a discrete-time stochastic process{yt}, wherey t ∈R d, following...
-
[72]
Compute the correlation matrixRasR ij = Σij/ p ΣiiΣjj
-
[73]
Drawz∼ N(0, R), a correlated standard normal vector
-
[74]
Transform to uniform marginals asu= Φ(z)element-wise
-
[75]
Apply the inverse Laplacexi =F −1 Lap(ui |0, s i), withs i = √Σii/ √ 2. The result εt = X has marginal Laplace distributions with varianceΣii and cross-correlation structure induced byR. Note that the marginal variance of aLaplace(0, s)distribution is 2s2 = Σii, so the covariance matrix ofεt isΣby construction. Bivariate VAR with Student’stnoise Purpose.E...
work page 2000
-
[76]
The first and last transitions are discarded (start/end boundary artefacts)
-
[77]
The other transitions come in pairs (labelled→ unlabelled and unlabelled→ labelled); the first element of each pair is retained, corresponding to the onset of each labelled activity region. Output.Each recording yields one time series of dimensiond = 3and length Ti, where Ti varies by recording, along with a list of changepoint indices. We compute accurac...
-
[78]
DrawK+ 1 = 5distinct coarse classes uniformly without replacement
-
[79]
For each chosen superclass, randomly select one of its 5 fine classes
-
[80]
Compute nominal changepoint positionsτ nom k = k T /(K + 1)for k = 1, . . . , K, and add i.i.d. jitterj k ∼Uniform{−30, . . . ,+30}:τ k =τ nom k +j k
discussion (0)
Sign in with ORCID, Apple, or X to comment. Anyone can read and Pith papers without signing in.