Recognition: 2 theorem links
· Lean TheoremCharacterisation of the Thermoflow due to the Dry Nitrogen Flushing Scheme in the ATLAS Inner Tracker using Computational Fluid Dynamics
Pith reviewed 2026-05-12 01:11 UTC · model grok-4.3
The pith
A CFD model of dry nitrogen flushing in the ATLAS Inner Tracker shows how to keep dew points below -60°C even when CO2 coolant faults occur.
A machine-rendered reading of the paper's core claim, the machinery that carries it, and where it could break.
Core claim
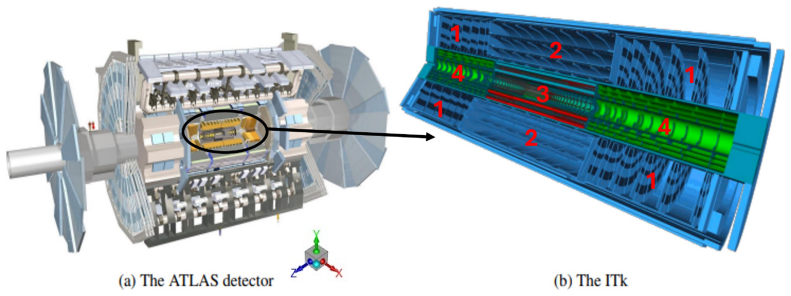
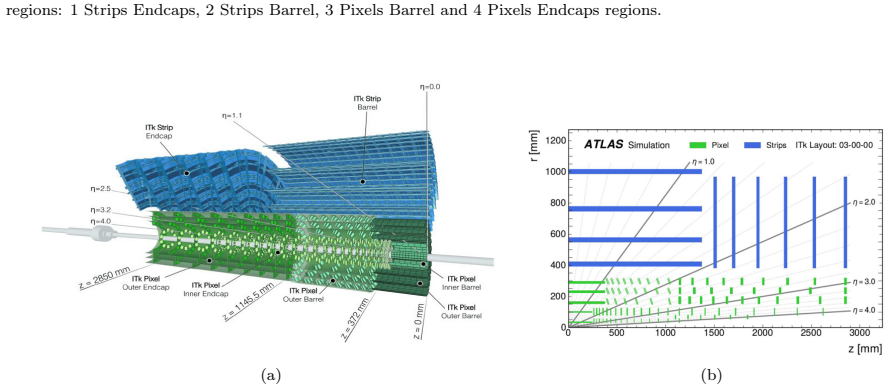
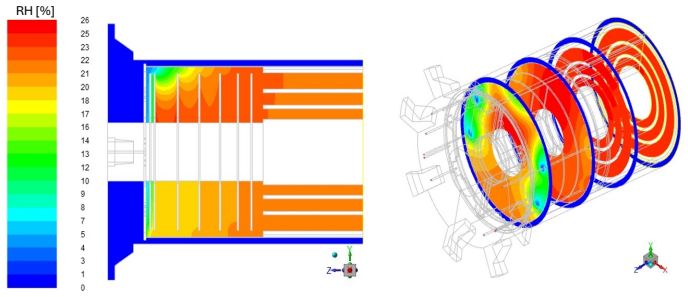
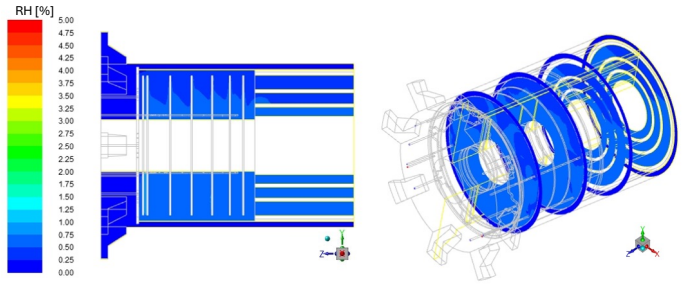
The computational fluid dynamics model characterises the thermoflow produced by the dry nitrogen flushing scheme in the Common Environmental Monitoring and Interlock System for the ATLAS Inner Tracker. It supplies quantitative and qualitative information on temperature, humidity, and velocity fields under operational conditions and under air-ingress events caused by leaks or outlet over-pressure, thereby guiding engineering changes that keep the detector volume dry and within the required dew-point specification.
What carries the argument
The three-dimensional computational fluid dynamics simulation of nitrogen flow, heat transfer, and moisture transport inside the ITk volume, including inlet/outlet boundaries and air-ingress sources.
If this is right
- Design adjustments to flushing inlets, outlets, or flow rates can be evaluated before fabrication to eliminate moisture pockets.
- The monitoring system can be tuned to trigger flushing early enough to prevent condensation during coolant faults.
- Air-ingress paths from leaks or pressure imbalances are shown to be manageable if flushing capacity is sized correctly.
Where Pith is reading between the lines
- The same modelling approach could be used to check flushing performance after future detector modifications or in other large cryogenic detector volumes.
- If the model is later validated against real data, it could reduce the need for extensive physical testing during commissioning.
Load-bearing premise
The CFD model correctly reproduces the actual gas flow patterns, leak rates, thermal boundary conditions, and moisture transport that will exist in the completed detector.
What would settle it
A prototype test that measures local dew-point values and flow velocities at several locations inside a representative ITk enclosure under a controlled -55°C coolant fault and finds sustained regions above -60°C where the model predicted none.
Figures


read the original abstract
The planned High Luminosity upgrade to the Large Hadron Collider at CERN aims to increase the instantaneous luminosity peak to about 7.5 x 10^{34} cm^{-2}s^{-1}. The ATLAS detector will be extensively re-designed to meet the challenges of this upgrade. This paper focuses on the use of computational fluid dynamics to characterise the thermoflow in order to model the dry nitrogen flushing scheme in the Common Environmental Monitoring and Interlock System for the ATLAS Inner Tracker as part of the upgrade process. The Technical Design Report considers the possibility for the bi-phase CO2 coolant temperature to drop to as low as -55 degrees C in the case of a fault. The specification for the highest Relative Humidity within the ITk volume is therefore equivalent to a dew point temperature at or below -60 degrees C in order to prevent condensation which could damage the detector electronics. The design accommodates for humidity monitoring to detect the onset of such events and dry nitrogen flushing to remove moisture. Therefore, it is important to thoroughly understand all consequences of atmospheric air ingress due to air-leaks and/or air-ingress from the outlets due to the over-pressure. The computational fluid dynamics model presented in this study was used to provide quantitative and qualitative insight into the various operational and failure conditions, informing engineering design changes to optimise the flushing scheme and ensure that the ITk remains dry and within the design specification of the acceptable dew point range.
Editorial analysis
A structured set of objections, weighed in public.
Referee Report
Summary. The paper presents a computational fluid dynamics (CFD) analysis to characterize thermoflow in the dry nitrogen flushing scheme of the ATLAS Inner Tracker (ITk) for the High-Luminosity LHC upgrade. It models operational and failure scenarios (air leaks, outlet over-pressure, moisture ingress) at coolant temperatures down to -55 °C to ensure dew-point temperatures remain ≤ -60 °C, and claims the results provide quantitative and qualitative insight that directly informs engineering design optimizations for the Common Environmental Monitoring and Interlock System.
Significance. If the CFD predictions are shown to be reliable, the work would supply useful engineering guidance for maintaining a dry environment in a large-scale silicon tracker, helping prevent condensation damage to electronics under fault conditions. The application of CFD to buoyancy-driven mixing and species transport of water vapor in a complex detector volume is a relevant contribution to detector design methodology.
major comments (2)
- [Abstract] Abstract: the central claim that the CFD model supplies quantitative/qualitative insight informing design changes rests on the unstated assumption that the simulation faithfully reproduces real thermoflow, leak rates, and air-ingress behavior; however, the abstract (and by extension the manuscript) supplies no information on experimental validation, mesh-independence studies, turbulence-model selection, or quantified boundary conditions for inlets, outlets, and leaks.
- [Methods/Results] Methods/Results sections: no comparison of simulated dew-point margins or flow patterns against any measured data is described, nor are details given on the treatment of buoyancy effects, species transport of water vapor, or the low-flow, low-temperature regime; without these the reported margins and recommended flushing optimizations cannot be assessed for physical accuracy.
minor comments (1)
- [Abstract] The abstract would be clearer if it named the CFD software package and briefly stated the key modeling assumptions (e.g., steady-state vs. transient, RANS vs. LES).
Simulated Author's Rebuttal
We are grateful to the referee for the insightful comments on our CFD analysis of the ATLAS ITk dry nitrogen flushing scheme. The feedback highlights important aspects for improving the clarity and completeness of the manuscript. We respond to each major comment below and outline the revisions we will make.
read point-by-point responses
-
Referee: [Abstract] Abstract: the central claim that the CFD model supplies quantitative/qualitative insight informing design changes rests on the unstated assumption that the simulation faithfully reproduces real thermoflow, leak rates, and air-ingress behavior; however, the abstract (and by extension the manuscript) supplies no information on experimental validation, mesh-independence studies, turbulence-model selection, or quantified boundary conditions for inlets, outlets, and leaks.
Authors: We concur that the abstract would benefit from additional context on the simulation methodology. In the revised manuscript, we will modify the abstract to reference the use of mesh independence studies, the selected turbulence model, and the quantified boundary conditions employed. We note that this work is a computational study intended to guide design prior to hardware implementation, and thus experimental validation against real thermoflow data is not included. A new section will be added to discuss model verification through mesh studies and the approach to future validation. revision: partial
-
Referee: [Methods/Results] Methods/Results sections: no comparison of simulated dew-point margins or flow patterns against any measured data is described, nor are details given on the treatment of buoyancy effects, species transport of water vapor, or the low-flow, low-temperature regime; without these the reported margins and recommended flushing optimizations cannot be assessed for physical accuracy.
Authors: We will revise the Methods section to include comprehensive details on the buoyancy modeling (accounting for density variations due to temperature and composition), the species transport equations for water vapor, and the rationale for the turbulence model in the low-flow, low-temperature conditions. Specific numerical values for all boundary conditions will be provided. Regarding comparisons to measured data, no such data exists for the ITk flushing system at present, as the detector is in the construction phase. We will explicitly state this limitation and describe how the CFD results are used qualitatively and quantitatively to inform the design optimizations. revision: partial
- Provision of direct comparisons between simulated dew-point margins or flow patterns and experimental measurements, due to the unavailability of relevant measured data from the ITk at this stage.
Circularity Check
No circularity; forward CFD simulation with no derivations or self-referential steps
full rationale
The paper describes application of standard computational fluid dynamics software to simulate thermoflow, nitrogen flushing, air ingress, and dew-point conditions in the ITk volume under operational and fault scenarios (e.g., -55 °C coolant). No equations, fitted parameters, predictions derived from subsets of data, or uniqueness theorems are presented. The central claim rests on running the model to obtain quantitative/qualitative insight, which does not reduce to any input by construction. No self-citations are load-bearing for the method itself. This is a typical forward simulation study whose validity depends on external CFD validation and mesh/turbulence choices, but those are separate from circularity.
Axiom & Free-Parameter Ledger
Lean theorems connected to this paper
-
IndisputableMonolith/Cost/FunctionalEquation.leanwashburn_uniqueness_aczel unclear?
unclearRelation between the paper passage and the cited Recognition theorem.
The computational fluid dynamics model presented in this study was used to provide quantitative and qualitative insight into the various operational and failure conditions, informing engineering design changes to optimise the flushing scheme
-
IndisputableMonolith/Foundation/RealityFromDistinction.leanreality_from_one_distinction unclear?
unclearRelation between the paper passage and the cited Recognition theorem.
The present work uses a CFD flow solver based on the finite volume method to solve the Reynolds-Averaged Navier-Stokes equations and species transport
What do these tags mean?
- matches
- The paper's claim is directly supported by a theorem in the formal canon.
- supports
- The theorem supports part of the paper's argument, but the paper may add assumptions or extra steps.
- extends
- The paper goes beyond the formal theorem; the theorem is a base layer rather than the whole result.
- uses
- The paper appears to rely on the theorem as machinery.
- contradicts
- The paper's claim conflicts with a theorem or certificate in the canon.
- unclear
- Pith found a possible connection, but the passage is too broad, indirect, or ambiguous to say the theorem truly supports the claim.
Reference graph
Works this paper leans on
-
[1]
ATLAS Collaboration,The ATLAS Experiment at the CERN Large Hadron Collider, JINST3(2008) S08003 (cit. on p. 1). [2]ATLAS: A 25-Year Insider Story of the LHC Experiment, World Scientific, 2019, isbn: 978-981-327-179-1 (cit. on p. 1)
work page 2008
-
[2]
O. Aberle et al.,High-Luminosity Large Hadron Collider (HL-LHC): Technical design report, CERN Yellow Reports: Monographs, Geneva: CERN, 2020 (cit. on p. 1)
work page 2020
-
[3]
ATLAS Collaboration,ATLAS Inner Tracker Strip Detector: Technical Design Report, ATLAS-TDR-025; CERN-LHCC-2017-005, CERN Document Server, 2017 (cit. on pp. 1–3, 9)
work page 2017
-
[4]
ATLAS,Letter of Intent for the Phase-II Upgrade of the ATLAS Experiment, tech
C. ATLAS,Letter of Intent for the Phase-II Upgrade of the ATLAS Experiment, tech. rep., CERN Document Server: CERN, 2012 (cit. on p. 1)
work page 2012
-
[5]
ATLAS Collaboration,ATLAS Inner Tracker Pixel Detector: Technical Design Report, ATLAS-TDR-030; CERN-LHCC-2017-021, CERN Document Server, 2017 (cit. on p. 2)
work page 2017
-
[6]
M. Consales et al.,Nanoscale TiO2-coated LPGs as radiation- tolerant humidity sensors for high-energy physics applications, Opt. Lett.39(2014) 4128 (cit. on p. 2)
work page 2014
-
[7]
G. Berruti,Radiation tolerant fiber optic humidity sensors for High Energy Physics Applications, PhD Thesis, Universita’ degli Studi del Sannio (2015) 1 (cit. on p. 2)
work page 2015
-
[8]
K. H. Versteeg and W. Malalasekera, An Introduction to Computational Fluid Dynamics : The Finite Volume Method, 1st ed., Essex: Longman Scientific and Technical, 1995 (cit. on pp. 3, 7)
work page 1995
-
[9]
S. V. Patankar,Numerical Heat Transfer and Fluid Flow, 1st ed., Minnesota: Hemisphere Publishing Corporation, 1980 (cit. on pp. 3, 7)
work page 1980
-
[10]
R. Ansorge,Mathematical Models of Fluid Dynamics: Modelling, Theory, Basic Numerical Facts - An Introduction, 1st ed., Hamburg: WILEY-VCH GmbH&Co. KGaA, Weinheim, Inc., 2003 (cit. on p. 3)
work page 2003
-
[11]
X Cui, K. Chua and W. Yang, Numerical simulation of a novel energy-efficient dew-point evaporative air cooler, Applied energy136(2014) 979 (cit. on p. 3)
work page 2014
-
[12]
M Alizadeh and S. Sadrameli,Numerical modeling and optimization of thermal comfort in building: Central composite design and CFD simulation, Energy and Buildings164(2018) 187 (cit. on p. 3)
work page 2018
-
[13]
A. Palmowska and B. Lipska,Research on improving thermal and humidity conditions in a ventilated ice rink arena using a validated CFD model, International Journal of Refrigeration86(2018) 373 (cit. on pp. 3, 4). 18
work page 2018
- [14]
-
[15]
T. Wen, L. Lu, W. He and Y. Min,Fundamentals and applications of CFD technology on analyzing falling film heat and mass exchangers: A comprehensive review, Applied Energy261(2020) 114473, issn: 0306-2619 (cit. on p. 4)
work page 2020
- [16]
-
[17]
R. J. Atkin and S. Yacoob, ‘Simulation of the strip sub-detectors in the Inner Tracker of the ATLAS detector’, The Proceedings of SAIP2021, the 65th Annual Conference of the South African Institute of Physics, edited by Prof. Aletta Prinsloo, (UJ), South African Institute of Physics, 2021 193, isbn: 978-0-620-97693-0 (cit. on p. 6)
work page 2021
-
[18]
G. A. Munoz,Lecture 3: Introduction to ANSYS Meshing, ANSYS Online Teaching (2015) 1 (cit. on p. 7)
work page 2015
-
[19]
ANSYS Fluent Technical Staff,ANSYS Fluent 19.0 Theory Guide, ANSYS Inc., Canonsburg, PA USA, 2019 (cit. on pp. 7–9)
work page 2019
-
[20]
D. C. Wilcox,Turbulence Modelling for CFD, 2nd ed., Glendale, CA: Griffin Printing, Inc., 1994 (cit. on p. 8)
work page 1994
-
[21]
M. G. Lawrence,The Relationship between relative humidity and the dewpoint temperature in moist Air: A simple conversion and applications, Bulletin of the American Meteorological Society86(2005) 225 (cit. on p. 9)
work page 2005
-
[22]
C. Lacasta,The ATLAS ITk strip detector system for the phase-II LHC upgrade, Nuclear Instruments and Methods in Physics Research Section A: Accelerators, Spectrometers, Detectors and Associated Equipment1078(2025) 170600,issn: 0168-9002 (cit. on p. 9)
work page 2025
-
[23]
F.Rosatelli and S. Tomassini,Leak Rate Specification for the Pixels PP1, ATLAS Technical Documentation AT2-IP-ES-0008 (2025) 1 (cit. on p. 9). 19
work page 2025
discussion (0)
Sign in with ORCID, Apple, or X to comment. Anyone can read and Pith papers without signing in.