Recognition: unknown
Satellite Metallicity Enhancement I: Suppressed Star Formation, Stellar Mass Loss, and Enriched Inflow of DESI and EAGLE Galaxies around Massive Clusters
Pith reviewed 2026-05-14 21:09 UTC · model grok-4.3
The pith
Enriched intracluster gas inflow sustains the metallicity plateau in satellite galaxies out to the cluster virial radius while quenching drives the central drop.
A machine-rendered reading of the paper's core claim, the machinery that carries it, and where it could break.
Core claim
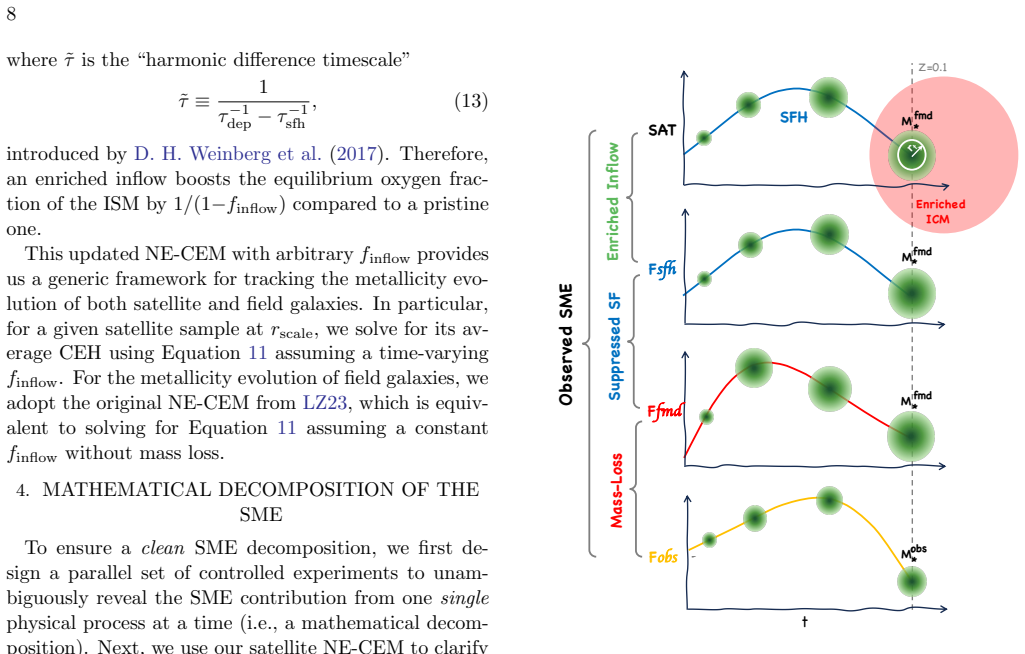
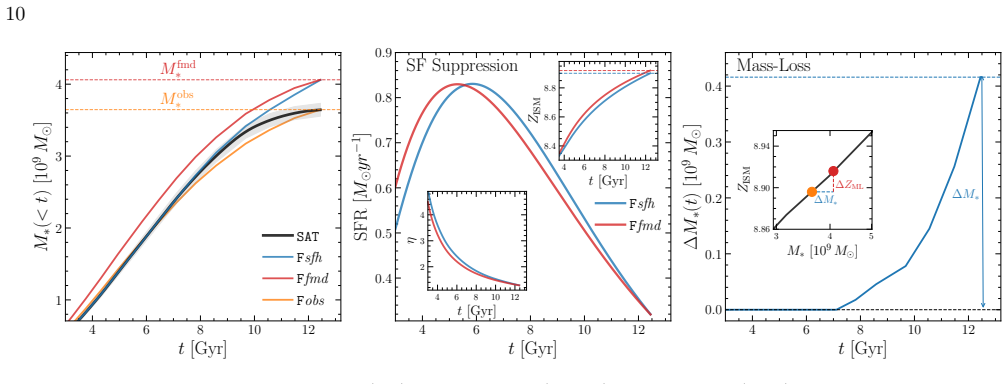
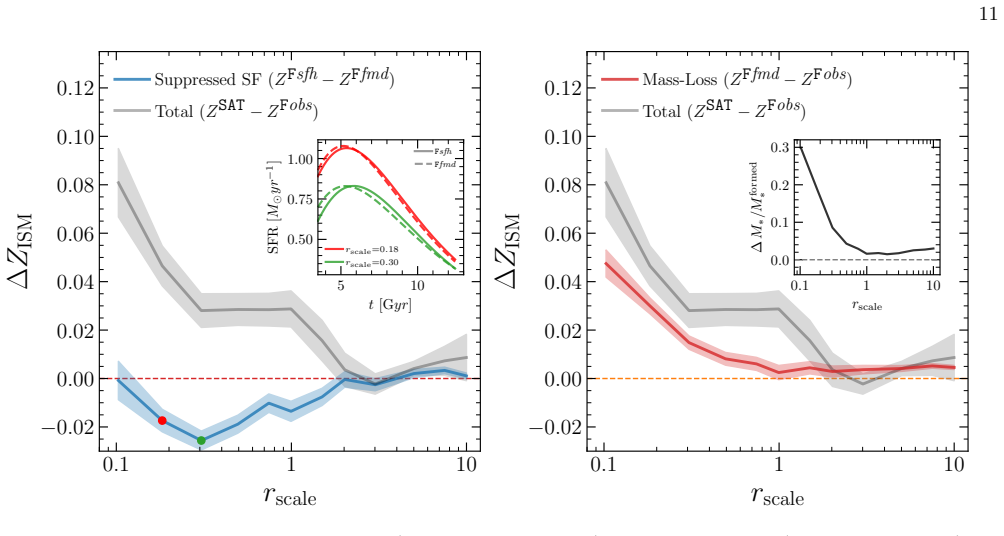
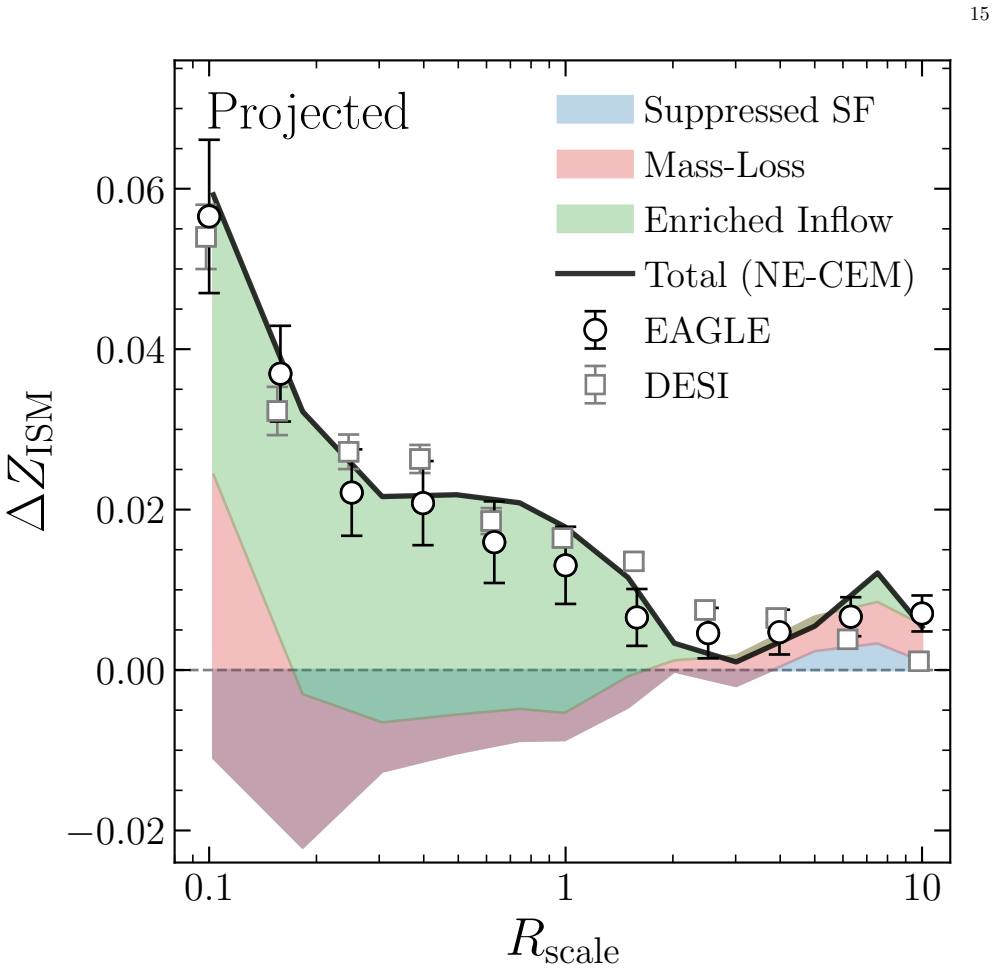
The complex observed satellite metallicity enhancement profile is reproduced in EAGLE, and a new satellite chemical evolution model decomposes it to show that continuous accretion of enriched intracluster medium dominates the plateau within the cluster virial radius while mass loss and quenching together produce the rapid central decline.
What carries the argument
The novel satellite chemical evolution model that decomposes the observed SME profile into additive contributions from suppressed star formation, stellar mass loss, and enriched gas inflow.
If this is right
- Continuous accretion of enriched intracluster medium dominates the SME plateau within the cluster virial radius.
- Mass loss and quenching jointly drive the rapid metallicity decline in the cluster core.
- The decomposition separates the impacts of three environmental processes on galactic chemical enrichment for use with current and future spectroscopic surveys.
Where Pith is reading between the lines
- The same model framework could be applied to lower-mass groups to test whether the relative importance of inflow versus quenching changes with halo mass.
- Incorporating time-dependent inflow metallicity from the surrounding large-scale structure might explain the outer downturn beyond several virial radii.
Load-bearing premise
The satellite chemical evolution model can separate the effects of suppressed star formation, stellar mass loss, and enriched inflow on the metallicity profile without significant degeneracies or missing processes.
What would settle it
A new observational dataset or simulation run that produces a different SME profile shape not reproducible by adjusting only the rates of enriched inflow, mass loss, and star-formation suppression would falsify the decomposition.
Figures


read the original abstract
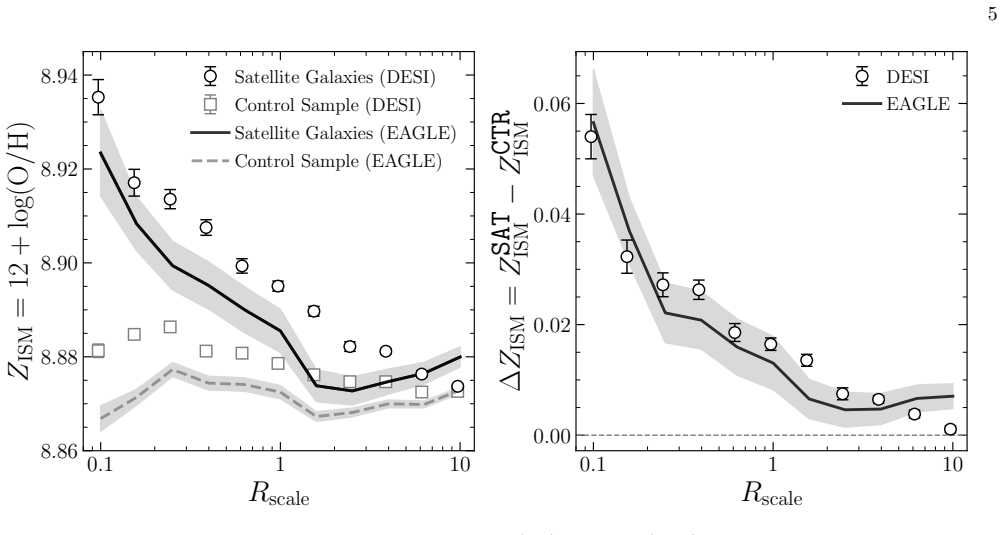
Environmental effects are a primary driver of elevated gas-phase metallicities in galaxies around massive clusters, but the underlying physical mechanisms for this satellite metallicity enhancement (SME) are still unclear. Using the Dark Energy Spectroscopic Instrument (DESI) Data Release 1, we present the first measurement of the average SME as a function of projected cluster-centric distance. The resulting profile reveals three distinct regimes: a steep decline from the cluster center, a plateau near the cluster boundary, and an extended downturn across several cluster radii. Remarkably, the complex shape and amplitude of this observed SME profile are successfully reproduced in the EAGLE cosmological simulation. Drawing insights from EAGLE, we develop a novel satellite chemical evolution model to decompose the observed SME into physical contributions from suppressed star formation, stellar mass loss, and enriched gas inflow. Our analysis shows that continuous accretion of enriched intracluster medium dominates the SME plateau within the cluster virial radius, while mass loss and quenching jointly drive the rapid metallicity decline in the cluster core. Our method disentangles the impacts of three environmental processes on galactic chemical enrichment in the cosmic web, providing a powerful framework for understanding cluster galaxy evolution with current and future spectroscopic surveys.
Editorial analysis
A structured set of objections, weighed in public.
Referee Report
Summary. The paper reports the first measurement of the average satellite metallicity enhancement (SME) profile as a function of projected cluster-centric distance using DESI DR1 data around massive clusters. The observed profile exhibits a steep central decline, a plateau near the virial radius, and an extended outer downturn; this shape and amplitude are reproduced in the EAGLE simulation. A novel satellite chemical evolution model is introduced to decompose the profile into contributions from suppressed star formation, stellar mass loss, and enriched gas inflow, leading to the conclusion that continuous accretion of enriched intracluster medium dominates the plateau inside R_vir while mass loss and quenching drive the core decline.
Significance. If the model's decomposition is robust, the work provides a valuable new framework for disentangling environmental processes affecting galactic chemical enrichment, with direct applicability to ongoing and future spectroscopic surveys. The direct match between the DESI observational profile and EAGLE output is a clear strength, as is the attempt to move beyond qualitative interpretation to quantitative attribution of three distinct mechanisms.
major comments (2)
- [Satellite chemical evolution model and decomposition analysis] The central claim—that enriched ICM accretion dominates the SME plateau while mass loss and quenching drive the core decline—rests entirely on the novel satellite chemical evolution model's ability to uniquely decompose the profile. The model uses a small number of free parameters and functional forms for the three processes, yet the manuscript provides no explicit degeneracy tests (e.g., varying inflow metallicity against mass-loss efficiency while holding the plateau amplitude fixed) or alternative parameterizations. Without these, trade-offs could alter the dominance ranking, undermining the attribution.
- [Satellite chemical evolution model and decomposition analysis] The model is constructed from EAGLE insights and then applied to interpret EAGLE output, introducing moderate circularity. While the DESI profile supplies an independent observational anchor, the manuscript should quantify how much of the decomposition relies on simulation-derived priors versus data-driven constraints, and test robustness when those priors are relaxed.
minor comments (2)
- [Satellite chemical evolution model] Clarify the exact functional forms and fitting procedure for the three-process model, including any regularization or priors applied during decomposition, to allow independent reproduction.
- [Comparison with EAGLE simulation] The abstract states the profile is 'successfully reproduced' in EAGLE; provide quantitative metrics (e.g., reduced chi-squared or residual profiles) for the simulation-observation comparison in the main text.
Simulated Author's Rebuttal
We thank the referee for their constructive comments on the satellite chemical evolution model and its decomposition. We address each point below and will revise the manuscript accordingly to strengthen the analysis.
read point-by-point responses
-
Referee: The central claim—that enriched ICM accretion dominates the SME plateau while mass loss and quenching drive the core decline—rests entirely on the novel satellite chemical evolution model's ability to uniquely decompose the profile. The model uses a small number of free parameters and functional forms for the three processes, yet the manuscript provides no explicit degeneracy tests (e.g., varying inflow metallicity against mass-loss efficiency while holding the plateau amplitude fixed) or alternative parameterizations. Without these, trade-offs could alter the dominance ranking, undermining the attribution.
Authors: We agree that explicit degeneracy tests are needed to confirm the uniqueness of the decomposition. In the revised manuscript, we will add a dedicated subsection with degeneracy tests, including variations of inflow metallicity versus mass-loss efficiency at fixed plateau amplitude, as well as explorations of alternative functional forms. These will demonstrate that the dominance ranking (enriched inflow for the plateau, mass loss and quenching for the core) remains stable. revision: yes
-
Referee: The model is constructed from EAGLE insights and then applied to interpret EAGLE output, introducing moderate circularity. While the DESI profile supplies an independent observational anchor, the manuscript should quantify how much of the decomposition relies on simulation-derived priors versus data-driven constraints, and test robustness when those priors are relaxed.
Authors: We acknowledge the moderate circularity concern. The functional forms are informed by EAGLE, but final parameters are fit to the independent DESI profile. In revision, we will add a quantitative breakdown of simulation priors versus data constraints and include robustness tests with relaxed priors (e.g., broader or data-only constraints), confirming that the main conclusions are insensitive to these choices. revision: yes
Circularity Check
No significant circularity; derivation anchored by independent DESI observations
full rationale
The paper first measures the SME profile directly from DESI DR1 data as a function of cluster-centric distance. It then notes that EAGLE reproduces the observed profile shape and amplitude. Insights from EAGLE are used to construct a satellite chemical evolution model, which is subsequently applied to decompose the DESI-observed profile into contributions from suppressed star formation, stellar mass loss, and enriched inflow. Because the load-bearing input is the independent DESI measurement and the model is used to interpret that external dataset rather than being fitted to and then re-applied to the same EAGLE run in a closed loop, no step reduces by construction to its own inputs. No self-definitional equations, fitted parameters renamed as predictions, or load-bearing self-citations are required for the central claim.
Axiom & Free-Parameter Ledger
free parameters (1)
- decomposition model parameters
axioms (1)
- domain assumption EAGLE simulation accurately represents the physical processes driving satellite metallicity in real clusters
Reference graph
Works this paper leans on
-
[1]
G., Aguilar, J., Ahlen, S., et al
Adame, A. G., Aguilar, J., Ahlen, S., et al. 2025, JCAP, 2025, 028, doi: 10.1088/1475-7516/2025/07/028
-
[2]
Andrews, B. H., & Martini, P. 2013, ApJ, 765, 140, doi: 10.1088/0004-637X/765/2/140
-
[3]
Baldwin, J. A., Phillips, M. M., & Terlevich, R. 1981, PASP, 93, 5, doi: 10.1086/130766
-
[4]
Behroozi, P. S., Wechsler, R. H., & Conroy, C. 2013, ApJ, 770, 57, doi: 10.1088/0004-637X/770/1/57
-
[5]
Blanton, M. R., & Moustakas, J. 2009, ARA&A, 47, 159, doi: 10.1146/annurev-astro-082708-101734
-
[6]
Boselli, A., & Gavazzi, G. 2006, PASP, 118, 517, doi: 10.1086/500691 Bouch´ e, N., Dekel, A., Genzel, R., et al. 2010, ApJ, 718, 1001, doi: 10.1088/0004-637X/718/2/1001
-
[7]
2009, ApJ, 694, 396, doi: 10.1088/0004-637X/694/1/396
Wadsley, J. 2009, ApJ, 694, 396, doi: 10.1088/0004-637X/694/1/396
-
[8]
Cardelli, J. A., Clayton, G. C., & Mathis, J. S. 1989, ApJ, 345, 245, doi: 10.1086/167900
-
[9]
Chabrier, G. 2003, PASP, 115, 763, doi: 10.1086/376392
work page internal anchor Pith review doi:10.1086/376392 2003
-
[10]
Cowie, L. L., Songaila, A., Hu, E. M., & Cohen, J. G. 1996, AJ, 112, 839, doi: 10.1086/118058
-
[11]
Crain, R. A., Schaye, J., Bower, R. G., et al. 2015, MNRAS, 450, 1937, doi: 10.1093/mnras/stv725
-
[12]
2020, MNRAS, 491, 944, doi: 10.1093/mnras/stz2910
Curti, M., Mannucci, F., Cresci, G., & Maiolino, R. 2020, MNRAS, 491, 944, doi: 10.1093/mnras/stz2910
-
[13]
2023, MNRAS, 518, 425, doi: 10.1093/mnras/stac2737 Dav´ e, R., Finlator, K., & Oppenheimer, B
Curti, M., D’Eugenio, F., Carniani, S., et al. 2023, MNRAS, 518, 425, doi: 10.1093/mnras/stac2737 Dav´ e, R., Finlator, K., & Oppenheimer, B. D. 2012, MNRAS, 421, 98, doi: 10.1111/j.1365-2966.2011.20148.x De Rossi, M. E., Bower, R. G., Font, A. S., Schaye, J., &
-
[14]
The DESI Experiment Part I: Science,Targeting, and Survey Design
Theuns, T. 2017, MNRAS, 472, 3354, doi: 10.1093/mnras/stx2158 DESI Collaboration, Aghamousa, A., Aguilar, J., et al. 2016a, arXiv e-prints, arXiv:1611.00036, doi: 10.48550/arXiv.1611.00036 DESI Collaboration, Aghamousa, A., Aguilar, J., et al. 2016b, arXiv e-prints, arXiv:1611.00037, doi: 10.48550/arXiv.1611.00037 DESI Collaboration, Abareshi, B., Aguilar...
work page internal anchor Pith review Pith/arXiv arXiv doi:10.1093/mnras/stx2158 2017
-
[15]
Dey, A., Schlegel, D. J., Lang, D., et al. 2019, AJ, 157, 168, doi: 10.3847/1538-3881/ab089d
-
[16]
F., Capozziello, S., & Dainotti, M
Ellison, S. L., Simard, L., Cowan, N. B., et al. 2009, MNRAS, 396, 1257, doi: 10.1111/j.1365-2966.2009.14817.x
-
[17]
Erb, D. K., Shapley, A. E., Pettini, M., et al. 2006, ApJ, 644, 813, doi: 10.1086/503623
-
[18]
Finlator, K., & Dav´ e, R. 2008, MNRAS, 385, 2181, doi: 10.1111/j.1365-2966.2008.12991.x
-
[19]
2004, PASJ, 56, 29, doi: 10.1093/pasj/56.1.29
Fujita, Y. 2004, PASJ, 56, 29, doi: 10.1093/pasj/56.1.29
-
[20]
Furlong, M., Bower, R. G., Theuns, T., et al. 2015, MNRAS, 450, 4486, doi: 10.1093/mnras/stv852
-
[21]
Green, S. B., van den Bosch, F. C., & Jiang, F. 2021, MNRAS, 503, 4075, doi: 10.1093/mnras/stab696
-
[22]
2018, MNRAS, 477, L35, doi: 10.1093/mnrasl/sly037
Gupta, A., Yuan, T., Torrey, P., et al. 2018, MNRAS, 477, L35, doi: 10.1093/mnrasl/sly037
-
[23]
2023, AJ, 165, 144, doi: 10.3847/1538-3881/acb212 18
Guy, J., Bailey, S., Kremin, A., et al. 2023, AJ, 165, 144, doi: 10.3847/1538-3881/acb212 18
-
[24]
Hahn, C., Wilson, M. J., Ruiz-Macias, O., et al. 2023, AJ, 165, 253, doi: 10.3847/1538-3881/accff8 JUST Team, Liu, C., Zu, Y., et al. 2024, Astronomical Techniques and Instruments, 1, 16, doi: 10.61977/ati2024008
-
[25]
Kauffmann, G., Heckman, T. M., White, S. D. M., et al. 2003, MNRAS, 341, 33, doi: 10.1046/j.1365-8711.2003.06291.x
-
[26]
Kennicutt, Jr., R. C. 1998, ApJ, 498, 541, doi: 10.1086/305588 Lara-L´ opez, M. A., Cepa, J., Bongiovanni, A., et al. 2010, A&A, 521, L53, doi: 10.1051/0004-6361/201014803
-
[27]
Larson, R. B., Tinsley, B. M., & Caldwell, C. N. 1980, ApJ, 237, 692, doi: 10.1086/157917
-
[28]
1979, A&A, 80, 155
Torres-Peimbert, S. 1979, A&A, 80, 155
1979
-
[29]
The DESI Experiment, a whitepaper for Snowmass 2013
Levi, M., Bebek, C., Beers, T., et al. 2013, arXiv e-prints, arXiv:1308.0847, doi: 10.48550/arXiv.1308.0847
work page internal anchor Pith review Pith/arXiv arXiv doi:10.48550/arxiv.1308.0847 2013
-
[30]
Lilly, S. J., Carollo, C. M., Pipino, A., Renzini, A., & Peng, Y. 2013, ApJ, 772, 119, doi: 10.1088/0004-637X/772/2/119
-
[31]
2023, MNRAS, 521, 411, doi: 10.1093/mnras/stad502
Lin, Y., & Zu, Y. 2023, MNRAS, 521, 411, doi: 10.1093/mnras/stad502
-
[32]
Maier, C., Ziegler, B. L., Haines, C. P., & Smith, G. P. 2019, A&A, 621, A131, doi: 10.1051/0004-6361/201834290
-
[33]
Gnerucci, A. 2010, MNRAS, 408, 2115, doi: 10.1111/j.1365-2966.2010.17291.x
-
[34]
F., Capozziello, S., & Dainotti, M
Mannucci, F., Cresci, G., Maiolino, R., et al. 2009, MNRAS, 398, 1915, doi: 10.1111/j.1365-2966.2009.15185.x
-
[35]
Manuwal, A., & Stevens, A. R. H. 2023, MNRAS, 523, 2738, doi: 10.1093/mnras/stad1587
-
[36]
1996, Nature, 379, 613, doi: 10.1038/379613a0
Moore, B., Katz, N., Lake, G., Dressler, A., & Oemler, A. 1996, Nature, 379, 613, doi: 10.1038/379613a0
-
[37]
Mouhcine, M., Baldry, I. K., & Bamford, S. P. 2007, MNRAS, 382, 801, doi: 10.1111/j.1365-2966.2007.12405.x
-
[38]
2023, FastSpecFit: Fast spectral synthesis and emission-line fitting of DESI spectra,, Astrophysics Source Code Library, record ascl:2308.005 http://ascl.net/2308.005
Khederlarian, A. 2023, FastSpecFit: Fast spectral synthesis and emission-line fitting of DESI spectra,, Astrophysics Source Code Library, record ascl:2308.005 http://ascl.net/2308.005
2023
-
[39]
Pasquali, A., Gallazzi, A., & van den Bosch, F. C. 2012, MNRAS, 425, 273, doi: 10.1111/j.1365-2966.2012.21454.x
-
[40]
2015, Nature, 521, 192, doi: 10.1038/nature14439
Peng, Y., Maiolino, R., & Cochrane, R. 2015, Nature, 521, 192, doi: 10.1038/nature14439
-
[41]
2014, MNRAS, 438, 262, doi: 10.1093/mnras/stt2175
Peng, Y.-j., & Maiolino, R. 2014, MNRAS, 438, 262, doi: 10.1093/mnras/stt2175
-
[42]
Petropoulou, V., V´ ılchez, J., Iglesias-P´ aramo, J., et al. 2011, ApJ, 734, 32, doi: 10.1088/0004-637X/734/1/32 Planck Collaboration, Aghanim, N., Akrami, Y., et al. 2020, A&A, 641, A6, doi: 10.1051/0004-6361/201833910
-
[43]
2024, AJ, 168, 245, doi: 10.3847/1538-3881/ad76a4
Poppett, C., Tyas, L., Aguilar, J., et al. 2024, AJ, 168, 245, doi: 10.3847/1538-3881/ad76a4
-
[44]
Sanders, R. L., Shapley, A. E., Jones, T., et al. 2021, ApJ, 914, 19, doi: 10.3847/1538-4357/abf4c1
-
[45]
2005, ApJ, 635, 260, doi: 10.1086/497331
Savaglio, S., Glazebrook, K., Le Borgne, D., et al. 2005, ApJ, 635, 260, doi: 10.1086/497331
-
[46]
Schaye, J., Crain, R. A., Bower, R. G., et al. 2015, MNRAS, 446, 521, doi: 10.1093/mnras/stu2058
-
[47]
2005, A&A, 435, L25, doi: 10.1051/0004-6361:200500107
Schindler, S., Kapferer, W., Domainko, W., et al. 2005, A&A, 435, L25, doi: 10.1051/0004-6361:200500107
-
[48]
Schlafly, E. F., Kirkby, D., Schlegel, D. J., et al. 2023, AJ, 166, 259, doi: 10.3847/1538-3881/ad0832
-
[49]
Shields, G. A., Skillman, E. D., & Kennicutt, Jr., R. C. 1991, ApJ, 371, 82, doi: 10.1086/169872
-
[50]
1996, ApJ, 462, 147, doi: 10.1086/177138
Zaritsky, D. 1996, ApJ, 462, 147, doi: 10.1086/177138
-
[51]
Sotillo-Ramos, D., Lara-L´ opez, M. A., P´ erez-Garc´ ıa, A. M., et al. 2021, MNRAS, 508, 1817, doi: 10.1093/mnras/stab2641
-
[52]
Takada, M., Ellis, R. S., Chiba, M., et al. 2014, PASJ, 66, R1, doi: 10.1093/pasj/pst019
-
[53]
2004, MNRAS, 351, 1379, doi: 10.1111/j.1365-2966.2004.07876.x
Taylor, J. E., & Babul, A. 2004, MNRAS, 348, 811, doi: 10.1111/j.1365-2966.2004.07395.x
-
[54]
Topping, M. W., Shapley, A. E., Sanders, R. L., et al. 2021, MNRAS, 506, 1237, doi: 10.1093/mnras/stab1793
-
[55]
Tremonti, C. A., Heckman, T. M., Kauffmann, G., et al. 2004, ApJ, 613, 898, doi: 10.1086/423264
-
[56]
Wang, X., Jones, T. A., Treu, T., et al. 2019, ApJ, 882, 94, doi: 10.3847/1538-4357/ab3861
-
[57]
Weinberg, D. H., Andrews, B. H., & Freudenburg, J. 2017, ApJ, 837, 183, doi: 10.3847/1538-4357/837/2/183
-
[58]
Wetzel, A. R., Tinker, J. L., Conroy, C., & van den Bosch, F. C. 2013, MNRAS, 432, 336, doi: 10.1093/mnras/stt469
-
[59]
Williamson, D., Martel, H., & Romeo, A. B. 2016, ApJ, 831, 1, doi: 10.3847/0004-637X/831/1/1
-
[60]
2021, ApJ, 909, 143, doi: 10.3847/1538-4357/abddb2
Yang, X., Xu, H., He, M., et al. 2021, ApJ, 909, 143, doi: 10.3847/1538-4357/abddb2
-
[61]
G., Adelman, J., Anderson, Jr., J
York, D. G., Adelman, J., Anderson, Jr., J. E., et al. 2000, AJ, 120, 1579, doi: 10.1086/301513
-
[62]
Zabludoff, A. I., & Mulchaey, J. S. 1998, ApJ, 496, 39, doi: 10.1086/305355
-
[63]
Zaritsky, D., Kennicutt, Jr., R. C., & Huchra, J. P. 1994, ApJ, 420, 87, doi: 10.1086/173544
discussion (0)
Sign in with ORCID, Apple, or X to comment. Anyone can read and Pith papers without signing in.