Recognition: 2 theorem links
· Lean TheoremFrom Expansion to Consolidation: Socio-Spatial Contagion Dynamics in Off-Grid PV Adoption
Pith reviewed 2026-05-13 07:01 UTC · model grok-4.3
The pith
Socio-spatial contagion accelerates off-grid PV adoption, with clustering expanding early then contracting as diffusion matures.
A machine-rendered reading of the paper's core claim, the machinery that carries it, and where it could break.
Core claim
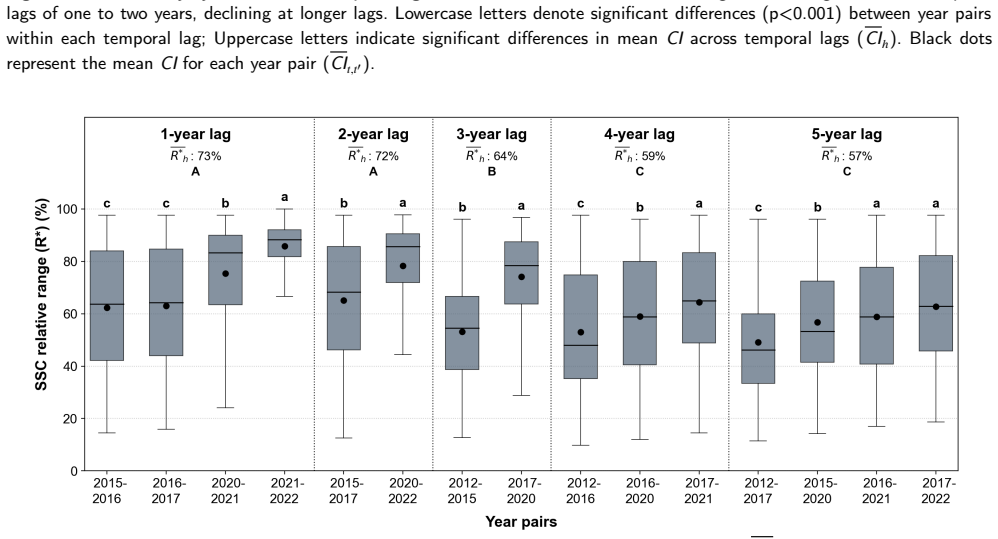
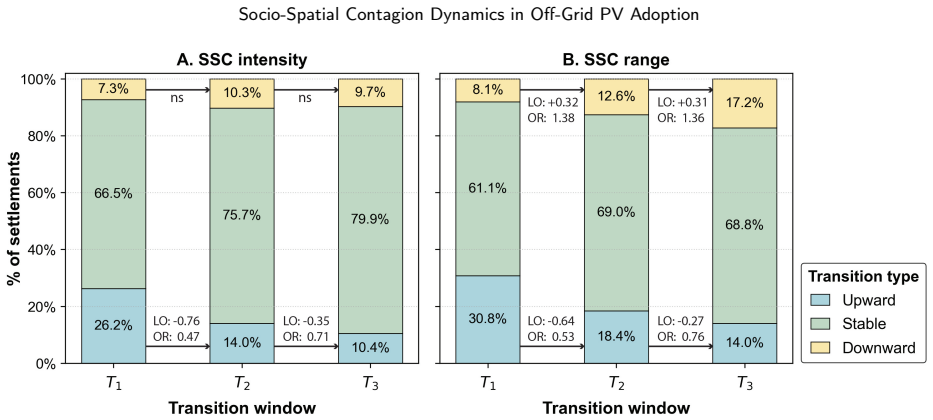
SSC intensity rises with adoption rates across communities and years, yet the spatial range of contagion behaves differently by phase: adoption growth associates with range expansion in early diffusion but with range contraction in later phases, reflecting a move from outward clustering to inward consolidation of installations.
What carries the argument
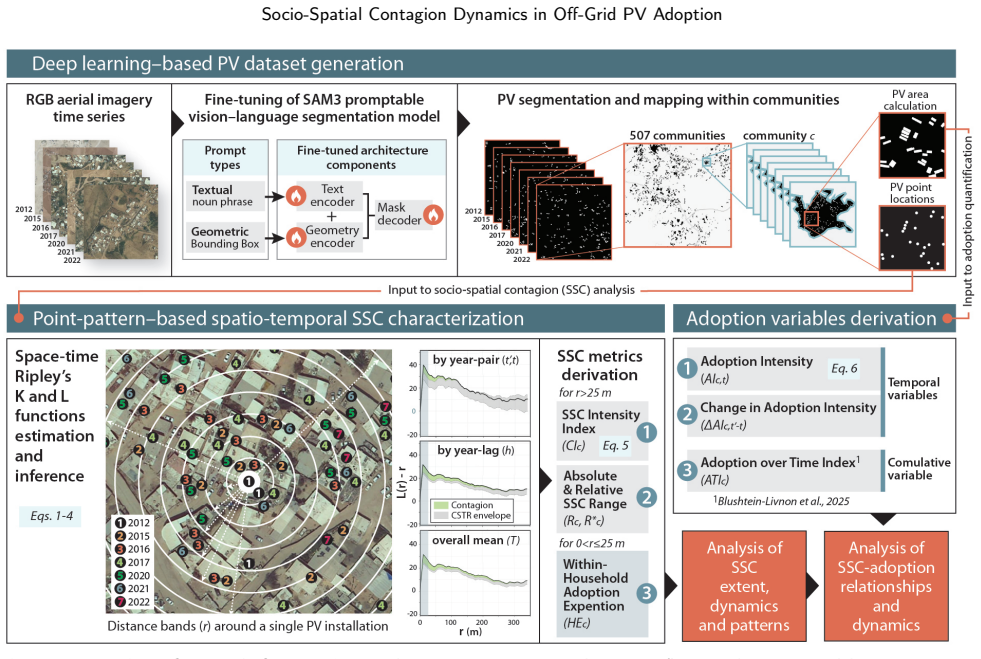
Socio-spatial contagion (SSC) quantified by the range and intensity of spatial clustering of new PV installations around prior adopters, derived from deep-learning segmentation of decade-long remote sensing imagery across 507 settlement clusters.
If this is right
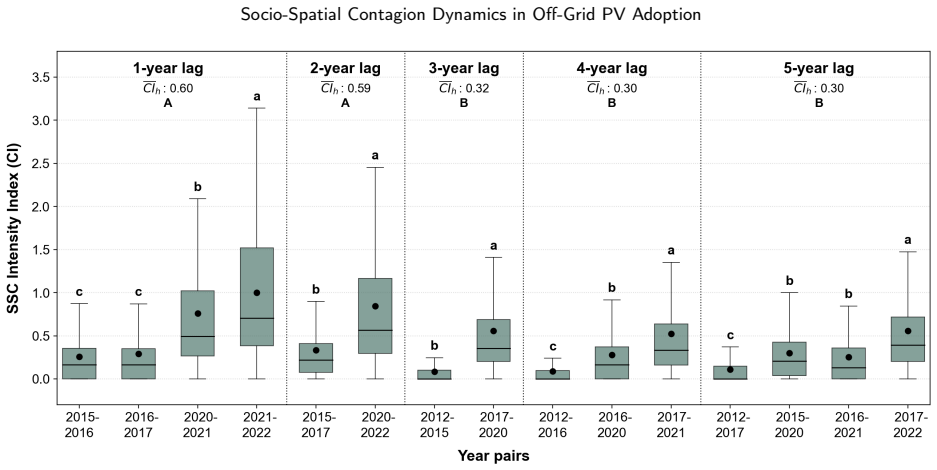
- SSC effects concentrate within one to two years after a nearby installation and then weaken.
- Seeding a small number of early installations could trigger measurable follow-on adoption through contagion.
- Interventions that widen contagion range are more useful in the first phase of diffusion, while those that intensify it become more useful later.
- Off-grid PV diffusion can be tracked and predicted without household surveys by converting satellite time series into point patterns.
Where Pith is reading between the lines
- Targeting the first few installations inside a community may produce larger total adoption than spreading seeds evenly across communities.
- The observed consolidation phase suggests that later policy should focus on removing remaining barriers inside already-contaminated clusters rather than chasing new distant sites.
- If contagion range contracts because social ties saturate locally, similar dynamics may appear in other infrastructure adoptions such as water pumps or mobile money agents in rural settings.
Load-bearing premise
Observed clustering of new installations around older ones is caused by social influence transmitted through physical proximity rather than by shared local conditions or simultaneous access to installers and subsidies.
What would settle it
A dataset that records exact installer identities, subsidy program participation, and local topography for each community would show whether clustering persists after those factors are controlled for, or whether the temporal decay in contagion effects vanishes.
Figures


read the original abstract
In traditional rural societies, where social ties are embedded in physical space, the diffusion of emerging technologies may be amplified through socio-spatial contagion (SSC). Such processes may play a key role in accelerating residential PV adoption in off-grid regions. Yet empirical evidence on SSC in PV adoption remains largely limited to affluent, grid-connected settings, while off-grid regions often lack systematic installation records. To address these gaps, we use a deep learning segmentation model to extract PV installations from a decade-long series of remote sensing imagery across 507 off-grid settlement clusters (hereafter, communities). This enables data-driven spatio-temporal point pattern inference of SSC in data-scarce contexts. SSC is quantified through the range and intensity of clustering of new installations around prior adopters, and the dynamics of these dimensions are linked to adoption outcomes. We found that SSC is nearly ubiquitous, often spanning most of the community's spatial extent, while exhibiting substantial heterogeneity in intensity. Although SSC intensifies over time, its effects remain temporally concentrated, peaking within 1 to 2 years of nearby installations and weakening thereafter. SSC intensity is positively associated with adoption rates in both cross-sectional and temporal analyses. However, the relationship between SSC range and adoption changes over time - in early diffusion phases, adoption growth is associated with range expansion, whereas in later phases it is associated with range contraction. This shift reflects a transition from clustering to consolidation of installations. These findings highlight the potential of seeding interventions to accelerate PV diffusion in off-grid regions.
Editorial analysis
A structured set of objections, weighed in public.
Referee Report
Summary. The paper uses deep learning segmentation on a decade of remote sensing imagery to detect PV installations across 507 off-grid communities. It defines socio-spatial contagion (SSC) via the range and intensity of spatial clustering of new installations around prior adopters, then links these metrics to adoption rates. Key results include near-ubiquitous SSC with heterogeneous intensity, positive associations between SSC intensity and adoption in both cross-sectional and temporal models, and a phase-dependent range effect: early diffusion links adoption growth to range expansion while later phases link it to range contraction, interpreted as a shift from clustering to consolidation. The work concludes that seeding interventions could accelerate diffusion in data-scarce off-grid settings.
Significance. If the reported associations can be attributed to socio-spatial contagion rather than spatial confounders, the findings would provide rare empirical evidence on diffusion processes in off-grid rural contexts where administrative records are absent. The remote-sensing approach enables scalable, longitudinal analysis of 507 communities and introduces data-driven point-pattern metrics for SSC that could inform targeted policy interventions. The temporal distinction between expansion and consolidation phases adds a dynamic element not commonly quantified in prior adoption studies.
major comments (3)
- [Methods] Methods, deep learning segmentation: No validation metrics (precision, recall, F1, or pixel-level error rates on held-out imagery) or ground-truth comparison are reported for the segmentation model. Since all SSC range/intensity calculations and adoption counts derive directly from these detections, unquantified false positives or negatives could systematically bias the clustering statistics and the subsequent associations.
- [Results] Results, SSC-adoption regressions: The positive association between SSC intensity and adoption rates, and the time-varying range effect, are estimated without spatial fixed effects, community-level covariates for topography or infrastructure, matched controls, or any other identification strategy. This leaves open the possibility that observed clustering reflects time-invariant or time-varying shared factors (e.g., local water sources, simultaneous installer access, or subsidy eligibility) rather than socio-spatial contagion.
- [Methods] Methods, SSC quantification: The range and intensity metrics rely on an unspecified spatial clustering distance cutoff and segmentation threshold (both listed as free parameters). No sensitivity analyses or robustness checks to alternative cutoffs or clustering algorithms are presented, yet these choices directly determine the reported temporal shift from expansion to contraction.
minor comments (2)
- [Abstract] The abstract states SSC is 'nearly ubiquitous' and 'often spanning most of the community's spatial extent' but provides no quantitative breakdown (e.g., percentage of communities or average coverage fraction) to support these descriptors.
- [Methods] Notation for SSC range and intensity is introduced descriptively without formal equations or explicit algorithmic definitions, making it difficult to assess reproducibility or compare with standard point-pattern statistics such as Ripley's K or pair-correlation functions.
Simulated Author's Rebuttal
We thank the referee for their thoughtful and constructive comments on our manuscript. We have carefully considered each point and provide detailed responses below. Where appropriate, we will revise the manuscript to incorporate additional validation metrics, robustness checks, and clarifications to strengthen the analysis.
read point-by-point responses
-
Referee: [Methods] Methods, deep learning segmentation: No validation metrics (precision, recall, F1, or pixel-level error rates on held-out imagery) or ground-truth comparison are reported for the segmentation model. Since all SSC range/intensity calculations and adoption counts derive directly from these detections, unquantified false positives or negatives could systematically bias the clustering statistics and the subsequent associations.
Authors: We agree that reporting validation metrics is essential for transparency. In the revised manuscript, we will include precision, recall, F1 scores, and pixel-level accuracy metrics evaluated on a held-out set of imagery. We will also describe the ground-truth labeling process, which involved manual annotation of PV panels in a subset of images by domain experts. This will allow readers to assess the reliability of the detections used for SSC metrics. revision: yes
-
Referee: [Results] Results, SSC-adoption regressions: The positive association between SSC intensity and adoption rates, and the time-varying range effect, are estimated without spatial fixed effects, community-level covariates for topography or infrastructure, matched controls, or any other identification strategy. This leaves open the possibility that observed clustering reflects time-invariant or time-varying shared factors (e.g., local water sources, simultaneous installer access, or subsidy eligibility) rather than socio-spatial contagion.
Authors: We acknowledge the challenge of causal identification in this observational setting with limited administrative data. Our temporal models exploit within-community variation over time to mitigate time-invariant confounders. In revision we will add community fixed effects, include available covariates such as community size and geographic characteristics, and expand the discussion to explicitly address potential spatial confounders. We will interpret the associations as correlational evidence consistent with SSC rather than claiming strict causality, and add lagged-variable robustness checks. revision: partial
-
Referee: [Methods] Methods, SSC quantification: The range and intensity metrics rely on an unspecified spatial clustering distance cutoff and segmentation threshold (both listed as free parameters). No sensitivity analyses or robustness checks to alternative cutoffs or clustering algorithms are presented, yet these choices directly determine the reported temporal shift from expansion to contraction.
Authors: We will revise the methods section to explicitly state the specific distance cutoff and segmentation threshold used in the main analysis. We will add a new appendix with sensitivity analyses varying the cutoff distances and alternative clustering methods such as DBSCAN with different parameters. These checks will demonstrate that the key findings on the temporal shift from expansion to consolidation are robust to these choices. revision: yes
Circularity Check
No significant circularity in derivation chain
full rationale
The paper computes SSC range and intensity directly from spatial point patterns of PV installations extracted via remote sensing across the time series. These metrics are then correlated with independently measured adoption rates in cross-sectional and temporal analyses. No equations, definitions, or self-citations reduce the reported associations or the expansion-to-contraction transition to tautological inputs or fitted parameters renamed as predictions. The chain remains observational and data-driven without self-referential reductions.
Axiom & Free-Parameter Ledger
free parameters (2)
- deep-learning segmentation threshold
- spatial clustering distance cutoff
axioms (2)
- domain assumption Detected panel locations accurately reflect actual installations without systematic false positives or negatives that vary by community.
- domain assumption Spatial proximity proxies for social influence in traditional rural societies.
Lean theorems connected to this paper
-
IndisputableMonolith/Foundation/AlexanderDuality.leanalexander_duality_circle_linking unclearSSC is quantified through the range and intensity of clustering of new installations around prior adopters... using the spatio-temporal Ripley’s K function... L(r, τ) = √(K(r, τ)/π) − r
-
IndisputableMonolith/Cost/FunctionalEquation.leanwashburn_uniqueness_aczel unclearSSC intensity index (CI) ... positive association with adoption rates... transition from range expansion to contraction
Reference graph
Works this paper leans on
-
[1]
Aarakit, S., Kimbugwe, F. and Nuwamanya, J. Household adoption of solar home systems in rural uganda: Insights from qualitative interviews.Energy Research & Social Science, 74 (2021) 101968
work page 2021
-
[2]
Akter, S., Rahman, M. M. and Alam, K. Determinants of adoption of off-grid solar technologies in rural areas.Energy for Sustainable Development, 62 (2021) 39–48
work page 2021
-
[3]
Arnold, F., Jeddi, S. and Sitzmann, A. How prices guide investment decisions under net purchasing—an empirical analysis on the impact of network tariffs on residential pv.Energy Economics, 112 (2022) 106177
work page 2022
-
[4]
B.,Increasing returns and path dependence in the econ- omy, University of Michigan Press, 1994
Arthur, W. B.,Increasing returns and path dependence in the econ- omy, University of Michigan Press, 1994
work page 1994
-
[5]
Bala,V.andGoyal,S.Learningfromneighbours.ReviewofEconomic Studies, 65 (1998) 595–621
work page 1998
-
[6]
Balta-Ozkan, N. et al. Energy transition at local level: Analyzing the role of peer effects and socio-economic factors on uk solar photovoltaic deployment.Energy Policy, 148 (2021) 112004
work page 2021
-
[7]
Bandiera,O.andRasul,I.Socialnetworksandtechnologyadoptionin northern mozambique.The Economic Journal, 116 (2006) 869–902
work page 2006
-
[8]
Barnes, J. L., Krishen, A. S. and Chan, A. Passive and active peer effectsinthespatialdiffusionofresidentialsolarpanels:Acasestudy of the las vegas valley.Journal of Cleaner Production, 363 (2022) 132634
work page 2022
-
[9]
Barton-Henry, K., Wenz, L. and Levermann, A. Decay radius of climate decision for solar panels in the city of fresno, usa.Scientific Reports, 11 (2021) 8571
work page 2021
-
[10]
Bass, F. M. A new product growth for model consumer durables. Management Science, 15 (1969) 215–227
work page 1969
-
[11]
Best,R.,Marrone,M.andLinnenluecke,M.Meta-analysisoftherole of equity dimensions in household solar panel adoption.Ecological Economics, 206 (2023) 107754
work page 2023
-
[12]
Blushtein-Livnon, R. et al. On the effectiveness of textual prompting with lightweight fine-tuning for sam3 remote sensing segmentation. IEEE Geoscience and Remote Sensing Letters, (2026)
work page 2026
- [13]
-
[14]
Bollinger, B. and Gillingham, K. Peer effects in the diffusion of solar photovoltaic panels.Marketing Science, 31 (2012) 900–912
work page 2012
-
[15]
Bollinger, B. et al. Visibility and peer influence in durable good adoption.Marketing Science, 41 (2022) 453–476
work page 2022
-
[16]
Bramoullé, Y., Djebbari, H. and Fortin, B. Peer effects in networks: A survey.Annual Review of Economics, 12 (2020) 603–629
work page 2020
-
[17]
Carion, N. et al. Sam 3: Segment anything with concepts.arXiv preprint arXiv:2511.16719, (2025)
work page internal anchor Pith review Pith/arXiv arXiv 2025
-
[18]
Centola, D. and Macy, M. Complex contagions and the weakness of long ties.American Journal of Sociology, 113 (2007) 702–734
work page 2007
-
[19]
Chanda,H.etal.Theafricancleanenergy–deforestationparadox:Ex- amining the sustainability trade-offs of rural solar energy expansion in zambia.Energy Research & Social Science, 129 (2025) 104389
work page 2025
-
[20]
Conley, T. G. and Udry, C. R. Learning about a new technology: Pineapple in ghana.American Economic Review, 100 (2010) 35–69
work page 2010
-
[21]
Contreras, J. D. et al. Racial and ethnic disparities in access to safe water and sanitation in high-income countries: a case study among thearab-bedouinsofsouthernisrael.JournalofWater,Sanitationand Hygiene for Development, 13 (2023) 611–624
work page 2023
-
[22]
Housing Policy Debate, 30 (2020) 1016–1032
Danso-Wiredu,E.Y.andPoku,A.Familycompoundhousingsystem losing its value in ghana: A threat to future housing of the poor. Housing Policy Debate, 30 (2020) 1016–1032
work page 2020
-
[23]
URL:https://www.worldbank.org, license: CC BY 3.0 IGO
ESMAP, GOGLA and Dalberg, Off-grid solar market trends report 2024, 2024. URL:https://www.worldbank.org, license: CC BY 3.0 IGO
work page 2024
-
[24]
Fu, J. et al. Study on adaptive parameter determination of cluster analysisinurbanmanagementcases.TheInternationalArchivesofthe Photogrammetry, Remote Sensing and Spatial Information Sciences, 42 (2017) 1143–1150
work page 2017
-
[25]
GOGLA, Global off-grid solar market report: Sales and impact data (h22022),2023.URL:https://www.gogla.org,accessedMonthYear
work page 2023
-
[26]
Graham,B.S.Identifyingandestimatingneighborhoodeffects.Jour- nal of Economic Literature, 56 (2018) 450–500
work page 2018
-
[27]
Threshold models of collective behaviour.American journal of sociology, 83 (1978) 1420–1443
Granovetter, M. Threshold models of collective behaviour.American journal of sociology, 83 (1978) 1420–1443
work page 1978
-
[28]
Graziano, M., Fiaschetti, M. and Atkinson-Palombo, C. Peer effects in the adoption of solar energy technologies in the united states: An urban case study.Energy Research & Social Science, 48 (2019) 75– 84
work page 2019
-
[29]
Graziano,M.andGillingham,K.Spatialpatternsofsolarphotovoltaic system adoption: The influence of neighbors and the built environ- ment.Journal of Economic Geography, 15 (2015) 815–839
work page 2015
-
[30]
Gu, J. Importance of neighbors in rural households’ conversion to cleaner cooking fuels: The impact and mechanisms of peer effects. Journal of Cleaner Production, 379 (2022) 134776
work page 2022
-
[31]
Haliru, A. and Adamu, A. Expanding energy access in rural off-grid communities:astudyonhouseholdadoptionandaffordabilityofsolar home systems in kwara state, nigeria.Journal of Global Economics and Business October, 3 (2022) 181–201. Blushtein-Livnon et al.:Preprint Page 16 of 18 Socio-Spatial Contagion Dynamics in Off-Grid PV Adoption
work page 2022
-
[32]
Hartmann, W. R. et al. Modeling social interactions: Identification, empirical methods and policy implications.Marketing letters, 19 (2008) 287–304
work page 2008
-
[33]
Hendricks, K. E., Christman, M. and Roberts, P. D. Spatial and temporal patterns of commercial citrus trees affected by phyllosticta citricarpa in florida.Scientific Reports, 7 (2017) 1641
work page 2017
-
[34]
Herrera, M., Armelini, G. and Salvaj, E. Understanding social conta- gion in adoption processes using dynamic social networks.PloS one, 10 (2015) e0140891
work page 2015
-
[35]
Hohl, A. et al. Accelerating the discovery of space-time patterns of infectious diseases using parallel computing.Spatial and spatio- temporal epidemiology, 19 (2016) 10–20
work page 2016
-
[36]
Ibegbulam, M., Adeyemi, O. and Fogbonjaiye, O. Adoption of solar pvindevelopingcountries:challengesandopportunity.International Journal of Physical Sciences Research, 7 (2023) 36–57
work page 2023
-
[37]
URL: https://www.iea.org/reports/renewables-2024
IEA, Renewables 2024: Analysis and forecast to 2030, 2024. URL: https://www.iea.org/reports/renewables-2024
work page 2024
-
[38]
IEA, Access to electricity stagnates, leaving globally 730 million in thedark,2025.URL:https://www.iea.org/commentaries/access-to-e lectricity-stagnates-leaving-globally-730-million-in-the-dark, accessed: 2025-11-13
work page 2025
-
[39]
URL:https://trackingsdg7.esmap.org, joint report of the SDG 7 custodian agencies
IEA et al., Tracking sdg 7: The energy progress report 2025, 2025. URL:https://trackingsdg7.esmap.org, joint report of the SDG 7 custodian agencies
work page 2025
-
[40]
et al.,Statistical analysis and modelling of spatial point patterns, John Wiley & Sons, 2008
Illian, J. et al.,Statistical analysis and modelling of spatial point patterns, John Wiley & Sons, 2008
work page 2008
-
[41]
URL:https: //www.irena.org, statistics update
IRENA, Off-grid renewable energy highlights, 2024. URL:https: //www.irena.org, statistics update
work page 2024
-
[42]
IRENAetal.,Trackingsdg7:Theenergyprogressreport,2025.URL: https://trackingsdg7.esmap.org
work page 2025
-
[43]
Jacksohn, A. et al. Drivers of renewable technology adoption in the household sector.Energy Economics, 81 (2019) 216–226
work page 2019
-
[44]
Jones, C. et al. House screening for malaria control: views and experiences of participants in the roo pf s trial.Malaria journal, 21 (2022) 294
work page 2022
-
[45]
Kattan, E., Halasah, S. and Abu Hamed, T. Practical challenges of photovoltaic systems in the rural bedouin villages in the negev.J Fundam Renewable Energy Appl, 8 (2018) 2
work page 2018
-
[46]
Kizilcec, V., Parikh, P. and Bisaga, I. Examining the journey of a pay-as-you-go solar home system customer: a case study of rwanda. Energies, 14 (2021) 330
work page 2021
-
[47]
Kosfeld, R., Eckey, H.-F. and Lauridsen, J. Spatial point pattern analysis and industry concentration.The Annals of Regional Science, 47 (2011) 311–328
work page 2011
-
[48]
Nursing research, 51 (2002) 404–410
Kwak,C.andClayton-Matthews,A.Multinomiallogisticregression. Nursing research, 51 (2002) 404–410
work page 2002
-
[49]
Lee, J., Chapter 5: Spatiotemporal ripley’s k and l functions, in: Spatiotemporal Analytics, CRC Press, 2023, pp. 77–89
work page 2023
-
[50]
Lemaire,X.Solarhomesystemsandsolarlanternsinruralareasofthe global south: What impact?Wiley Interdisciplinary Reviews: Energy and Environment, 7 (2018) e301
work page 2018
-
[51]
Lengyel, B. et al. The role of geography in the complex diffusion of innovations.Scientific reports, 10 (2020) 15065
work page 2020
-
[52]
Li, L., Lu, N. and Qin, J. Joint-task learning framework with scale adaptive and position guidance modules for improved household rooftop photovoltaic segmentation in remote sensing image.Applied Energy, 377 (2025) 124521
work page 2025
-
[53]
Liu, D. et al. Blood and soil: How kinship and geographic proximity drive rooftop photovoltaic adoption in rural china.Energy Research & Social Science, 131 (2026) 104481
work page 2026
-
[54]
Mahieu, A. et al. Can off-grid household solar provide sustainable energy for all? adoption and sustained use of solar technologies in malawi.Energy Research & Social Science, 127 (2025) 104249
work page 2025
-
[55]
Mahn, D., Kammen, D. M. and Hirth, L. What drives solar energy adoption in developing countries? evidence from household-level data.Energy Economics, 138 (2024) 107924
work page 2024
-
[56]
Marchetti, C. Society as a learning system: discovery, invention, and innovation cycles revisited.Technological forecasting and social change, 18 (1980) 267–282
work page 1980
-
[57]
Matuschke,I.andQaim,M.Theimpactofsocialnetworksonhybrid seed adoption in india.Agricultural Economics, 40 (2009) 493–505
work page 2009
-
[58]
Min, Y. Spatial dynamics of low-carbon transitions: Peer effects and disadvantaged communities in solar energy, electric vehicle, and heat pump adoption in the united states.Energy Research & Social Science, 121 (2025) 103981
work page 2025
-
[59]
Morrissey, K. and Scheller, F. It takes a village: The role of com- munity attributes in shaping solar photovoltaic adoption intention in germany.Renewable Energy, 237 (2024) 121542
work page 2024
-
[60]
Nankabirwa, J. I. et al. The uganda housing modification study- association between housing characteristics and malaria burden in a moderatetohightransmissionsettinginuganda.MalariaJournal,23 (2024) 223
work page 2024
-
[61]
Oliva,E.J.D.andAtehortuaSantamaria,R.Decodingsolaradoption: Asystematicreviewoftheoriesandfactorsofphotovoltaictechnology adoption in households of developing countries.Sustainability, 17 (2025) 5494
work page 2025
-
[62]
Opiyo, N. N. Impacts of neighbourhood influence on social accep- tance of small solar home systems in rural western kenya.Energy Research & Social Science, 52 (2019) 91–98
work page 2019
-
[63]
O’Shaughnessy, E., Grayson, A. and Barbose, G. The role of peer influence in rooftop solar adoption inequity in the united states. Energy Economics, 127 (2023) 107009
work page 2023
-
[64]
Putra, A. R. S. and Pedersen, S. M. Biogas technology diffusion among farmers through rural communication network: A case from indonesia.Journal of Rural and Community Development, 13 (2018) 107–117
work page 2018
-
[65]
Rai, V. and Robinson, S. A. Effective information channels for re- ducingcostsofenvironmentally-friendlytechnologies:evidencefrom residential pv markets.Environmental Research Letters, 8 (2013) 014044
work page 2013
-
[66]
Rode, J. and Müller, S. I spot, i adopt! peer effects and visibility in solar photovoltaic system adoption of households. (2020)
work page 2020
-
[67]
Rogers, E. M., Singhal, A. and Quinlan, M. M., Diffusion of innovations, in:Anintegratedapproachtocommunicationtheoryand research, Routledge, 2014, pp. 432–448
work page 2014
-
[68]
Saha,S.K.Empoweringruralsouthasia:Off-gridsolarpv,electricity accessibility,andsustainableagriculture.AppliedEnergy,359(2025) 122137
work page 2025
- [69]
-
[70]
Shapira, S., Shibli, H. and Teschner, N. Energy insecurity and com- munity resilience: The experiences of bedouins in southern israel. Environmental Science & Policy, 124 (2021) 135–143
work page 2021
-
[71]
Simpson, N. P. et al. Adoption rationales and effects of off-grid re- newableenergyaccessforafricanyouth:Acasestudyfromtanzania. Renewable and Sustainable Energy Reviews, 141 (2021) 110793
work page 2021
-
[72]
Sokołowski, J. Peer effects on photovoltaics (pv) adoption and air quality spillovers in poland.Energy Economics, 125 (2023) 106808
work page 2023
-
[73]
Tamir, K., Urmee, T. and Pryor, T. Issues of small-scale renewable energy systems installed in rural soum centres in mongolia.Energy for Sustainable Development, 27 (2015) 1–9
work page 2015
-
[74]
Teschner, N., Said, H. and Shapira, S. Energy poverty and ethnic disparitiesamongjewishandmuslimhouseholdsinisrael:Theimpli- cations for welfare systems.Energy Research & Social Science, 116 (2024) 103689
work page 2024
-
[75]
Teschner, N. et al. Extreme energy poverty in the urban peripheries of romania and israel: Policy, planning and infrastructure.Energy Research & Social Science, 66 (2020) 101502
work page 2020
-
[76]
Tetteh, E. Determinants of off-grid solar photovoltaic adoption in ruralhouseholds.EnergyforSustainableDevelopment,68(2022)48– 57
work page 2022
-
[77]
Tsoeu-Ntokoane, S., Kali, M. and Lemaire, X. Transitioning to cleaner solutions and moving away from precautionary energy stack- ing in lesotho households.Discover Energy, 5 (2025) 1–16. Blushtein-Livnon et al.:Preprint Page 17 of 18 Socio-Spatial Contagion Dynamics in Off-Grid PV Adoption
work page 2025
-
[78]
vandenWallBake,K.etal.Solarpvandcleancookstovetechnology diffusionsystems: Fourcasestudies fromsub-saharanafrica.Renew- able Energy, 240 (2025) 122201
work page 2025
-
[79]
Modelling dynamical processes in complex socio- technical systems.Nature physics, 8 (2012) 32–39
Vespignani, A. Modelling dynamical processes in complex socio- technical systems.Nature physics, 8 (2012) 32–39
work page 2012
-
[80]
Vrandečić,D.andKrötzsch,M.Wikidata:afreecollaborativeknowl- edgebase.Communications of the ACM, 57 (2014) 78–85
work page 2014
discussion (0)
Sign in with ORCID, Apple, or X to comment. Anyone can read and Pith papers without signing in.