Recognition: 2 theorem links
· Lean TheoremAdaptive discovery of effect modification in matched observational studies
Pith reviewed 2026-05-12 02:57 UTC · model grok-4.3
The pith
A finite-sample valid procedure identifies covariate-interpretable subgroups showing different treatment effects in matched observational studies while exactly controlling the subgroup false discovery rate and bounding unmeasured bias via a
A machine-rendered reading of the paper's core claim, the machinery that carries it, and where it could break.
Core claim
We develop a finite-sample valid procedure for identifying and selecting covariate-interpretable subgroups, with exact control of the subgroup-level false discovery rate (FDR). Our method explicitly accounts for unmeasured confounding via sensitivity models, and leverages multiple matched controls to improve statistical power. We demonstrate the favorable performance of our method relative to baseline methods through extensive simulation studies and a real-world application to the economic returns to college education.
What carries the argument
An adaptive selection rule that tests for effect modification on matched data using sensitivity-adjusted statistics, then applies a step-down threshold to achieve exact finite-sample FDR control at the subgroup level.
If this is right
- Researchers obtain a list of subgroups with heterogeneous treatment effects whose false discovery rate is guaranteed not to exceed the target in finite samples.
- Results remain valid under any unmeasured confounding whose strength stays inside the pre-specified sensitivity parameters.
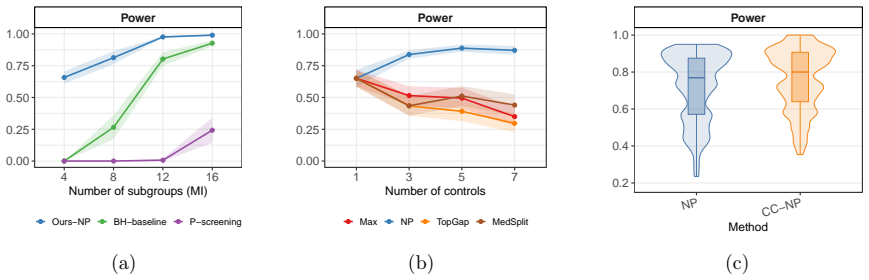
- Multiple matched controls per treated unit raise power to detect true effect modification compared with one-to-one matching.
- The same framework can be applied to policy questions such as identifying demographic groups that receive larger economic returns to college.
Where Pith is reading between the lines
- If the sensitivity parameters are set too loosely, the procedure may still select subgroups whose effects are driven by hidden bias.
- The method could be paired with data-driven subgroup search algorithms to handle high-dimensional covariates.
- In practice, analysts would need to report the sensitivity parameters alongside the selected subgroups so readers can judge the robustness claim.
- The college-education application suggests the procedure can surface subgroups defined by observable demographics that show meaningfully different returns.
Load-bearing premise
The chosen sensitivity models correctly bound the possible impact of unmeasured confounding and the initial matching on observed covariates is adequate for those bounds to be meaningful.
What would settle it
In a simulation where true effect-modifying subgroups are planted and the magnitude of unmeasured confounding is set within the sensitivity bounds, the proportion of falsely selected subgroups exceeds the nominal FDR level.
Figures


read the original abstract
Understanding effect modification -- how treatment effects vary across subpopulations -- is practically important in observational studies, as it helps identify which subgroups are likely to benefit from a given treatment. In this paper, we study the discovery of effect modification in matched observational studies, where each treated unit may be matched to multiple controls. We develop a finite-sample valid procedure for identifying and selecting covariate-interpretable subgroups, with exact control of the subgroup-level false discovery rate (FDR). Our method explicitly accounts for unmeasured confounding via sensitivity models, and leverages multiple matched controls to improve statistical power. We demonstrate the favorable performance of our method relative to baseline methods through extensive simulation studies and a real-world application to the economic returns to college education.
Editorial analysis
A structured set of objections, weighed in public.
Referee Report
Summary. The paper develops a finite-sample valid procedure for adaptive discovery of effect modification in matched observational studies with multiple controls per treated unit. It claims to identify covariate-interpretable subgroups while achieving exact control of the subgroup-level false discovery rate (FDR), explicitly incorporating sensitivity models (e.g., Rosenbaum-style bounds) for unmeasured confounding, with supporting evidence from simulations and a real-data analysis of economic returns to college education.
Significance. If the finite-sample FDR guarantees hold under the stated sensitivity models, the work would offer a useful advance for causal inference in observational settings by enabling data-driven subgroup selection with rigorous error control and improved power from multiple matches. The emphasis on covariate-interpretable subgroups and the empirical demonstrations via simulations and the college-education application are practical strengths that could aid applied researchers.
major comments (2)
- [§3 (Theoretical Results), main FDR theorem] The central claim of exact finite-sample FDR control (abstract and §3) relies on the sensitivity model correctly bounding unmeasured confounding for the matched design. However, because subgroup selection is adaptive and data-dependent, the null distribution for the FDR threshold may no longer be valid post-selection; the manuscript should explicitly show (e.g., via the proof of the main theorem) that the procedure preserves the required stochastic dominance or exchangeability properties despite this adaptivity.
- [§4 (Simulations), Table 2] Table 2 and the simulation design in §4 report power gains from multiple controls, but do not include cases with sensitivity-parameter misspecification (e.g., true confounding exceeding the assumed Γ). This is load-bearing for the practical interpretation of the 'exact control' guarantee, as the skeptic note correctly flags that under-bounding voids the null distribution.
minor comments (2)
- [§2 (Setup)] Notation for the sensitivity parameter Γ and the multiple-control matching ratio is introduced late; defining these in §2 would improve readability for readers new to Rosenbaum bounds.
- [§5 (Application)] The real-data application section would benefit from a brief table summarizing the selected subgroups and their estimated effects under the chosen Γ.
Simulated Author's Rebuttal
We thank the referee for their constructive and detailed comments. We address each major point below and outline the revisions we will make to strengthen the manuscript.
read point-by-point responses
-
Referee: [§3 (Theoretical Results), main FDR theorem] The central claim of exact finite-sample FDR control (abstract and §3) relies on the sensitivity model correctly bounding unmeasured confounding for the matched design. However, because subgroup selection is adaptive and data-dependent, the null distribution for the FDR threshold may no longer be valid post-selection; the manuscript should explicitly show (e.g., via the proof of the main theorem) that the procedure preserves the required stochastic dominance or exchangeability properties despite this adaptivity.
Authors: We agree that the impact of adaptive, data-dependent subgroup selection on the validity of the finite-sample FDR guarantee merits explicit treatment. The proof of the main theorem in §3 establishes control by showing that the sensitivity-bounded test statistics for candidate subgroups satisfy uniform stochastic dominance under the null, with the selection rule being a monotone function of these statistics within the fixed matched design. This structure preserves the necessary exchangeability properties for the step-down threshold. In the revised manuscript we will add a dedicated lemma immediately preceding the main theorem that isolates and proves this preservation step, making the argument fully explicit. revision: yes
-
Referee: [§4 (Simulations), Table 2] Table 2 and the simulation design in §4 report power gains from multiple controls, but do not include cases with sensitivity-parameter misspecification (e.g., true confounding exceeding the assumed Γ). This is load-bearing for the practical interpretation of the 'exact control' guarantee, as the skeptic note correctly flags that under-bounding voids the null distribution.
Authors: The referee is correct that the current simulation design assumes the sensitivity parameter Γ is at least as large as the true confounding strength. To address this, the revised §4 will include new simulation scenarios in which the true level of unmeasured confounding exceeds the assumed Γ. We will report the realized subgroup-level FDR in these misspecified cases, thereby illustrating the practical consequences of under-bounding and clarifying the scope of the exact-control guarantee. revision: yes
Circularity Check
No circularity: procedure is a constructed method with independent finite-sample guarantees
full rationale
The paper constructs a new adaptive procedure for subgroup selection with exact FDR control under sensitivity models for unmeasured confounding. The derivation chain begins from the matched design and sensitivity bounds (treated as given inputs) and produces a data-dependent selection rule whose validity is proved directly via finite-sample arguments rather than by fitting parameters to the target quantities or by self-referential definitions. No equations reduce the claimed FDR control to a fitted input or to a prior result whose only justification is self-citation. The use of multiple controls is a power-enhancing feature of the design, not a circular re-use of the same data. The method is therefore self-contained against external benchmarks once the sensitivity model is accepted as an assumption.
Axiom & Free-Parameter Ledger
axioms (1)
- domain assumption Sensitivity models can be used to bound unmeasured confounding in matched designs
Lean theorems connected to this paper
-
IndisputableMonolith/Foundation/RealityFromDistinction.leanreality_from_one_distinction unclearWe develop a finite-sample valid procedure for identifying and selecting covariate-interpretable subgroups, with exact control of the subgroup-level false discovery rate (FDR). Our method explicitly accounts for unmeasured confounding via sensitivity models...
-
IndisputableMonolith/Cost/FunctionalEquation.leanwashburn_uniqueness_aczel unclearUnder the Γ-sensitivity model... P(Lg=1|Vg,Wg,F,Z)≤κ·P(Lg=−1|Vg,Wg,F,Z) with κ bounded by Γ.
Reference graph
Works this paper leans on
-
[1]
Andrews, R. J., Imberman, S. A., Lovenheim, M. F., and Stange, K. (2024). The returns to college major choice: Average and distributional effects, career trajectories, and earnings variability. Review of Economics and Statistics, pages 1–45. Armstrong, T. and Shen, S. (2015). Inference on optimal treatment assignments.The Japanese Economic Review, 74(4):4...
work page 2024
-
[2]
Baum, S. (2014). Higher education earnings premium: Value, variation, and trends.Urban Institute. Bekerman, W., Dalal, A., del Ninno, C., and Small, D. S. (2024). Planning for gold: Sample splitting for valid powerful design of observational studies.arXiv preprint arXiv:2406.00866. Benjamini, Y.andHochberg, Y.(1995). Controllingthefalsediscoveryrate: apra...
-
[3]
Candès, E., Fan, Y., Janson, L., and Lv, J. (2018). Panning for gold:‘model-x’knockoffs for high dimensional controlled variable selection.Journal of the Royal Statistical Society Series B: Sta- tistical Methodology, 80(3):551–577. Chao, P. and Fithian, W. (2021). Adapt-gmm: Powerful and robust covariate-assisted multiple testing.arXiv preprint arXiv:2106...
-
[4]
Duan, B., Ramdas, A., and Wasserman, L. (2020). Familywise error rate control by interactive unmasking. InInternational Conference on Machine Learning, pages 2720–2729. PMLR. Duan, B., Ramdas, A., and Wasserman, L. (2022). Interactive rank testing by betting. InConference on Causal Learning and Reasoning, pages 201–235. PMLR. Duan, B., Wasserman, L., and ...
-
[5]
Lee, J. and Ren, Z. (2024). Boosting e-bh via conditional calibration.arXiv preprint arXiv:2404.17562. Lee, K., Small, D. S., Hsu, J. Y., Silber, J. H., and Rosenbaum, P. R. (2018). Discovering effect modification in an observational study of surgical mortality at hospitals with superior nursing. Journal of the Royal Statistical Society Series A: Statisti...
-
[6]
Lei, L., Ramdas, A., and Fithian, W. (2021). A general interactive framework for false discovery rate control under structural constraints.Biometrika, 108(2):253–267. Li, M. L. and Imai, K. (2023). Statistical performance guarantee for subgroup identification with generic machine learning.arXiv preprint arXiv:2310.07973. Lipkovich, I., Svensson, D., Ratit...
-
[7]
Perna, L. W. (2005). The benefits of higher education: Sex, racial/ethnic, and socioeconomic group differences.The Review of Higher Education, 29(1):23–52. Reeve, H. W., Cannings, T. I., and Samworth, R. J. (2023). Optimal subgroup selection.The Annals of Statistics, 51(6):2342–2365. Ren, Z. and Candes, E. (2023). Knockoffs with side information.The Annal...
work page internal anchor Pith review arXiv 2005
-
[8]
P g∈H0,G 1{g/∈ Oτ(L,Ξ), L g = 1} 1∨ P g′∈G 1{g′ /∈ Oτ(L,Ξ), L g′ = 1} # =E
and heterogeneous treatment-effect discovery in program and policy evaluation(AtheyandImbens,2016). Identifyingsubgroupsfromdataisthefirstemergingquestion. There is a rich literature on learning subgroups from data, in particular on tree-based methods, including the CART algorithm (Su et al., 2009; Breiman et al., 2017), causal trees (Athey and Imbens, 20...
work page 2016
-
[9]
Lettingp i =P(L i = 1| F,Z)andp ∗ = Γ 1+Γ, we define ∆g = P i∈g ri(pi −p ∗) P i∈g r2 i p∗(1−p ∗) 1/2
Given an observed Wilcoxon signed-rankstatisticS obs g , thedeterministicandrandomizedone-sidedp-valuesundertheΓ-sensitivity model are pg =P X i∈g riL∗ i ≥S obs g ! , p rand g =P X i∈g riL∗ i > S obs g ! +U·P X i∈g riL∗ i =S obs g ! ,(24) where the probability is overL∗ i iid∼Bern( Γ 1+Γ)andU∼Unif(0,1)is an independent tie-breaking variable. Lettingp i =P...
work page 1971
-
[10]
Define the events E+ = β(J, ˜R, X)>0 andE − = β(J, ˜R, X)<0
+E 1{˜L= 1} ·(P(L=−1| J, ˜R, X)−P(L= 1| J, ˜R, X)) ,(29) where the last step follows from the fact that˜Lis a function ofJ, ˜R, Xand the tower property. Define the events E+ = β(J, ˜R, X)>0 andE − = β(J, ˜R, X)<0 . 33 We then have (29)=P(L= 1)−E h 1{˜L= 1,E +} · P(L= 1| J, ˜R, X)−P(L=−1| J, ˜R, X) i +E h 1{˜L= 1,E −} · P(L= 1| J, ˜R, X)−P(L=−1| J, ˜R, X) ...
work page 2024
-
[11]
for subgroup selection. C.2 Screening by incorporating additional information In our framework, the sign-magnitude pair is used in a disentangled way: the sign is used for FDP estimation, while the magnitude determines the screening ordering. For FDR control, the magnitude statistic is subject to essentially no restriction beyond a near-independence condi...
work page 2015
-
[12]
Figure 8: Boxplots of FDR and power for comparison with and without conditional calibration
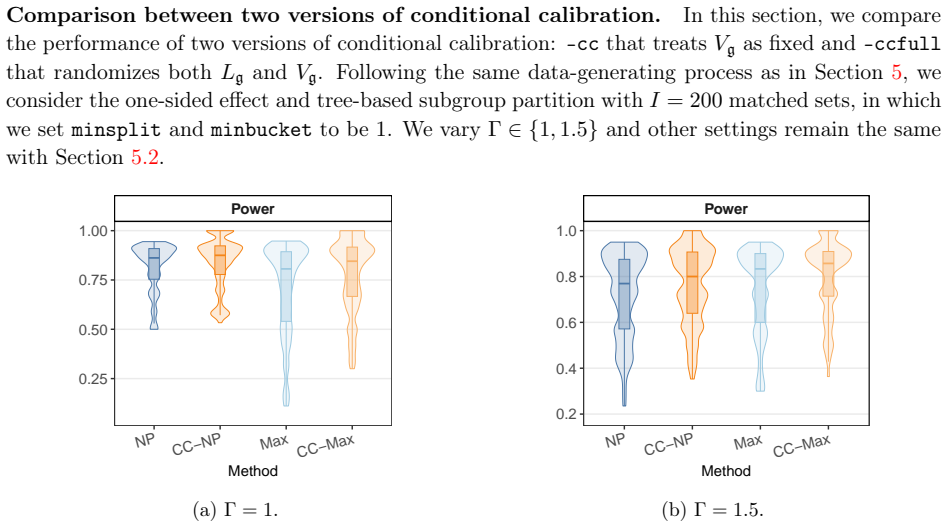
Power NP CC−NP Max CC−Max 0.2 0.4 0.6 0.8 1.0 Method (b)Γ = 1.5. Figure 8: Boxplots of FDR and power for comparison with and without conditional calibration. From Figure 8, we can see that bothOurs-cc-NPandOurs-ccfull-NPimprove upon the power ofOurs-NPin these two settings. In the first setting, without sensitivity adjustment, conditional calibration is l...
work page 2021
-
[13]
num_sib sibsttNumber of siblings rural_res res57 Residential area of graduate. Degree of urbanization (Counties with no city or with a city of less than 50,000) prox_college avcl57 Geographic availability of college (High school in community≤15 miles from any college) class_rank hsrscorqHigh school grades percentile rank-normalized IQ gwiiq_j IQ score map...
work page 1993
-
[14]
We preprocess the WLS data prior to matching and inference: observations with incomplete treatment coding (treatment value−2) are recoded as untreated. We exclude individuals with extreme parental income values by removing observations withparents_income≥998, and recode intactas a binary indicator of family intactness. Parents’ income is log-transformed t...
work page 2011
-
[15]
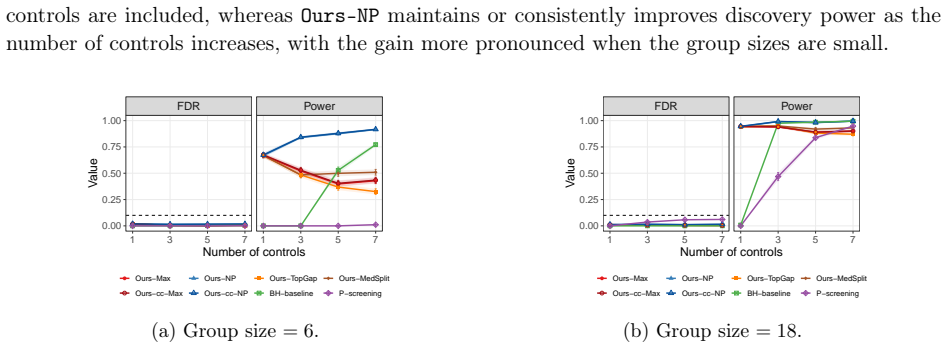
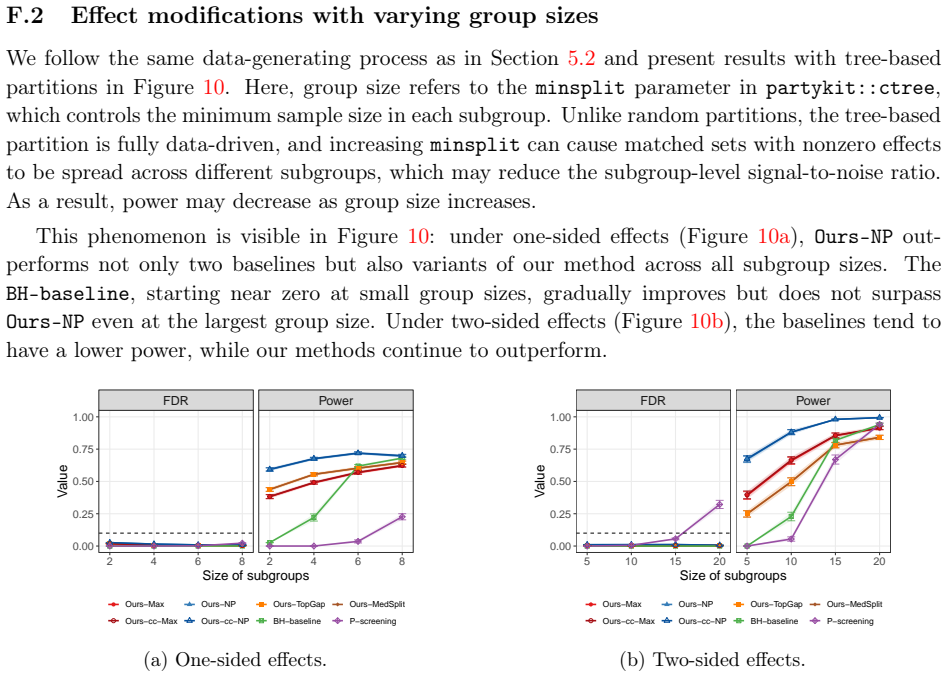
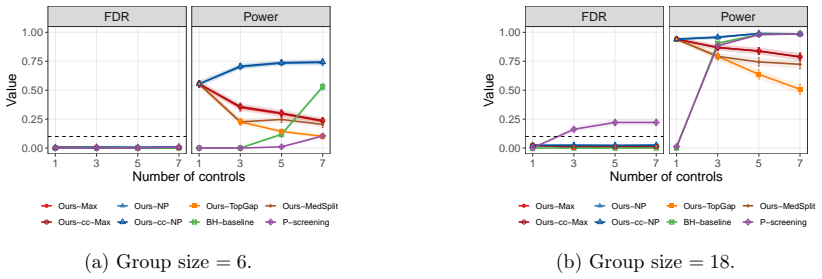
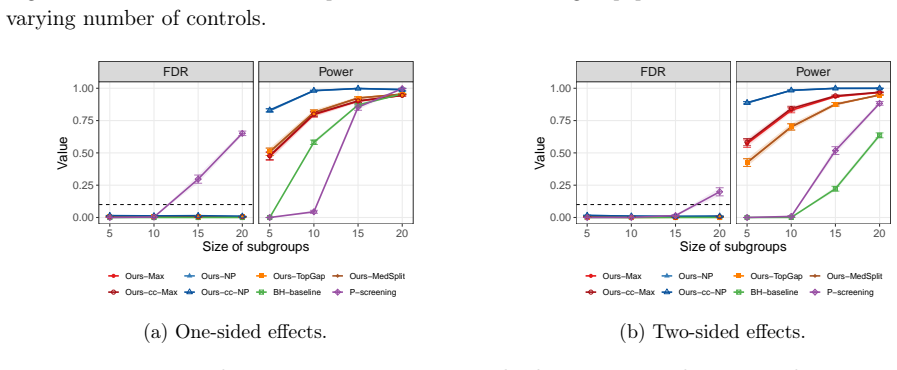
Under one-sided effects (Figure 13a),Ours-NPachieves power above0.8 at small group sizes, and theBH-baselineimproves with group size but plateaus well below our methods. Under two-sided effects (Figure 13b), the baselines, theBH-baselineandP-screening, are substantially weaker, while our methods maintain high discovery power. F.5 Additional simulations wi...
work page 2095
discussion (0)
Sign in with ORCID, Apple, or X to comment. Anyone can read and Pith papers without signing in.