Recognition: no theorem link
HI absorption in MHONGOOSE -- Spin temperatures and cold neutral medium in nearby disk galaxies
Pith reviewed 2026-05-12 04:51 UTC · model grok-4.3
The pith
Combined emission-absorption measurements of neutral hydrogen extend to galaxies 7-22 Mpc away, yielding CNM spin temperatures that match Local Group values.
A machine-rendered reading of the paper's core claim, the machinery that carries it, and where it could break.
Core claim
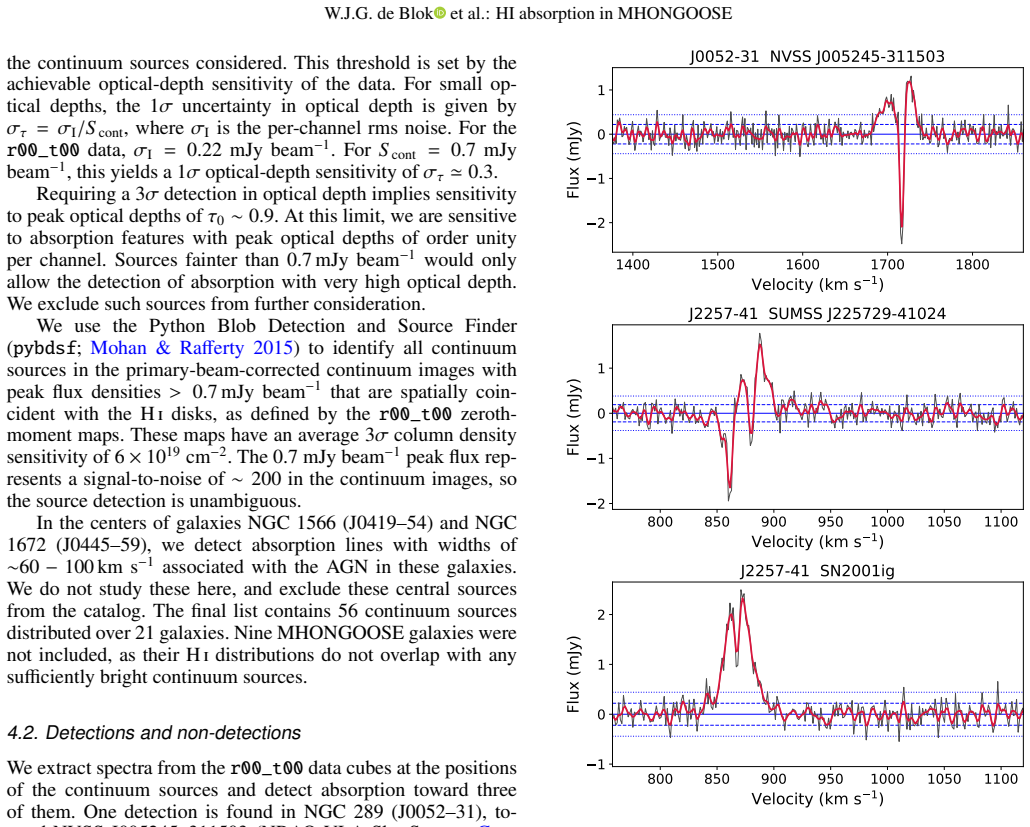
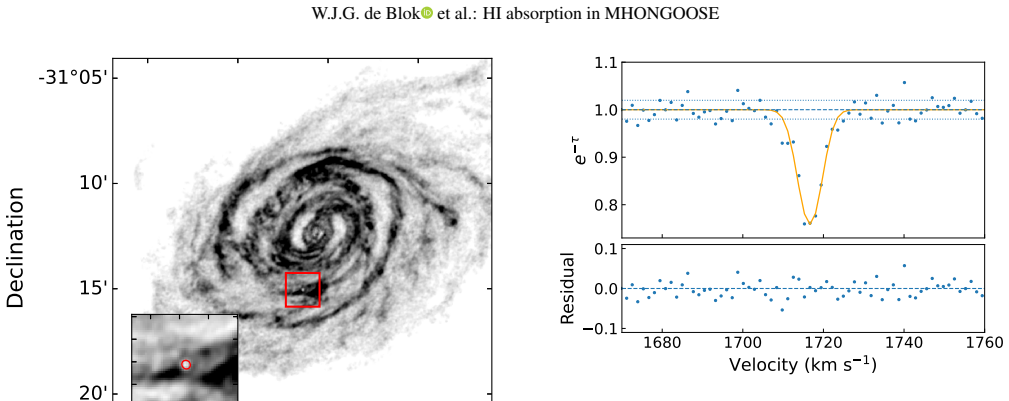
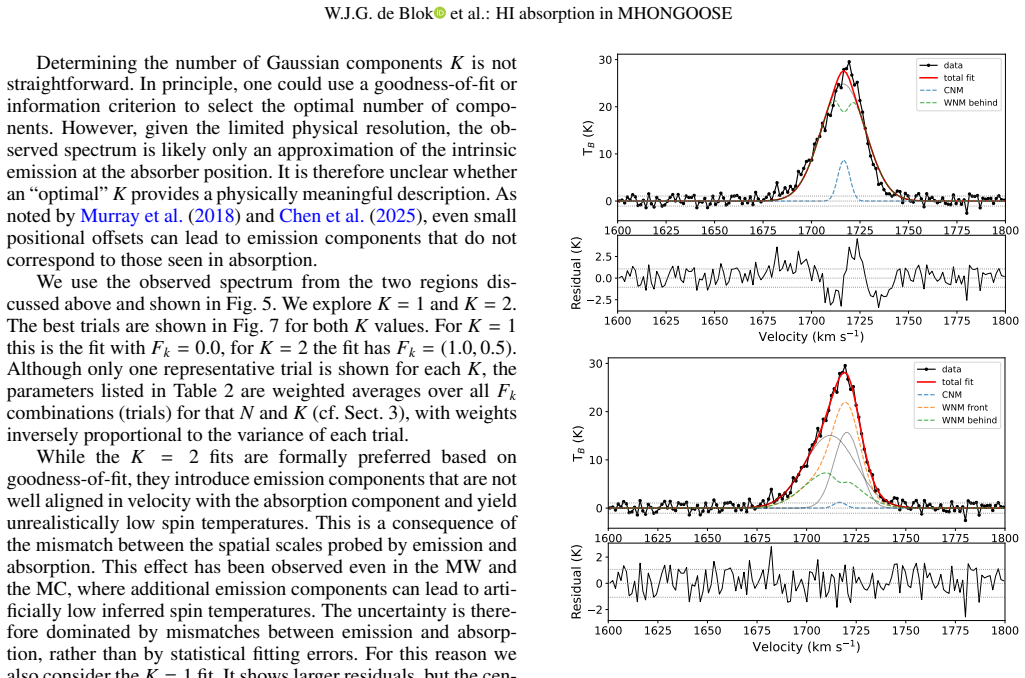
The paper reports detections of HI absorption in the disks of NGC 289 and NGC 7424. Paired modeling of absorption and emission spectra gives CNM spin temperatures and line widths similar to Local Group measurements. Inferred CNM fractions are lower, due to the emission data averaging over several hundred parsecs and thereby reducing the relative contribution of structured cold gas compared to the smoother warm neutral medium. This establishes that such analyses can be extended beyond the Local Group when care is taken with representative emission spectra.
What carries the argument
The combined HI emission-absorption analysis using optical depth from absorption against continuum sources paired with emission to derive spin temperature and CNM fraction.
Load-bearing premise
The detected absorption is physically associated with the galaxies' HI disks rather than unrelated gas, and emission spectra accurately represent conditions along the absorption sight lines despite large beam sizes.
What would settle it
Obtaining higher resolution emission observations that eliminate the dilution effect and yield CNM fractions matching Local Group measurements, or showing absorption velocities that do not align with the target galaxies' rotation curves.
Figures


read the original abstract
Combined HI emission-absorption studies constrain the spin temperature and phase structure of the neutral atomic hydrogen interstellar medium (ISM), but have largely been limited to the Milky Way and the Local Group. We extend this technique to galaxies at distances of 7-22 Mpc using deep data from the MeerKAT HI Observations of Nearby Galactic Objects - Observing Southern Emitters (MHONGOOSE) survey, and quantify the detection fraction and Cold Neutral Medium (CNM) properties at these distances. We search for HI absorption toward 56 background continuum sources in 21 out of the 30 MHONGOOSE galaxies (with nine galaxies lacking suitable background sources), and detect absorption associated with the galaxies' HI disks in three cases: one sight line in NGC 289 and two in NGC 7424. This corresponds to detection rates of 3/56 (5 percent) for the full sample and 3/31 (10 percent) for a clean sub-sample of sight lines, considering only unresolved background sources behind 14 low-inclination galaxies. Detections occur only where both the continuum flux and the foreground \HI column density are high, with optical-depth sensitivity as the primary limiting factor. For the detected sight lines, we model the absorption and emission spectra to derive spin temperatures and CNM fractions using the standard combined emission-absorption method. The CNM spin temperatures and line widths are comparable to Local Group measurements, but the inferred CNM fractions are systematically lower. We argue that this difference is primarily a resolution effect: at the distances of our galaxies, the emission spectra average over several hundred parsecs, diluting structured CNM relative to the smoother Warm Neutral Medium (WNM). This demonstrates that emission-absorption analyses can be extended beyond the Local Group, provided that care is taken in constructing representative emission spectra.
Editorial analysis
A structured set of objections, weighed in public.
Referee Report
Summary. The manuscript extends combined HI emission-absorption analyses beyond the Local Group to 21 MHONGOOSE galaxies at 7-22 Mpc. It reports HI absorption detections associated with the target disks in three sightlines (one in NGC 289, two in NGC 7424) out of 56 background continuum sources, corresponding to a 5% detection rate overall and 10% in a clean sub-sample. Spin temperatures and CNM fractions are derived via the standard modeling approach; temperatures and line widths match Local Group values, but CNM fractions are lower and interpreted as a resolution effect arising from beam-averaged emission spectra diluting clumpy CNM relative to smoother WNM.
Significance. If the interpretation holds, the result is significant because it shows the emission-absorption technique can be applied at extragalactic distances, potentially enabling statistical studies of neutral ISM phases in larger galaxy samples. The detections themselves are valuable and the standard method is applied directly, but the small number of sightlines and the resolution-effect claim limit the immediate impact.
major comments (3)
- [Abstract] Abstract: the claim that CNM fractions are 'systematically lower' is central to the resolution-effect interpretation, yet the abstract supplies no quantitative values, uncertainties, or details on how the emission spectra were made representative of the absorption sightlines. This makes the strength of the result difficult to assess from the summary alone.
- [Discussion] Discussion: the central claim that lower CNM fractions reflect beam dilution (rather than differences in ISM conditions) rests on the assumption that the MeerKAT beam-averaged emission spectra sample the same phase structure as the pencil-beam absorption. At 7-22 Mpc the beam smooths over hundreds of parsecs where CNM is known to be clumpy; without beam-convolved simulations to quantify the bias, the attribution remains untested and directly affects whether the technique has been successfully extended.
- [Results] Results: detections occur in only three sightlines. The paper should demonstrate that the comparison to Local Group CNM fractions is robust against selection effects, including the definition of the 'clean sub-sample' of 31 sightlines and any optical-depth or continuum-flux biases that could preferentially detect certain phases.
minor comments (3)
- [Abstract] Abstract: add quantitative ranges or error bars for the derived spin temperatures and CNM fractions to make the summary self-contained.
- [Methods] Methods: provide additional detail or a figure illustrating how the emission spectra were extracted and averaged to ensure they are representative of the absorption sightlines.
- [Introduction] Introduction: verify that all key Local Group CNM references used for the comparison are cited.
Simulated Author's Rebuttal
We thank the referee for their constructive and detailed review of our manuscript. We have revised the paper to address the major comments, providing additional quantitative details, clarifications on sample selection, and a more nuanced discussion of the resolution effects. Our point-by-point responses follow.
read point-by-point responses
-
Referee: [Abstract] Abstract: the claim that CNM fractions are 'systematically lower' is central to the resolution-effect interpretation, yet the abstract supplies no quantitative values, uncertainties, or details on how the emission spectra were made representative of the absorption sightlines. This makes the strength of the result difficult to assess from the summary alone.
Authors: We agree that the abstract would benefit from quantitative support for the CNM fraction claim. In the revised manuscript, we have updated the abstract to report the specific CNM fractions (ranging from ~12% to 28% across the three sightlines, with typical uncertainties of ±8%), contrasted against Local Group values of ~40-60%. We also briefly describe the emission spectra as beam-averaged extractions centered on the absorption positions with velocity integration matched to the detected absorption components. This makes the key result more assessable from the abstract alone. revision: yes
-
Referee: [Discussion] Discussion: the central claim that lower CNM fractions reflect beam dilution (rather than differences in ISM conditions) rests on the assumption that the MeerKAT beam-averaged emission spectra sample the same phase structure as the pencil-beam absorption. At 7-22 Mpc the beam smooths over hundreds of parsecs where CNM is known to be clumpy; without beam-convolved simulations to quantify the bias, the attribution remains untested and directly affects whether the technique has been successfully extended.
Authors: The referee rightly notes that our interpretation relies on the known small-scale clumpiness of the CNM without direct quantification via simulations. We have expanded the Discussion section to include explicit calculations of the physical beam sizes (typically 200-600 pc at the sample distances), additional references to prior work on CNM structure and beam dilution effects, and a clear statement that the matching spin temperatures and linewidths to Local Group values support similar underlying conditions. We have also added a caveat acknowledging that full beam-convolved simulations would provide a stronger test and represent an important direction for future work. While we maintain the resolution effect as the most plausible explanation, we have softened the language to reflect the interpretive nature of the attribution. revision: partial
-
Referee: [Results] Results: detections occur in only three sightlines. The paper should demonstrate that the comparison to Local Group CNM fractions is robust against selection effects, including the definition of the 'clean sub-sample' of 31 sightlines and any optical-depth or continuum-flux biases that could preferentially detect certain phases.
Authors: We have added a dedicated paragraph and accompanying table in the Results section to define the clean sub-sample explicitly: the 31 sightlines are those with unresolved continuum sources (to avoid confusion) behind galaxies with inclinations below 60 degrees (to ensure the line of sight probes the disk). We discuss potential biases, noting that detections require both high continuum flux and sufficient HI column density for measurable optical depth, which could in principle favor denser, CNM-rich regions. However, the fact that we still recover systematically lower CNM fractions despite this potential bias strengthens the resolution-effect argument. We also compare the sensitivity limits and probed column densities to those in Local Group absorption studies to show the samples are comparable. These additions demonstrate that the comparison is robust against the identified selection effects. revision: yes
Circularity Check
No significant circularity; results derived from standard method on new data
full rationale
The paper applies the established emission-absorption modeling technique to fresh MHONGOOSE observations, deriving spin temperatures and CNM fractions directly from the three detected sightlines via spectral fitting. Detection rates, optical-depth limits, and the resolution-effect interpretation for lower CNM fractions are presented as empirical findings and comparisons to independent Local Group literature, without any equation reducing a claimed prediction back to a fitted input or self-citation by construction. The derivation remains self-contained against external benchmarks.
Axiom & Free-Parameter Ledger
axioms (2)
- domain assumption The spin temperature derived from the emission-absorption ratio represents a harmonic mean along the line of sight that can be interpreted as a CNM temperature when absorption is detected.
- domain assumption Background continuum sources are unresolved and lie behind the galaxy HI disk with no significant contribution from unrelated gas.
Reference graph
Works this paper leans on
-
[1]
Allison, J. R., Sadler, E. M., Amaral, A. D., et al. 2022, PASA, 39, e010
work page 2022
- [2]
- [3]
-
[4]
Carilli, C. L. & van Gorkom, J. H. 1992, ApJ, 399, 373
work page 1992
- [5]
-
[6]
Condon, J. J., Cotton, W. D., Greisen, E. W., et al. 1998, AJ, 115, 1693 de Blok, W. J. G., Healy, J., Maccagni, F. M., et al. 2024, A&A, 688, A109
work page 1998
-
[7]
Dempsey, J., McClure-Griffiths, N. M., Murray, C., et al. 2022, PASA, 39, e034
work page 2022
- [8]
-
[9]
Dickey, J. M. & Brinks, E. 1988, MNRAS, 233, 781
work page 1988
-
[10]
Dickey, J. M. & Brinks, E. 1993, ApJ, 405, 153
work page 1993
-
[11]
Dickey, J. M., Brinks, E., & Puche, D. 1992, ApJ, 385, 501
work page 1992
-
[12]
Dickey, J. M. & Lockman, F. J. 1990, ARA&A, 28, 215
work page 1990
-
[13]
Dickey, J. M., McClure-Griffiths, N. M., Gaensler, B. M., & Green, A. J. 2003, ApJ, 585, 801
work page 2003
-
[14]
M., Mebold, U., Stanimirovic, S., & Staveley-Smith, L
Dickey, J. M., Mebold, U., Stanimirovic, S., & Staveley-Smith, L. 2000, ApJ, 536, 756
work page 2000
-
[15]
Dutta, R., Gupta, N., Srianand, R., & O’Meara, J. M. 2016, MNRAS, 456, 4209
work page 2016
-
[16]
Field, G. B., Goldsmith, D. W., & Habing, H. J. 1969, ApJ, 155, L149
work page 1969
-
[17]
2016, in MeerKAT Science: On the Pathway to the SKA, 14
Gupta, N., Srianand, R., Baan, W., et al. 2016, in MeerKAT Science: On the Pathway to the SKA, 14
work page 2016
-
[18]
Gupta, N., Srianand, R., Bowen, D. V ., York, D. G., & Wadadekar, Y . 2010, MNRAS, 408, 849
work page 2010
- [19]
-
[20]
2019, The DSA-2000 – A Radio Survey Camera
Hallinan, G., Ravi, V ., Weinreb, S., et al. 2019, The DSA-2000 – A Radio Survey Camera
work page 2019
-
[21]
Heywood, I. 2020, oxkat: Semi-automated imaging of MeerKAT observations, Astrophysics Source Code Library, record ascl:2009.003
work page 2020
-
[22]
Jameson, K. E., McClure-Griffiths, N. M., Liu, B., et al. 2019, ApJS, 244, 7
work page 2019
- [23]
- [24]
-
[25]
Kanekar, N., Prochaska, J. X., Ellison, S. L., & Chengalur, J. N. 2009, MNRAS, 396, 385
work page 2009
-
[26]
Killerby-Smith, N., McClure-Griffiths, N. M., Murray, C. E., & Stanimirovi´c, S. 2025, MNRAS, 538, 2508
work page 2025
-
[27]
Koch, E. W., Leroy, A. K., Rosolowsky, E. W., et al. 2025, ApJS, 279, 35
work page 2025
- [28]
-
[29]
Lane, W. M. 2000, PhD thesis, University of Groningen, Netherlands
work page 2000
-
[30]
Leroy, A. K., Sandstrom, K. M., Lang, D., et al. 2019, ApJS, 244, 24
work page 2019
-
[31]
M., Morganti, R., Oosterloo, T
Maccagni, F. M., Morganti, R., Oosterloo, T. A., Geréb, K., & Maddox, N. 2017, A&A, 604, A43
work page 2017
-
[32]
Maina, E. K., Mohapatra, A., Józsa, G. I. G., et al. 2022, MNRAS, 516, 2050
work page 2022
- [33]
-
[34]
M., Stanimirovi´c, S., & Rybarczyk, D
McClure-Griffiths, N. M., Stanimirovi´c, S., & Rybarczyk, D. R. 2023, ARA&A, 61, 19
work page 2023
-
[35]
Meurer, G. R., Hanish, D. J., Ferguson, H. C., et al. 2006, ApJS, 165, 307
work page 2006
- [36]
-
[37]
Mohan, N. & Rafferty, D. 2015, PyBDSF: Python Blob Detection and Source
work page 2015
- [38]
-
[39]
E., Stanimirovi´c, S., Goss, W
Murray, C. E., Stanimirovi´c, S., Goss, W. M., et al. 2015, ApJ, 804, 89
work page 2015
-
[40]
E., Stanimirovi´c, S., Goss, W
Murray, C. E., Stanimirovi´c, S., Goss, W. M., et al. 2018, ApJS, 238, 14
work page 2018
-
[41]
E., Stanimirovi´c, S., Heiles, C., et al
Murray, C. E., Stanimirovi´c, S., Heiles, C., et al. 2021, ApJS, 256, 37
work page 2021
-
[42]
Patra, N. N., Kanekar, N., Chengalur, J. N., & Roy, N. 2018, MNRAS, 479, L7
work page 2018
-
[43]
M., Chen, H., Stanimirovi´c, S., et al
Pingel, N. M., Chen, H., Stanimirovi´c, S., et al. 2024, ApJ, 974, 93
work page 2024
-
[44]
Reeves, S. N., Sadler, E. M., Allison, J. R., et al. 2015, MNRAS, 450, 926
work page 2015
-
[45]
Reeves, S. N., Sadler, E. M., Allison, J. R., et al. 2016, MNRAS, 457, 2613
work page 2016
-
[46]
Ryder, S. D., Murrowood, C. E., & Stathakis, R. A. 2006, MNRAS, 369, L32
work page 2006
-
[47]
Ryder, S. D., Sadler, E. M., Subrahmanyan, R., et al. 2004, MNRAS, 349, 1093
work page 2004
- [48]
-
[49]
Serra, P., Koribalski, B., Kilborn, V ., et al. 2015, MNRAS, 452, 2680
work page 2015
-
[50]
Smith, R. J., Tress, R., Soler, J. D., et al. 2023, MNRAS, 524, 873
work page 2023
-
[51]
D., Miville-Deschênes, M.-A., Molinari, S., et al
Soler, J. D., Miville-Deschênes, M.-A., Molinari, S., et al. 2022, A&A, 662, A96
work page 2022
- [52]
-
[53]
Soria, R., Kuncic, Z., Broderick, J. W., & Ryder, S. D. 2006, MNRAS, 370, 1666
work page 2006
-
[54]
Stanimirovic, S., Staveley-Smith, L., Dickey, J. M., Sault, R. J., & Snowden, S. L. 1999, MNRAS, 302, 417
work page 1999
-
[55]
J., Böker, T., Charlot, S., et al
Walcher, C. J., Böker, T., Charlot, S., et al. 2006, ApJ, 649, 692
work page 2006
-
[56]
Walsh, W., Staveley-Smith, L., & Oosterloo, T. 1997, AJ, 113, 1591
work page 1997
-
[57]
Wolfire, M. G., Hollenbach, D., McKee, C. F., Tielens, A. G. G. M., & Bakes, E. L. O. 1995, ApJ, 443, 152
work page 1995
-
[58]
Wolfire, M. G., McKee, C. F., Hollenbach, D., & Tielens, A. G. G. M. 2003, ApJ, 587, 278
work page 2003
-
[59]
Yahil, A. & Vidal, N. V . 1977, ApJ, 214, 347 Article number, page 16 of 17 W.J.G. de Blok et al.: HI absorption in MHONGOOSE Appendix A: The brightest non-detections Here we present the spectra of the non-detections towards the 14 brightest continuum sources listed in Table 1. The detection spectra are given in Fig. 1. 250 300 350 400 450 500 Velocity (k...
work page 1977
discussion (0)
Sign in with ORCID, Apple, or X to comment. Anyone can read and Pith papers without signing in.