Recognition: no theorem link
The Balance between Nuance and Clarity: Decluttering Tabular Sequential Graphs to Counter Money Laundering
Pith reviewed 2026-05-12 04:58 UTC · model grok-4.3
The pith
Grouping transactions by amount and timing reduces clutter in sequential graphs used for money laundering analysis, with a user study showing that simpler reductions are not always the most useful.
A machine-rendered reading of the paper's core claim, the machinery that carries it, and where it could break.
Core claim
The authors propose tabular sequential graphs that follow transaction sequences row by row by bank and introduce three explicit grouping methods—amount-based, time-based, and combined amount-and-order—to declutter them. Their expert user study demonstrates that greater node reduction does not automatically improve analytical value and that more granular versions trade off extra manual effort against longer interpretation time.
What carries the argument
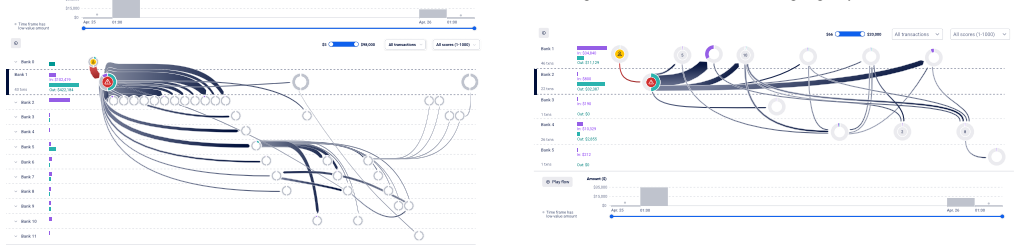
Tabular sequential graph with rows as banks and the three grouping methods (amount-based, time-based, combined amount-and-order) that merge nodes and edges while preserving transaction sequences.
If this is right
- Analysts gain a clearer overview of money flows with fewer elements to examine manually.
- The combined grouping method provides a middle path that reduces clutter without fully sacrificing sequence information.
- More granular graphs increase the time needed for interpretation even though they reduce the need for additional manual grouping steps.
- Daily alert investigation benefits from choosing groupings that match the required level of pattern visibility rather than maximum simplification.
Where Pith is reading between the lines
- The same decluttering approach could be adapted to visualize other sequential transaction problems such as fraud rings or sanctions evasion.
- Tools built on these methods might benefit from letting analysts switch groupings on the fly based on the specific alert under review.
- The observed trade-off implies that visualization systems for investigative work should measure both reduction metrics and task completion time rather than reduction alone.
- Larger studies with analysts from different institutions could test whether the preference patterns hold beyond the original participants.
Load-bearing premise
The grouping methods keep enough transaction details intact for accurate money laundering detection and the expert participants' preferences represent typical operational needs.
What would settle it
A controlled test where analysts using each grouped version fail to detect known laundering chains that remain visible only in the ungrouped graph.
Figures


read the original abstract
Money laundering is not only about moving illicit funds, but about hiding the money's origin and traces to complicate detection. Financial criminals resort to many methods to avoid regulators and legal thresholds. But analysts investigating alerts, dedicated to pin mule accounts and track suspicious transactions daily, also have theirs. Network visualizations can be key in countering adversarial money laundering activities, especially if they provide a clear overview of the money flows and a seamless analysis experience, but they are often not structured for this type of task. That is why we propose a tabular sequential graph visualization tailored to money laundering analysis - following transactions (edges) from the victim account that triggered an alert through multiple accounts (nodes) and banks (rows). To reduce the number of nodes and edges, we propose three methods for grouping these tabular sequential graphs: an amount-based approach, a time-based approach, and a combined solution that considers both the transaction amount and its order. A user study with experts revealed that the most effective method in node reduction was not necessarily the most interesting for analysis and that there is a trade-off between manual work and time for interpretation in more granular graphs.
Editorial analysis
A structured set of objections, weighed in public.
Referee Report
Summary. The paper proposes tabular sequential graphs to visualize money laundering transaction flows from an alert account through accounts and banks. It introduces three node-grouping methods (amount-based, time-based, and combined amount-and-order) to reduce clutter, and reports a user study with experts finding that the most effective reduction method is not necessarily the most analytically interesting, with a noted trade-off between manual effort and interpretation time in granular graphs.
Significance. If the groupings can be shown to retain laundering-relevant details and the user study is properly documented with objective metrics, the work could inform visualization design for financial analysts by addressing the nuance-clarity tension in sequential data. The focus on expert feedback in a real domain is a positive aspect.
major comments (2)
- [Abstract] Abstract and user study description: The central empirical claim (that the user study revealed a trade-off between node reduction effectiveness and analytical interest) is unsupported because no details are supplied on the number of experts, their qualifications, the specific tasks or graphs used, the metrics for 'effectiveness' and 'interest' (e.g., time, accuracy, Likert scores), or any statistical tests. This leaves the reported findings unverifiable and the main contribution unsubstantiated.
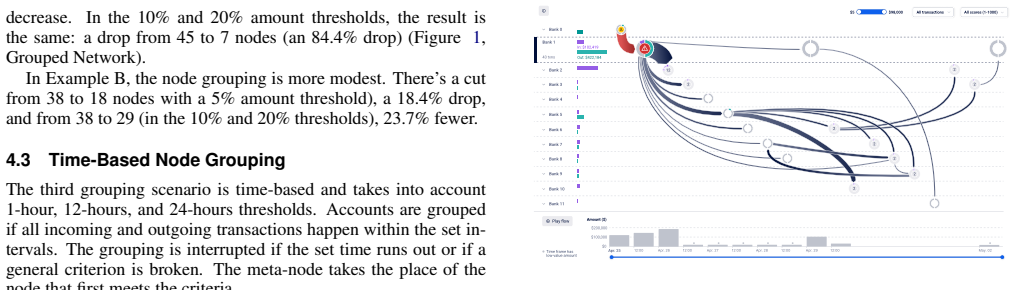
- [Grouping Methods] Grouping methods section: The three methods are introduced at a conceptual level without explicit algorithms, decision thresholds (e.g., amount similarity or time window criteria), or examples demonstrating preservation of sequential order, amounts, and bank rows. It is therefore impossible to verify whether critical anomalies (such as timing or value patterns used to trace mule accounts) are retained, which is load-bearing for the claim that the methods support accurate detection while reducing nodes.
minor comments (1)
- The abstract and introduction introduce specialized terms such as 'tabular sequential graph' and the three grouping methods without a concise definition or motivating example at first use; adding a short illustrative figure or paragraph would improve accessibility.
Simulated Author's Rebuttal
We thank the referee for the constructive feedback, which highlights important areas for improving the verifiability of our contributions. We address each major comment below and will revise the manuscript to provide greater detail and transparency.
read point-by-point responses
-
Referee: [Abstract] Abstract and user study description: The central empirical claim (that the user study revealed a trade-off between node reduction effectiveness and analytical interest) is unsupported because no details are supplied on the number of experts, their qualifications, the specific tasks or graphs used, the metrics for 'effectiveness' and 'interest' (e.g., time, accuracy, Likert scores), or any statistical tests. This leaves the reported findings unverifiable and the main contribution unsubstantiated.
Authors: We agree that the abstract is overly concise and does not provide enough information to substantiate the user-study claims. The full manuscript includes a dedicated user-study section with descriptions of the expert participants, tasks, and qualitative observations on the trade-off. To address the concern, we will expand the abstract to include key details (number of experts, their qualifications as financial analysts, tasks performed, metrics such as Likert-scale ratings for analytical interest and perceived effectiveness, and any statistical tests applied) and ensure the user-study section supplies complete, verifiable documentation of all elements. revision: yes
-
Referee: [Grouping Methods] Grouping methods section: The three methods are introduced at a conceptual level without explicit algorithms, decision thresholds (e.g., amount similarity or time window criteria), or examples demonstrating preservation of sequential order, amounts, and bank rows. It is therefore impossible to verify whether critical anomalies (such as timing or value patterns used to trace mule accounts) are retained, which is load-bearing for the claim that the methods support accurate detection while reducing nodes.
Authors: We acknowledge that the grouping-methods section remains at a high conceptual level. In the revision we will add explicit algorithmic descriptions, concrete decision thresholds (e.g., amount similarity within a defined percentage and time windows of a specified duration), pseudocode or step-by-step procedures, and worked examples that illustrate retention of sequential order, transaction amounts, and bank rows. These additions will allow readers to confirm that laundering-relevant patterns, such as timing and value anomalies for tracing mule accounts, are preserved. revision: yes
Circularity Check
No circularity: empirical user study with independent evaluation
full rationale
The paper proposes three grouping methods (amount-based, time-based, combined) for decluttering tabular sequential graphs and evaluates their effectiveness via a user study with domain experts. No mathematical derivations, equations, fitted parameters, or predictions are present that could reduce to inputs by construction. Claims about node reduction effectiveness and trade-offs between granularity and interpretability rest directly on the external user study results rather than any self-referential loop or self-citation chain. This is standard empirical HCI work with no load-bearing internal circularity.
Axiom & Free-Parameter Ledger
axioms (1)
- domain assumption Expert user feedback in a controlled study provides reliable signals about visualization utility for domain tasks
invented entities (4)
-
Tabular sequential graph
no independent evidence
-
Amount-based grouping method
no independent evidence
-
Time-based grouping method
no independent evidence
-
Combined amount-and-order grouping method
no independent evidence
Reference graph
Works this paper leans on
-
[1]
Cambridge Intelligence: data visualization technology. 2
-
[2]
DataWalk: Graph and AI-enabled Analysis, Intelligence and Investi- gation Platform. 2
-
[3]
Neo4j Graph Intelligence Platform, Apr. 2026. 2
work page 2026
-
[4]
B. Bach, N. H. Riche, C. Hurter, K. Marriott, and T. Dwyer. Towards Unambiguous Edge Bundling: Investigating Confluent Drawings for Network Visualization.IEEE transactions on visualization and com- puter graphics, 23(1):541–550, Jan. 2017. doi: 10.1109/TVCG.2016. 2598958 2
-
[5]
M. Balzer and O. Deussen. Level-of-detail visualization of clustered graph layouts. In2007 6th International Asia-Pacific Symposium on Visualization, pp. 133–140. IEEE, Sydney, NSW, Feb. 2007. doi: 10. 1109/APVIS.2007.329288 2
-
[6]
U. Brandes. Drawing on Physical Analogies. In G. Goos, J. Hart- manis, J. Van Leeuwen, M. Kaufmann, and D. Wagner, eds.,Draw- ing Graphs, vol. 2025, pp. 71–86. Springer Berlin Heidelberg, Berlin, Heidelberg, 2001. Series Title: Lecture Notes in Computer Science. doi: 10.1007/3-540-44969-8 4 1
-
[7]
A. Contreras and E. Villa P ´erez. Strategic choices in money launder- ing: Smurfing, layering, and financial over-diversification.Journal of Economic Criminology, 11:100199, Mar. 2026. doi: 10.1016/j.jeconc .2025.100199 1
-
[8]
W. Dong, X. Fu, G. Xu, and Y . Huang. An improved force-directed graph layout algorithm based on aesthetic criteria.Computing and Visualization in Science, 16(3):139–149, June 2013. doi: 10.1007/ s00791-014-0228-5 1
work page 2013
-
[9]
D. Edge, J. Larson, M. Mobius, and C. White. Trimming the Hairball: Edge Cutting Strategies for Making Dense Graphs Usable. In2018 IEEE International Conference on Big Data (Big Data), pp. 3951–
-
[10]
IEEE, Seattle, W A, USA, Dec. 2018. doi: 10.1109/BigData. 2018.8622521 2
-
[11]
B. E. Feliciano.Increasing Readability of Large Networks Visualiza- tions. PhD thesis, Instituto Superior T´ecnico, Universidade de Lisboa,
-
[12]
V . Filipov, A. Arleo, and S. Miksch. Are We There Yet? A Roadmap of Network Visualization from Surveys to Task Taxonomies.Com- puter Graphics Forum, 42(6):e14794, Sept. 2023. doi: 10.1111/cgf. 14794 2
work page doi:10.1111/cgf 2023
-
[13]
P. M. Gilmour. Reexamining the anti-money-laundering framework: a legal critique and new approach to combating money laundering. Journal of Financial Crime, 30(1):35–47, Mar. 2022. doi: 10.1108/ JFC-02-2022-0041 1
work page 2022
-
[14]
E. Halford, I. Gibson, M. Newfield, and M. Dhanwala. Developing a scoring model for managing money laundering transactions using machine learning.Journal of Money Laundering Control, 28(7):30– 49, Mar. 2025. doi: 10.1108/JMLC-09-2024-0152 1
-
[15]
W. Huang, P. Eades, and S.-H. Hong. Measuring Effectiveness of Graph Visualizations: A Cognitive Load Perspective.Information Vi- sualization, 8(3):139–152, Sept. 2009. Publisher: SAGE Publications. doi: 10.1057/ivs.2009.10 1
-
[16]
W. Huang, P. Eades, S.-H. Hong, and C.-C. Lin. Improving multiple aesthetics produces better graph drawings.Journal of Visual Lan- guages & Computing, 24(4):262–272, Aug. 2013. doi: 10.1016/j.jvlc .2011.12.002 1
-
[17]
H. C. Purchase, D. Carrington, and J.-A. Allder. Empirical Evaluation of Aesthetics-based Graph Layout.Empirical Software Engineering, 7(3):233–255, Sept. 2002. doi: 10.1023/A:1016344215610 2
-
[18]
B. Saket, P. Simonetto, S. Kobourov, and K. B ¨orner. Node, Node- Link, and Node-Link-Group Diagrams: An Evaluation.IEEE Trans- actions on Visualization and Computer Graphics, 20(12):2231–2240, Dec. 2014. doi: 10.1109/TVCG.2014.2346422 2
-
[19]
S. Shadrooh and K. Nørv ˚ag. SMoTeF: Smurf money laundering de- tection using temporal order and flow analysis.Applied Intelligence, 54(15):7461–7478, Aug. 2024. doi: 10.1007/s10489-024-05545-4 1
-
[20]
B. Shneiderman and C. Dunne. Interactive Network Exploration to Derive Insights: Filtering, Clustering, Grouping, and Simplification. In W. Didimo and M. Patrignani, eds.,Graph Drawing, pp. 2–18. Springer, Berlin, Heidelberg, 2013. doi: 10.1007/978-3-642-36763 -2 2 2
-
[21]
F. Teichmann. Recent trends in money laundering.Crime, Law and Social Change, 73(2):237–247, Mar. 2020. doi: 10.1007/s10611-019 -09859-0 1
-
[22]
C. Vehlow, F. Beck, and D. Weiskopf. Visualizing Group Structures in Graphs: A Survey.Computer Graphics Forum, 36(6):201–225, 2017. eprint: https://onlinelibrary.wiley.com/doi/pdf/10.1111/cgf.12872. doi: 10.1111/cgf.12872 2
-
[23]
Y . Wang, G. Baciu, and C. Li. Visualizing the Temporal Similarity Between Clusters of Dynamic Graphs. In2019 IEEE 18th Interna- tional Conference on Cognitive Informatics & Cognitive Computing (ICCI*CC), pp. 205–210, July 2019. doi: 10.1109/ICCICC46617. 2019.9146098 2
-
[24]
C. Ware and R. Bobrow. Motion to support rapid interactive queries on node–link diagrams.ACM Trans. Appl. Percept., 1(1):3–18, July
-
[25]
doi: 10.1145/1008722.1008724 1
discussion (0)
Sign in with ORCID, Apple, or X to comment. Anyone can read and Pith papers without signing in.