Recognition: no theorem link
Joint probabilistic inference of galaxy redshifts and rest-frame spectra from photometric fluxes with latent diffusion
Pith reviewed 2026-05-12 04:00 UTC · model grok-4.3
The pith
A latent diffusion model infers full photometric-redshift PDFs and rest-frame spectra directly from broadband galaxy fluxes.
A machine-rendered reading of the paper's core claim, the machinery that carries it, and where it could break.
Core claim
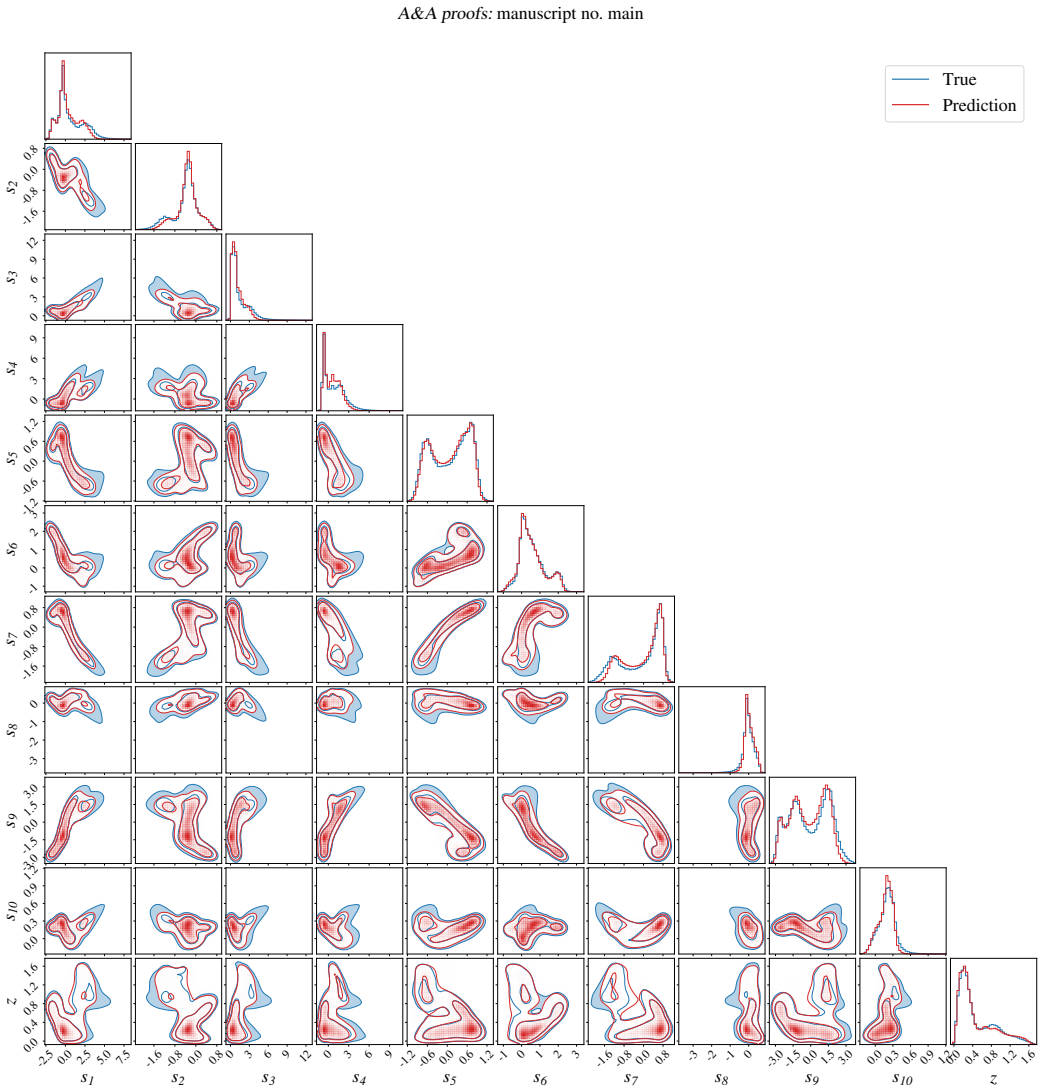
By pre-training an autoencoder on five million DESI spectra to obtain a compact latent representation of rest-frame galaxy spectra, then training a conditional diffusion model that takes broadband photometric fluxes as input and jointly outputs both a spectral latent vector and a photometric redshift, repeated sampling from the diffusion model produces a full redshift PDF per galaxy whose point estimates reach precision comparable to a gradient-boosted decision tree while the decoded spectra reproduce the continuum shape, capture prominent spectral features, and yield Dn4000 indices and residuals consistent with noise levels for high signal-to-noise objects.
What carries the argument
The conditional diffusion model that maps photometric fluxes to joint samples of spectral latent vectors and redshifts, decoded back to rest-frame spectra by the pre-trained autoencoder.
If this is right
- Redshift point estimates derived from the sampled PDFs match the precision of a gradient-boosted decision tree on the same photometry.
- Decoded rest-frame spectra reproduce the overall continuum and recover prominent emission and absorption features.
- For galaxies with high signal-to-noise spectra, the Dn4000 index measured on the reconstruction agrees with the index measured on the observed spectrum.
- Average residuals between reconstructed and observed spectra remain comparable to the observational noise floor.
- The method supplies a full probability density function rather than a single redshift value, enabling proper uncertainty propagation.
Where Pith is reading between the lines
- Large imaging catalogs could be turned into statistical samples of spectral properties such as star-formation histories or metallicity trends without requiring spectra for every object.
- Joint sampling of redshift and spectrum may reduce systematic biases that appear when redshift and spectral shape are estimated independently.
- The framework could be extended to incorporate additional photometric bands, time-domain data, or morphological information to tighten the redshift and spectral constraints.
- Galaxies whose inferred spectra show unusual features could be prioritized for spectroscopic follow-up to test the completeness of the latent space.
Load-bearing premise
The autoencoder's latent space learned from the spectroscopic training set contains a sufficiently complete and unbiased representation of every spectral variation that will appear in the photometric galaxies.
What would settle it
On a held-out set of galaxies that possess both photometry and high signal-to-noise spectra, the model's sampled redshift PDFs would fail if the true spectroscopic redshifts fall outside the 68 percent credible interval more often than expected, or if the average residuals between reconstructed and observed spectra exceed the measured noise level.
Figures


read the original abstract
Wide-field imaging surveys now provide photometry for billions of sources, while spectroscopic observations remain limited, motivating methods that can extract spectroscopic information from photometric data. We present a generative framework for the joint probabilistic inference of galaxy redshifts and rest-frame spectra from broadband photometric fluxes. The model provides a sampling-based estimate of the photometric-redshift probability density function (PDF) for each galaxy, from which accurate point estimates are derived, and reconstructs rest-frame spectra that preserve key spectral properties. We pre-train a spectral autoencoder, SPENDER, on 5 million DESI DR1 spectra to learn a low-dimensional latent space that represents rest-frame spectra. Conditioned on galaxy broadband photometric fluxes, a diffusion model jointly infers the corresponding spectral latent representation and photometric redshift. The inferred latent representation is decoded into a high-resolution rest-frame spectrum, which can be transformed to the observed frame by redshifting and resampling. Sampling from the conditional diffusion model yields a full photometric-redshift PDF for each galaxy, with the resulting point estimates showing a precision comparable to that of a gradient-boosted decision tree model. In most cases, the reconstructed rest-frame spectra reproduce the overall continuum shape and capture the presence of prominent spectral features. For galaxies with sufficiently high signal-to-noise ratios in their observed spectra, the Dn4000 index shows good agreement between the reconstructed spectra and the observed spectra. On average, the spectral reconstruction residuals are close to the noise level of the observed spectra. Latent-diffusion generative modeling enables joint inference of galaxy photometric-redshift PDFs and rest-frame spectra from photometric fluxes.
Editorial analysis
A structured set of objections, weighed in public.
Referee Report
Summary. The manuscript introduces a generative framework that pre-trains the SPENDER autoencoder on 5 million DESI DR1 spectra to obtain a low-dimensional latent representation of rest-frame spectra, then trains a conditional diffusion model to map broadband photometric fluxes onto joint samples of the latent vector and photometric redshift. Sampling from the diffusion model produces a full photo-z PDF per galaxy; point estimates derived from it are stated to match the precision of a gradient-boosted decision tree, while the decoded latent vectors yield rest-frame spectra whose continuum shape and prominent features agree with observed spectra (Dn4000 index agreement for high-S/N objects, residuals near noise level).
Significance. If the method is shown to be robust, it would supply probabilistic redshifts together with reconstructed spectra for the billions of galaxies in wide-field imaging surveys, enabling statistical studies that currently require sparse spectroscopy. The provision of full PDFs rather than point estimates is a clear strength for downstream cosmological and galaxy-evolution analyses.
major comments (2)
- [Methods (SPENDER pre-training and diffusion conditioning)] The central claim that the diffusion model can map photometry onto an unbiased latent representation without systematic loss of information rests on the completeness of the SPENDER latent space. The manuscript provides no quantitative tests of reconstruction fidelity or photo-z bias for galaxies outside the DESI DR1 selection (e.g., higher-redshift objects, rare emission-line systems, or continuum shapes absent from the training set). Without such coverage metrics or out-of-distribution validation, the reported agreement for high-S/N galaxies with existing spectra does not establish that the method is free of population-dependent systematics.
- [Results and abstract] No numerical photo-z performance metrics (bias, scatter, outlier fraction, or PIT histogram) or ablation studies on diffusion hyperparameters are reported, even though the abstract asserts comparability to a gradient-boosted tree. This absence makes it impossible to judge whether the probabilistic output improves upon or merely reproduces existing point-estimate methods.
minor comments (2)
- [Abstract] The abstract states that residuals are 'close to the noise level' without quoting an RMS value or showing the distribution of residuals versus wavelength or S/N; a quantitative panel would strengthen the claim.
- [Methods] Notation for the latent dimension of SPENDER and the diffusion time-step schedule is introduced without a compact summary table; readers would benefit from an explicit list of all free parameters and their adopted values.
Simulated Author's Rebuttal
We thank the referee for their constructive and detailed review. We address each major comment below and have revised the manuscript to incorporate additional validation, quantitative metrics, and discussion of limitations.
read point-by-point responses
-
Referee: [Methods (SPENDER pre-training and diffusion conditioning)] The central claim that the diffusion model can map photometry onto an unbiased latent representation without systematic loss of information rests on the completeness of the SPENDER latent space. The manuscript provides no quantitative tests of reconstruction fidelity or photo-z bias for galaxies outside the DESI DR1 selection (e.g., higher-redshift objects, rare emission-line systems, or continuum shapes absent from the training set). Without such coverage metrics or out-of-distribution validation, the reported agreement for high-S/N galaxies with existing spectra does not establish that the method is free of population-dependent systematics.
Authors: We agree that explicit out-of-distribution tests would strengthen the claims of unbiased mapping. The SPENDER autoencoder was trained on 5 million DESI DR1 spectra spanning a wide range of galaxy types and redshifts; the diffusion model learns the conditional mapping within this distribution. In the revised manuscript we have added a new subsection on training-set coverage, including quantitative reconstruction metrics (e.g., residual statistics and latent-space coverage) stratified by galaxy properties within the DESI sample, plus a PIT histogram for photo-z calibration. We also discuss expected limitations for populations poorly represented in DESI DR1 (higher-z or rare emission-line systems) as a boundary on current applicability. Full OOD validation for objects outside the DESI selection would require additional spectroscopic data not available to us at present. revision: partial
-
Referee: [Results and abstract] No numerical photo-z performance metrics (bias, scatter, outlier fraction, or PIT histogram) or ablation studies on diffusion hyperparameters are reported, even though the abstract asserts comparability to a gradient-boosted tree. This absence makes it impossible to judge whether the probabilistic output improves upon or merely reproduces existing point-estimate methods.
Authors: The referee correctly notes that the original submission omitted explicit numerical metrics and ablations. We have revised the Results section to include a table of photo-z performance metrics (bias, scatter, outlier fraction) for point estimates derived from the diffusion PDFs, directly compared against a gradient-boosted decision tree trained on identical photometric features. We also added a PIT histogram demonstrating PDF calibration. An appendix now contains ablation experiments on diffusion hyperparameters (number of steps, conditioning weight) showing that the reported performance is robust. These additions confirm that the point estimates match the tree-based precision while supplying full PDFs and joint spectral reconstructions. revision: yes
Circularity Check
No significant circularity in the generative modeling pipeline
full rationale
The paper presents a two-stage trained generative model: a pre-trained SPENDER autoencoder learns a latent representation from external DESI DR1 spectra, after which a conditional diffusion model is trained to map photometric fluxes to joint samples of latent codes and redshifts. Sampling then produces PDFs and decoded spectra. This is standard supervised generative modeling whose outputs are not algebraically forced by the inputs; the latent space and diffusion process are learned parameters fitted to independent training data. No self-definitional equations, fitted-inputs-renamed-as-predictions, or load-bearing self-citations that collapse the central claim appear in the described derivation chain. The approach remains self-contained against external benchmarks and does not reduce to its own inputs by construction.
Axiom & Free-Parameter Ledger
free parameters (2)
- latent dimension of SPENDER
- diffusion model hyperparameters
axioms (1)
- domain assumption The distribution of rest-frame spectra can be adequately captured by a low-dimensional latent space learned from DESI DR1 spectra.
Reference graph
Works this paper leans on
-
[1]
Balogh, M. L., Morris, S. L., Yee, H. K. C., Carlberg, R. G., & Ellingson, E. 1999, ApJ, 527, 54
work page 1999
-
[2]
Brinchmann, J., Charlot, S., White, S. D. M., et al. 2004, MNRAS, 351, 1151
work page 2004
-
[3]
Chambers, K. C., Magnier, E. A., Metcalfe, N., et al. 2016, arXiv e-prints, arXiv:1612.05560
work page internal anchor Pith review Pith/arXiv arXiv 2016
-
[4]
The DESI Experiment Part I: Science,Targeting, and Survey Design
Conroy, C. 2013, ARA&A, 51, 393 Dark Energy Survey Collaboration, Abbott, T., Abdalla, F. B., et al. 2016, MN- RAS, 460, 1270 DESI Collaboration, Abdul Karim, M., Adame, A. G., et al. 2026, The Astro- nomical Journal, 171, 285 DESI Collaboration, Aghamousa, A., Aguilar, J., et al. 2016, arXiv e-prints, arXiv:1611.00036
work page internal anchor Pith review arXiv 2013
- [5]
-
[6]
2022, arXiv e-prints, arXiv:2211.05556
Doorenbos, L., Cavuoti, S., Longo, G., et al. 2022, arXiv e-prints, arXiv:2211.05556
- [7]
-
[8]
Gneiting, T., Balabdaoui, F., & Raftery, A. E. 2007, Journal of the Royal Statis- tical Society Series B: Statistical Methodology, 69, 243
work page 2007
-
[9]
Hildebrandt, H., Arnouts, S., Capak, P., et al. 2010, A&A, 523, A31
work page 2010
-
[10]
2020, Advances in neural information processing systems, 33, 6840
Ho, J., Jain, A., & Abbeel, P. 2020, Advances in neural information processing systems, 33, 6840
work page 2020
- [11]
-
[12]
Kauffmann, G., Heckman, T. M., White, S. D. M., et al. 2003, MNRAS, 341, 33
work page 2003
-
[13]
Kennicutt, Jr., R. C. 1998, ARA&A, 36, 189
work page 1998
-
[14]
Kewley, L. J. & Dopita, M. A. 2002, ApJS, 142, 35
work page 2002
- [15]
-
[16]
Loshchilov, I. & Hutter, F. 2019, in International Conference on Learning Rep- resentations
work page 2019
-
[17]
Melchior, P., Liang, Y ., Hahn, C., & Goulding, A. 2023, AJ, 166, 74
work page 2023
-
[18]
Portillo, S. K. N., Parejko, J. K., Vergara, J. R., & Connolly, A. J. 2020, AJ, 160, 45
work page 2020
-
[19]
Prokhorenkova, L., Gusev, G., V orobev, A., Dorogush, A. V ., & Gulin, A. 2018, Advances in neural information processing systems, 31
work page 2018
-
[20]
Rombach, R., Blattmann, A., Lorenz, D., Esser, P., & Ommer, B. 2022, in Pro- ceedings of the IEEE/CVF conference on computer vision and pattern recog- nition, 10684–10695
work page 2022
- [21]
-
[22]
Smith, L. N. & Topin, N. 2019, in Artificial intelligence and machine learning for multi-domain operations applications, V ol. 11006, SPIE, 369–386
work page 2019
-
[23]
Denoising Diffusion Implicit Models
Song, J., Meng, C., & Ermon, S. 2020, arXiv:2010.02502
work page internal anchor Pith review Pith/arXiv arXiv 2020
-
[24]
2017, Advances in neural information processing systems, 30
Vaswani, A., Shazeer, N., Parmar, N., et al. 2017, Advances in neural information processing systems, 30
work page 2017
- [25]
-
[26]
Walcher, J., Groves, B., Budavári, T., & Dale, D. 2011, Ap&SS, 331, 1
work page 2011
-
[27]
Wright, E. L., Eisenhardt, P. R. M., Mainzer, A. K., et al. 2010, AJ, 140, 1868
work page 2010
- [28]
-
[29]
Zhou, R., Newman, J. A., Mao, Y .-Y ., et al. 2021, MNRAS, 501, 3309 Article number, page 12
work page 2021
discussion (0)
Sign in with ORCID, Apple, or X to comment. Anyone can read and Pith papers without signing in.