Recognition: no theorem link
Search for long-term variability of HESS J1745-290
Pith reviewed 2026-05-12 04:02 UTC · model grok-4.3
The pith
No significant long-term or yearly variability is detected in the gamma-ray source HESS J1745-290 over 16 years.
A machine-rendered reading of the paper's core claim, the machinery that carries it, and where it could break.
Core claim
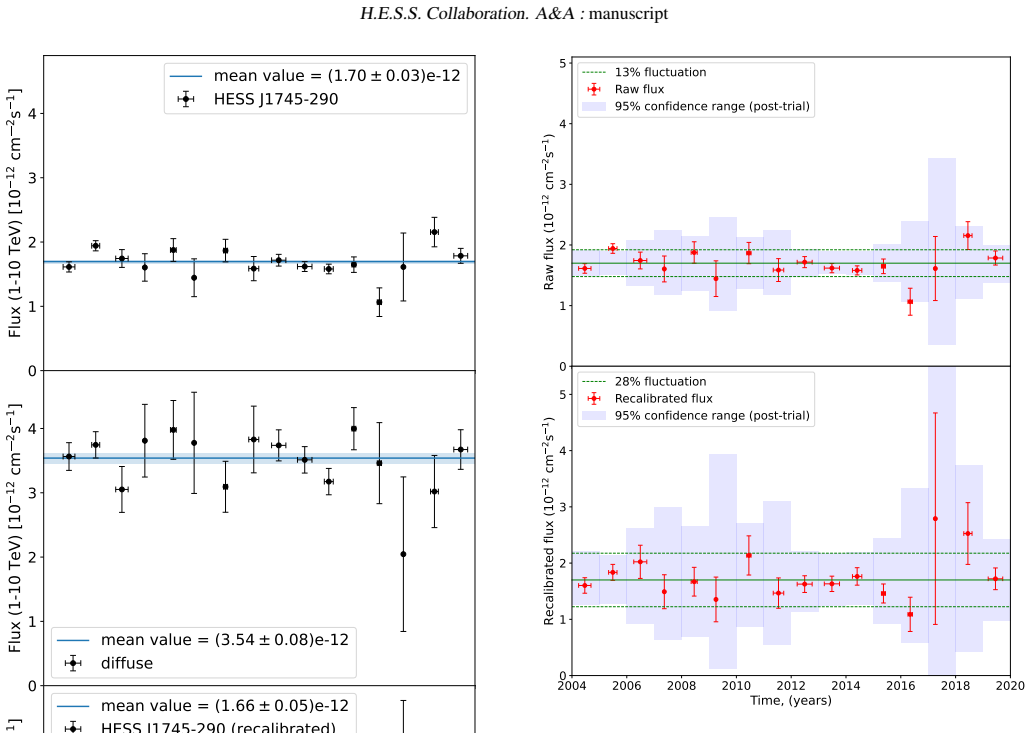
Using 353 hours of H.E.S.S. observations spanning 16 years, a 3D maximum-likelihood analysis was performed on the Galactic center region to extract the light curve of HESS J1745-290 after separating it from the diffuse gamma-ray emission. The analysis shows no long-term or yearly variability in the source. Any yearly gamma-ray flux variation larger than 30 percent is ruled out, as is any linear flux variation exceeding 30 percent over the time period.
What carries the argument
The 3D maximum-likelihood analysis method that jointly models the central point source and overlapping diffuse emission to produce a recalibrated light curve with reduced systematic effects.
If this is right
- The flux of HESS J1745-290 remains constant within 30 percent on yearly timescales.
- No linear trend in flux larger than 30 percent occurs over the 16-year observation period.
- The 3D analysis reduces systematic uncertainties by using the diffuse emission to recalibrate the source.
- The dataset provides a quantitative estimate of sensitivity to flux variations for this specific source.
Where Pith is reading between the lines
- The steady behavior constrains emission models to those that produce constant output rather than transient or periodic activity.
- The separation technique may improve variability searches in other crowded gamma-ray fields with diffuse backgrounds.
- Continued monitoring could test whether smaller variations below the current 30 percent threshold appear with longer baselines or higher statistics.
Load-bearing premise
The 3D maximum-likelihood analysis correctly separates the central point source from the overlapping diffuse emission without introducing time-dependent biases that could mask or mimic variability in the extracted light curve.
What would settle it
An independent reanalysis or new observations that detect a gamma-ray flux change larger than 30 percent in any year or a linear trend exceeding 30 percent over the full 16-year span would contradict the no-variability result.
Figures


read the original abstract
At the center of our Galaxy lies the bright {\gamma}-ray point-like source HESS J1745-290, which is compatible in position with Sgr A star, although an association between the two remains uncertain. Using data obtained between 2004 and 2019 with the High Energy Stereoscopic System (H.E.S.S.) on the Galactic center region, we studied the variability of HESS J1745-290 over 353 hours of observations collected over 16 years, representing the largest dataset gathered yet on this region at TeV energies. We performed a 3D maximum-likelihood analysis of the central source and the diffuse {\gamma}-ray emission in the Galactic center region. This analysis allowed us to extract the spectral and morphological intrinsic behavior of the two components. By performing this analysis on an annual basis, we derived the light curve of HESS J1745-290 and the diffuse emission over the past 16 years. The 3D maximum-likelihood analysis method allowed us to separate the central source from the overlapping diffuse emission, enabling a recalibration of the former by the latter and alleviating some of the systematic effects. We find no long-term or yearly variability. We also provide an estimate of the sensitivity of H.E.S.S. to variation of this specific source over 16 years. We rule out any yearly gamma-ray flux variation of this source larger than 30 percent, as well as any linear flux variation exceeding 30% over this time period.
Editorial analysis
A structured set of objections, weighed in public.
Referee Report
Summary. The manuscript analyzes 353 hours of H.E.S.S. observations of the Galactic center from 2004–2019 to search for long-term variability in HESS J1745-290. Using a 3D maximum-likelihood fit that jointly models the central point source and overlapping diffuse emission, the authors derive an annual light curve for the point source, find no evidence of yearly or linear variability, and set upper limits ruling out flux changes larger than 30% on yearly timescales or in a linear trend over the full 16-year baseline.
Significance. If the source–diffuse separation is shown to be free of time-dependent biases, the result would provide the tightest existing constraints on the stability of this TeV source, with direct implications for its possible association with Sgr A* and for models of steady versus variable emission in the Galactic center. The recalibration approach using the diffuse component is a methodological strength that could improve long-baseline IACT monitoring.
major comments (2)
- [3D maximum-likelihood analysis and light-curve extraction] The central claim that yearly variations are ruled out at the 30% level rests on the annual point-source normalizations extracted from the joint 3D maximum-likelihood fit. The manuscript states that this approach “alleviates some of the systematic effects” via recalibration by the diffuse emission, but provides no quantitative assessment (e.g., via dedicated systematic-variation studies or year-by-year IRF comparisons) of residual time-dependent leakage between the point-source and diffuse components that could artificially stabilize the extracted light curve.
- [Results and upper-limit derivation] The sensitivity estimate and the precise statistical procedure used to exclude >30% yearly or linear variations are not described in sufficient detail (e.g., no mention of the test statistic for the constant-flux hypothesis, treatment of systematic uncertainties in the likelihood, or how the 30% threshold is derived from the data). Without these elements the quoted limits cannot be independently verified.
minor comments (2)
- The abstract and introduction would benefit from an explicit statement of the energy range, spectral model assumptions, and morphological templates adopted for both the point source and diffuse components.
- Figure captions and table headers should clarify whether the reported fluxes are integrated above a fixed energy threshold or are differential normalizations at a reference energy.
Simulated Author's Rebuttal
We thank the referee for the careful and constructive review. The comments have prompted us to strengthen the description of our systematic checks and statistical procedures. We address each major comment below and have revised the manuscript accordingly.
read point-by-point responses
-
Referee: [3D maximum-likelihood analysis and light-curve extraction] The central claim that yearly variations are ruled out at the 30% level rests on the annual point-source normalizations extracted from the joint 3D maximum-likelihood fit. The manuscript states that this approach “alleviates some of the systematic effects” via recalibration by the diffuse emission, but provides no quantitative assessment (e.g., via dedicated systematic-variation studies or year-by-year IRF comparisons) of residual time-dependent leakage between the point-source and diffuse components that could artificially stabilize the extracted light curve.
Authors: We agree that an explicit quantitative assessment of residual time-dependent leakage would improve the robustness of the result. In the revised manuscript we have added a new subsection detailing systematic studies: year-by-year IRF comparisons across the 16-year baseline and Monte Carlo simulations that inject controlled time-dependent biases between the point-source and diffuse components. These checks demonstrate that any residual leakage is too small to artificially suppress variability at the 30% level reported. The joint 3D fit and diffuse-based recalibration remain central to mitigating observation-condition systematics, but the added studies now provide the quantitative support requested. revision: yes
-
Referee: [Results and upper-limit derivation] The sensitivity estimate and the precise statistical procedure used to exclude >30% yearly or linear variations are not described in sufficient detail (e.g., no mention of the test statistic for the constant-flux hypothesis, treatment of systematic uncertainties in the likelihood, or how the 30% threshold is derived from the data). Without these elements the quoted limits cannot be independently verified.
Authors: We acknowledge the need for greater detail to enable independent verification. The revised manuscript now includes an expanded methods section that specifies: (i) the likelihood-ratio test statistic used to compare the constant-flux hypothesis against the annual-normalization model, (ii) the incorporation of systematic uncertainties via nuisance parameters that are profiled in the 3D likelihood, and (iii) the derivation of the 30% limit as the variability amplitude excluded at 95% confidence level from the observed light-curve uncertainties. The sensitivity to linear trends over 16 years is obtained from Monte Carlo simulations of the full dataset under the null hypothesis. These additions allow the quoted limits to be reproduced from the provided data and analysis description. revision: yes
Circularity Check
No significant circularity; direct empirical test on fitted annual fluxes
full rationale
The paper extracts annual light curves for the point source and diffuse emission via repeated 3D maximum-likelihood fits to the H.E.S.S. dataset, then compares the resulting normalizations to a constant-flux hypothesis. This is a standard statistical procedure on observational data; no quantity is defined in terms of itself, no fitted parameter is relabeled as a prediction, and no self-citation supplies a uniqueness theorem or ansatz that forces the no-variability conclusion. The recalibration step using the diffuse component is an internal modeling choice whose validity is external to the variability test itself, and the final limits follow from the data comparison without reduction by construction.
Axiom & Free-Parameter Ledger
free parameters (1)
- annual flux normalizations
axioms (2)
- domain assumption The diffuse gamma-ray emission in the Galactic center region does not vary on yearly timescales.
- domain assumption Instrument response functions and atmospheric corrections remain consistent over the 2004-2019 period.
Reference graph
Works this paper leans on
-
[1]
Abdalla, H., Aharonian, F., Ait Benkhali, F., et al. 2021, A&A, 653, A152
work page 2021
- [2]
-
[3]
B., Benbow, W., Brill, A., et al
Adams, C. B., Benbow, W., Brill, A., et al. 2021, ApJ, 913, 115
work page 2021
-
[4]
Aharonian, F., Akhperjanian, A. G., Anton, G., et al. 2009, A&A, 503, 817
work page 2009
-
[5]
Aharonian, F., Akhperjanian, A. G., Aye, K. M., et al. 2005, A&A, 432, L25
work page 2005
-
[6]
Aharonian, F., Akhperjanian, A. G., Aye, K. M., et al. 2004, A&A, 425, L13
work page 2004
-
[7]
G., Barres de Almeida, U., et al
Aharonian, F., Akhperjanian, A. G., Barres de Almeida, U., et al. 2008, A&A, 492, L25
work page 2008
-
[8]
Aharonian, F., Akhperjanian, A. G., Bazer-Bachi, A. R., et al. 2006, Astronomy & Astrophysics, 457, 899
work page 2006
-
[9]
Ahnen, M. L., Ansoldi, S., Antonelli, L. A., et al. 2017, A&A, 601, A33
work page 2017
-
[10]
2006, ApJ, 638, L101 Andrés, A., van den Eijnden, J., Degenaar, N., et al
Albert, J., Aliu, E., Anderhub, H., et al. 2006, ApJ, 638, L101 Andrés, A., van den Eijnden, J., Degenaar, N., et al. 2022, MNRAS, 510, 2851
work page 2006
-
[11]
Archer, A., Barnacka, A., Beilicke, M., et al. 2014, ApJ, 790, 149
work page 2014
- [12]
-
[13]
Baganoff, F. K., Bautz, M. W., Brandt, W. N., et al. 2001, Nature, 413, 45
work page 2001
-
[14]
R., Melia, F., Liu, S., & Crocker, R
Ballantyne, D. R., Melia, F., Liu, S., & Crocker, R. M. 2007, ApJ, 657, L13
work page 2007
-
[15]
Ballantyne, D. R., Schumann, M., & Ford, B. 2011, MNRAS, 410, 1521
work page 2011
-
[16]
Becherini, Y ., Punch, M., & H. E. S. S. Collaboration. 2012, in American In- stitute of Physics Conference Series, V ol. 1505, High Energy Gamma-Ray Astronomy: 5th International Meeting on High Energy Gamma-Ray Astron- omy, ed. F. A. Aharonian, W. Hofmann, & F. M. Rieger, 741–744
work page 2012
-
[17]
2007, A&A, 466, 1219 Bouffard, É., Haggard, D., Nowak, M
Berge, D., Funk, S., & Hinton, J. 2007, A&A, 466, 1219 Bouffard, É., Haggard, D., Nowak, M. A., et al. 2019, ApJ, 884, 148
work page 2007
- [18]
-
[19]
Chalme-Calvet, R., de Naurois, M., & Tavernet, J. P. 2014, Muon efficiency of the H.E.S.S. telescope
work page 2014
-
[20]
Chernyakova, M., Malyshev, D., Aharonian, F. A., Crocker, R. M., & Jones, D. I. 2011, ApJ, 726, 60
work page 2011
-
[21]
Christopher, M. H., Scoville, N. Z., Stolovy, S. R., & Yun, M. S. 2005, ApJ, 622, 346
work page 2005
-
[22]
Chuard, D., Terrier, R., Goldwurm, A., et al. 2018, A&A, 610, A34
work page 2018
-
[23]
Churazov, E., Khabibullin, I., Sunyaev, R., & Ponti, G. 2017, MNRAS, 465, 45
work page 2017
-
[24]
Clavel, M., Terrier, R., Goldwurm, A., et al. 2013, A&A, 558, A32
work page 2013
-
[25]
Cuadra, J., Nayakshin, S., & Wang, Q. D. 2015, MNRAS, 450, 277
work page 2015
-
[26]
2017, in American Institute of Physics Conference Series, V ol
Deil, C., Boisson, C., Kosack, K., et al. 2017, in American Institute of Physics Conference Series, V ol. 1792, 6th International Symposium on High Energy Gamma-Ray Astronomy, 070006
work page 2017
- [27]
-
[28]
Dodds-Eden, K., Sharma, P., Quataert, E., et al. 2010, ApJ, 725, 450
work page 2010
- [29]
-
[30]
Eckart, A., Baganoff, F. K., Morris, M., et al. 2004, A&A, 427, 1
work page 2004
-
[31]
2010, Reviews of Modern Physics, 82, 3121
Genzel, R., Eisenhauer, F., & Gillessen, S. 2010, Reviews of Modern Physics, 82, 3121
work page 2010
-
[32]
2003, Nature, 425, 934 GRA VITY Collaboration, Abuter, R., Amorim, A., et al
Genzel, R., Schödel, R., Ott, T., et al. 2003, Nature, 425, 934 GRA VITY Collaboration, Abuter, R., Amorim, A., et al. 2021, A&A, 654, A22 Gravity Collaboration, Abuter, R., Amorim, A., et al. 2020, A&A, 638, A2
work page 2003
-
[33]
2013, Journal of Physics G Nuclear Physics, 40, 065201 H
Guo, Y .-Q., Yuan, Q., Liu, C., & Li, A.-F. 2013, Journal of Physics G Nuclear Physics, 40, 065201 H. E. S. S. Collaboration, Abdalla, H., Abramowski, A., et al. 2018, A&A, 612, A9 H. E. S. S. Collaboration, Aharonian, F., Ait Benkhali, F., et al. 2023, A&A, 672, A103 H.E.S.S. Collaboration, Abramowski, A., Aharonian, F., et al. 2016, Nature, 531, 476 HES...
work page 2013
-
[34]
Hillas, A. M. 1985, in International Cosmic Ray Conference, V ol. 3, 19th Inter- national Cosmic Ray Conference (ICRC19), V olume 3, 445
work page 1985
-
[35]
Hinton, J. A. & Aharonian, F. A. 2007, ApJ, 657, 302
work page 2007
-
[36]
2015, in International Cosmic Ray
Khelifi, B., Djannati-Ataï, A., Jouvin, L., et al. 2015, in International Cosmic Ray
work page 2015
- [37]
- [38]
- [39]
-
[40]
2006, ApJ, 647, 1099 MAGIC Collaboration, Acciari, V
Liu, S., Melia, F., Petrosian, V ., & Fatuzzo, M. 2006, ApJ, 647, 1099 MAGIC Collaboration, Acciari, V . A., Ansoldi, S., et al. 2020, A&A, 642, A190
work page 2006
-
[41]
Mohrmann, L., Specovius, A., Tiziani, D., et al. 2019, A&A, 632, A72
work page 2019
-
[42]
Mossoux, E., Finociety, B., Beckers, J. M., & Vincent, F. H. 2020, A&A, 636, A25
work page 2020
- [43]
- [44]
- [45]
-
[46]
2009, Astroparticle Physics, 31, 383
Ohm, S., van Eldik, C., & Egberts, K. 2009, Astroparticle Physics, 31, 383
work page 2009
-
[47]
Parsons, R. D. & Hinton, J. A. 2014, Astroparticle Physics, 56, 26
work page 2014
- [48]
-
[49]
Ponti, G., George, E., Scaringi, S., et al. 2017, MNRAS, 468, 2447
work page 2017
-
[50]
Roy, A., Gupta, A. C., Chitnis, V . R., et al. 2023, The Astrophysical Journal Supplement Series, 265, 14
work page 2023
-
[51]
Schleicher, B., Arbet-Engels, A., Baack, D., et al. 2019, Galaxies, 7, 62
work page 2019
- [52]
- [53]
-
[54]
Weldon, G. C., Do, T., Witzel, G., et al. 2023, ApJ, 954, L33
work page 2023
- [55]
- [56]
- [57]
-
[58]
Yuan, F., Quataert, E., & Narayan, R. 2003, ApJ, 598, 301 1 University of Southern Denmark 2 Astronomy & Astrophysics Section, School of Cosmic Physics, Dublin Institute for Advanced Studies, DIAS Dunsink Observatory, Dublin D15 XR2R, Ireland 3 Max-Planck-Institut für Kernphysik, P.O. Box 103980, D 69029
work page 2003
-
[59]
Avenue, Braamfontein, Johannesburg, 2050, South Africa 15 School of Physical Sciences and Centre for Astrophysics &
work page 2050
-
[60]
Higashinada, Kobe, Hyogo 658-8501, Japan 33 Kapteyn Astronomical Institute, University of Groningen, Landleven 12, 9747 AD Groningen, The Netherlands Article number, page 9 of 10 H.E.S.S. Collaboration. A&A :manuscript Appendix A: Yearly energy fluxes of HESS J1745-290 Table A.1.Recalibrated yearly energy fluxes of HESS J1745-290. Year Flux (10 −12 erg cm...
work page 2004
discussion (0)
Sign in with ORCID, Apple, or X to comment. Anyone can read and Pith papers without signing in.