Recognition: 2 theorem links
· Lean TheoremLearning More from Less: Exploiting Counterfactuals for Data-Efficient Chart Understanding
Pith reviewed 2026-05-12 03:47 UTC · model grok-4.3
The pith
ChartCF trains vision-language models to understand charts with far less data by generating and optimizing on counterfactual examples.
A machine-rendered reading of the paper's core claim, the machinery that carries it, and where it could break.
Core claim
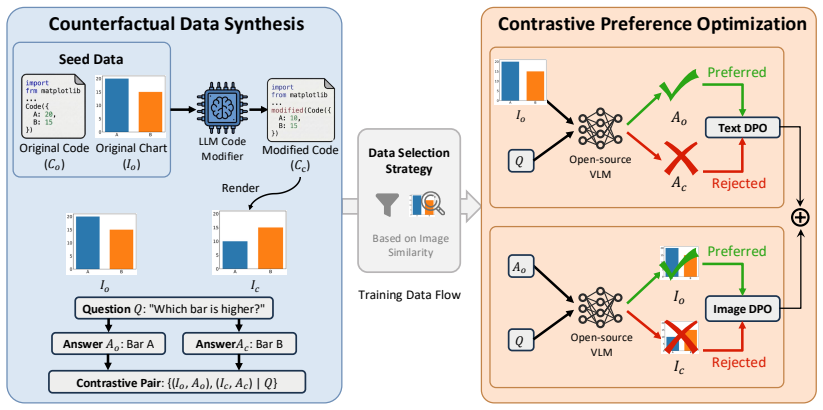
By synthesizing counterfactual charts through code modifications that induce controlled semantic shifts, filtering samples by visual similarity, and applying multimodal preference optimization, ChartCF enables vision-language models to learn fine-grained chart discrimination and reach superior or comparable performance on five benchmarks while using significantly less training data than standard supervised fine-tuning on large synthetic collections.
What carries the argument
Counterfactual data synthesis via code modification, which produces chart pairs with small visual edits that flip correct answers, combined with similarity-based sample filtering and multimodal preference optimization across textual and visual modalities.
If this is right
- Chart understanding tasks can succeed with much smaller supervised datasets.
- Models become more sensitive to subtle visual differences that change chart meaning.
- Training efficiency improves by focusing on semantically informative variations rather than volume.
- The same pipeline applies across multiple chart reasoning benchmarks without task-specific redesign.
- Preference optimization on paired visual-text examples strengthens fine-grained multimodal alignment.
Where Pith is reading between the lines
- The same counterfactual generation idea could be tested on other programmatically created visuals such as diagrams or flowcharts.
- Lower data volume might translate directly into reduced compute and energy costs for deploying chart analysis systems.
- The filtering step could be adapted as a general technique for selecting high-value examples in other multimodal training settings.
- Real-world robustness might increase if the preference optimization helps models ignore irrelevant visual noise.
Load-bearing premise
The code-modification process creates counterfactual examples whose semantic changes mirror real-world chart variations and the similarity filter plus preference optimization teach the right discriminations without injecting new biases.
What would settle it
An experiment showing that models trained under ChartCF lose their performance edge when evaluated on charts generated by entirely different code libraries or on real scanned documents rather than synthetic ones.
Figures


read the original abstract
Vision-Language Models (VLMs) have demonstrated remarkable progress in chart understanding, largely driven by supervised fine-tuning (SFT) on increasingly large synthetic datasets. However, scaling SFT data alone is inefficient and overlooks a key property of charts: charts are programmatically generated visual artifacts, where small, code-controlled visual changes can induce drastic shifts in semantics and correct answers. Learning this counterfactual sensitivity requires VLMs to discriminate fine-grained visual differences, yet standard SFT treats training instances independently and provides limited supervision to enforce this behavior. To address this, we introduce ChartCF, a data-efficient training framework designed to enhance counterfactual sensitivity. ChartCF consists of: (1) a counterfactual data synthesis pipeline via code modification, (2) a chart similarity-based data selection strategy that filters overly difficult samples for improved training efficiency, and (3) multimodal preference optimization across both textual and visual modalities. Experiments on five benchmarks show that ChartCF achieves superior or comparable performance to strong chart-specific VLMs while using significantly less training data.
Editorial analysis
A structured set of objections, weighed in public.
Referee Report
Summary. The manuscript introduces ChartCF, a data-efficient training framework for vision-language models on chart understanding. It consists of a counterfactual data synthesis pipeline via code modification, a chart similarity-based data selection strategy to filter overly difficult samples, and multimodal preference optimization across textual and visual modalities. The central claim, supported by experiments on five benchmarks, is that ChartCF achieves superior or comparable performance to strong chart-specific VLMs while using significantly less training data.
Significance. If the results hold under detailed scrutiny, the work would be significant for advancing data-efficient VLM training by exploiting the programmatic nature of charts to generate counterfactuals that promote fine-grained visual discrimination. This empirical engineering approach could reduce dependence on large synthetic datasets and offer a template for other domains where small controlled changes induce large semantic shifts.
major comments (2)
- [Experiments] The abstract reports positive results on five benchmarks but provides no details on experimental setup, baselines, statistical tests, data volumes, or ablations. This omission is load-bearing for the central performance claim and prevents evaluation of whether the gains are robust.
- [Method (counterfactual synthesis and optimization pipeline)] The method assumes that code-modification counterfactuals produce semantic shifts representative of real-world chart variations and that the similarity filter plus multimodal preference optimization reliably teaches fine-grained discrimination without new biases. No verification of distributional match or bias analysis is described, which risks benchmark-specific artifacts if the synthetic shifts differ systematically from natural variations.
minor comments (1)
- The abstract would benefit from naming the five benchmarks and briefly indicating the scale of data reduction achieved.
Simulated Author's Rebuttal
We thank the referee for their constructive review and for recognizing the potential significance of ChartCF for data-efficient VLM training. We address each major comment below with specific references to the manuscript and indicate planned revisions where appropriate.
read point-by-point responses
-
Referee: [Experiments] The abstract reports positive results on five benchmarks but provides no details on experimental setup, baselines, statistical tests, data volumes, or ablations. This omission is load-bearing for the central performance claim and prevents evaluation of whether the gains are robust.
Authors: We agree that the abstract is intentionally concise and omits these specifics, which are instead provided in full in the manuscript. Section 4 (Experimental Setup) details the five benchmarks (ChartQA, Chart-to-Text, PlotQA, FigureQA, and VisText), the baselines (including ChartLlama, LLaVA-Chart, and general VLMs), training data volumes (ChartCF uses approximately 40-60% less data than the strongest baselines while matching or exceeding performance), ablations (Section 5.3), and evaluation protocols. Statistical significance is reported via standard error bars and paired t-tests in Table 2 and Appendix C. To make the central claim more self-contained, we will revise the abstract to include a brief summary of the data-efficiency gains and key experimental controls. revision: partial
-
Referee: [Method (counterfactual synthesis and optimization pipeline)] The method assumes that code-modification counterfactuals produce semantic shifts representative of real-world chart variations and that the similarity filter plus multimodal preference optimization reliably teaches fine-grained discrimination without new biases. No verification of distributional match or bias analysis is described, which risks benchmark-specific artifacts if the synthetic shifts differ systematically from natural variations.
Authors: We acknowledge that the manuscript does not include an explicit statistical distributional match (e.g., KL divergence between synthetic and real chart variation distributions). However, Section 3.1 and Figure 2 provide concrete examples of code modifications (axis scaling, data point perturbation, color changes) that induce semantic shifts directly analogous to common real-world chart misinterpretations. Section 5.3 ablations isolate the contribution of the similarity filter and multimodal preference optimization, showing consistent gains across both synthetic and real-world benchmarks without degradation on out-of-distribution tests. We will add a dedicated limitations paragraph in Section 6 discussing the assumption of representativeness and outlining future work on bias auditing (e.g., human validation of counterfactual realism). revision: partial
Circularity Check
No circularity: empirical pipeline with benchmark validation independent of its own fitted outputs.
full rationale
The paper advances an engineering framework (code-based counterfactual synthesis, similarity filtering, multimodal preference optimization) whose performance claims rest on external benchmark experiments rather than any closed mathematical derivation. No equations, uniqueness theorems, or self-cited ansatzes are invoked to force results by construction; the method is presented as a data-generation and training recipe whose value is measured by held-out accuracy gains. The central assumption (that synthetic code edits produce representative semantic shifts) is acknowledged as an empirical hypothesis, not a definitional identity, and is tested rather than presupposed in the reported results.
Axiom & Free-Parameter Ledger
Lean theorems connected to this paper
-
IndisputableMonolith/Cost/FunctionalEquation.leanwashburn_uniqueness_aczel unclear?
unclearRelation between the paper passage and the cited Recognition theorem.
ChartCF consists of: (1) a counterfactual data synthesis pipeline via code modification, (2) a chart similarity-based data selection strategy..., and (3) multimodal preference optimization across both textual and visual modalities.
-
IndisputableMonolith/Foundation/RealityFromDistinction.leanreality_from_one_distinction unclear?
unclearRelation between the paper passage and the cited Recognition theorem.
Experiments on five benchmarks show that ChartCF achieves superior or comparable performance... while using significantly less training data.
What do these tags mean?
- matches
- The paper's claim is directly supported by a theorem in the formal canon.
- supports
- The theorem supports part of the paper's argument, but the paper may add assumptions or extra steps.
- extends
- The paper goes beyond the formal theorem; the theorem is a base layer rather than the whole result.
- uses
- The paper appears to rely on the theorem as machinery.
- contradicts
- The paper's claim conflicts with a theorem or certificate in the canon.
- unclear
- Pith found a possible connection, but the passage is too broad, indirect, or ambiguous to say the theorem truly supports the claim.
Reference graph
Works this paper leans on
-
[1]
Qwen2.5-vl technical report.arXiv preprint arXiv:2502.13923. Lei Chen, Xuanle Zhao, Zhixiong Zeng, Jing Huang, Yufeng Zhong, and Lin Ma. 2025. Chart-r1: Chain- of-thought supervision and reinforcement for ad- vanced chart reasoner.Preprint, arXiv:2507.15509. Gheorghe Comanici, Eric Bieber, Mike Schaekermann, Ice Pasupat, Noveen Sachdeva, Inderjit Dhillon,...
work page internal anchor Pith review Pith/arXiv arXiv 2025
-
[2]
Matcha: Enhancing visual language pretrain- ing with math reasoning and chart derendering. In Proceedings of the 61st Annual Meeting of the As- sociation for Computational Linguistics (Volume 1: Long Papers), ACL 2023, Toronto, Canada, July 9-14, 2023, pages 12756–12770. Association for Computa- tional Linguistics. Zhuoming Liu, Xiaofeng Gao, Feiyang Niu,...
-
[3]
IEEE. Nitesh Methani, Pritha Ganguly, Mitesh M Khapra, and Pratyush Kumar. 2020b. Plotqa: Reasoning over scientific plots. InProceedings of the ieee/cvf winter conference on applications of computer vision, pages 1527–1536. Jason Obeid and Enamul Hoque. 2020. Chart-to-text: Generating natural language descriptions for charts by adapting the transformer mo...
work page internal anchor Pith review Pith/arXiv arXiv 2020
-
[4]
Sanchit Sinha, Oana Frunza, Kashif Rasul, Yuriy Nevmyvaka, and Aidong Zhang
Direct preference optimization: Your language model is secretly a reward model.Advances in neural information processing systems, 36:53728–53741. Sanchit Sinha, Oana Frunza, Kashif Rasul, Yuriy Nevmyvaka, and Aidong Zhang. 2025. Chart- rvr: Reinforcement learning with verifiable re- wards for explainable chart reasoning.Preprint, arXiv:2510.10973. Bohao T...
-
[5]
Tinychart: Efficient chart understanding with program-of-thoughts learning and visual token merg- ing. InProceedings of the 2024 Conference on Em- pirical Methods in Natural Language Processing, EMNLP 2024, Miami, FL, USA, November 12-16, 2024, pages 1882–1898. Association for Computa- tional Linguistics. Xuanle Zhao, Xianzhen Luo, Qi Shi, Chi Chen, Shuo ...
work page 2024
-
[6]
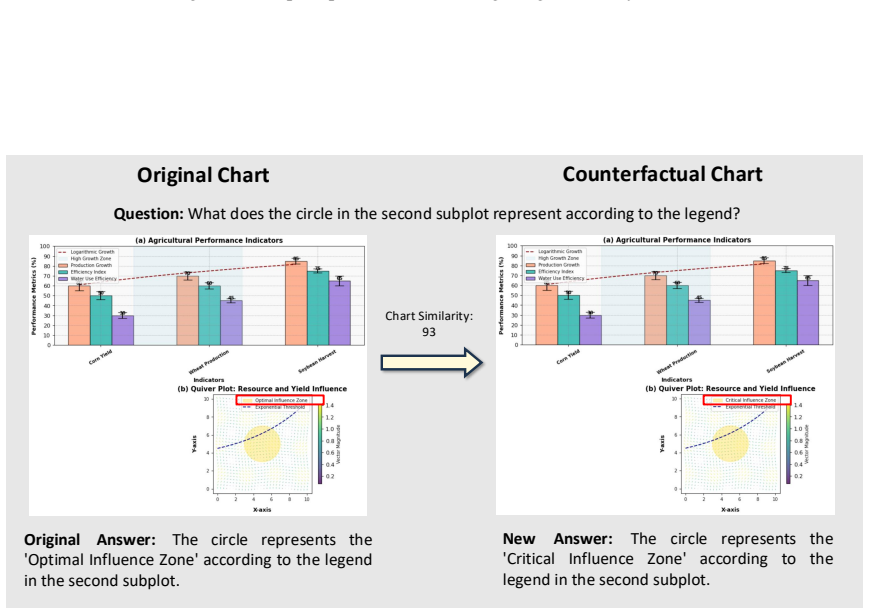
Case 1(Figure 7, similarity: 93) illustrates a descriptive question requiring legend interpre- tation. Our pipeline modifies the textual label in the legend from “Optimal Influence Zone” to “Critical Influence Zone” while keeping all visual elements unchanged, creating a rela- tively high-similarity counterfactual pair
-
[7]
The modification changes the maximum y-axis value from 250 to 200
Case 2(Figure 8, similarity: 90) illustrates a descriptive question about axis scale recogni- tion. The modification changes the maximum y-axis value from 250 to 200
-
[8]
Case 3(Figure 9, similarity: 90) shows a rea- soning question involving value extraction and numerical computation. Multiple data values are modified (e.g., Sun B Solar Flares from 6.8 to 9.7), resulting in a different final sum while maintaining similar chart appearance
-
[9]
Case 4(Figure 10, similarity: 76) presents a reasoning question about spatial relationships between chart objects. The modification alters line positions, requiring identification of both visual elements and their relative positions. These examples demonstrate our pipeline’s abil- ity to create diverse counterfactual pairs through different modification s...
-
[10]
Case 1(Figure 11) involves a descriptive ques- tion requiring precise identification of a spe- cific subplot and accurate reading of small- scale y-axis tick values. ECD fails to correctly identify the subplot location and misreads the axis range, while ChartCF correctly locates the target subplot and identifies the highest tick value as 1.5
-
[11]
ECD incorrectly identifies the subplot and extracts labels from the wrong leg- end
Case 2(Figure 12) presents a descriptive ques- tion about legend label extraction from a spe- cific subplot. ECD incorrectly identifies the subplot and extracts labels from the wrong leg- end. ChartCF accurately locates the correct subplot and extracts only the relevant labels
-
[12]
Case 3(Figure 13) demonstrates a reasoning question involving spatial position understand- ing. ECD misidentifies the target variable by confusing similar visual markers, while ChartCF correctly identifies “b_3” through precise spatial reasoning
-
[13]
Case 4(Figure 14) shows a reasoning ques- tion requiring numerical computation from legend values. ECD makes calculation errors by misreading category counts, while ChartCF performs accurate value extraction and com- putation to reach the correct answer
-
[14]
None"] ``` **New Answer:** [The new correct answer if feasible, otherwise write
Case 5(Figure 15) illustrates a reasoning question about comparing visual patterns across subplot regions. ECD incorrectly in- terprets the slope comparison, while ChartCF accurately analyzes the curve steepness in dif- ferent regions to determine the correct answer. These cases highlight that ChartCF’s counter- factual training enables models to develop ...
-
[15]
**Chart Types (20 points):** How similar are the chart types (e.g., line charts, bar charts, scatter plots, etc.) between the two images?
-
[16]
**Layout (20 points):** How similar is the arrangement of subplots (e.g., number of rows and columns, spacing) between the two images?
-
[17]
**Text Content (20 points):** How similar are the titles, annotations, axis labels, and other text elements (excluding axis tick labels) between the two images?
-
[18]
**Data (20 points):** How closely do the data trends, patterns, and the number of data groups match between the two images?
-
[19]
**Style (20 points):** How similar are the colors, line styles, marker types, legends, grids, and other stylistic details between the two images? ### Evaluation: Compare the two images head to head and provide a detailed assessment. Use the following format for your response: — Comments: - Chart Types: {your comment and subscore} - Layout: {your comment a...
work page 2000
-
[20]
The highest labeled tick is 1. Answer: 1 Answer by ChartCF (Qwen2.5-VL): The subplot at row 2 and column 3 has a y-axis with labeled ticks ranging from -1.5 to 1.5. The highest labeled tick is 1.5. Answer: 1.5 Question: For the subplot at row 2 and column 3, what is the spatially highest labeled tick on the y-axis? 1010_1 Ground-truth Answer: 1.5 Figure 1...
discussion (0)
Sign in with ORCID, Apple, or X to comment. Anyone can read and Pith papers without signing in.