Interpretable rainfall modelling reveals rapid reorganisation of Amazonian rainfall under vegetation loss
Pith reviewed 2026-05-13 07:14 UTC · model grok-4.3
The pith
A neural network model shows that sustained Amazon deforestation rapidly reorganizes rainfall by cutting heavy precipitation up to 7 percent while raising light rain by 4 percent.
A machine-rendered reading of the paper's core claim, the machinery that carries it, and where it could break.
Core claim
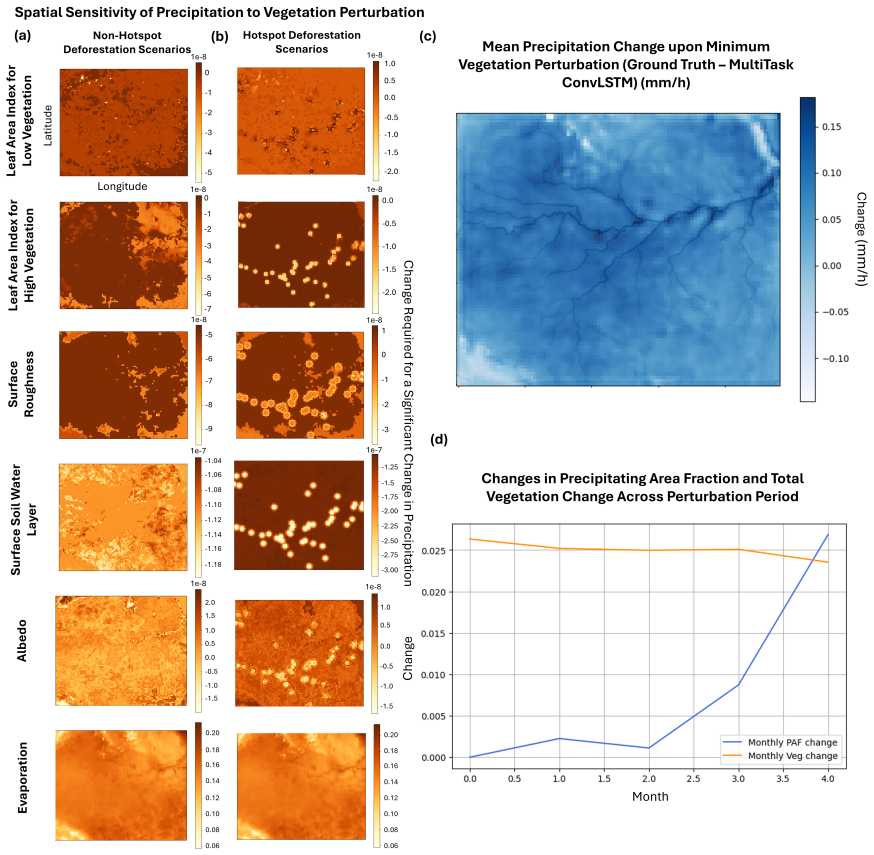
Using a neural-network rainfall predictor, sustained vegetation loss produces rapid asymmetric reorganization of Amazonian precipitation: heavy rainfall rates decline by up to 7 percent while light rainfall increases by 4 percent, rainfall entropy rises by 1.3 percent, and the fraction of precipitating area drops sharply after two to three months of sustained canopy reduction in sensitive zones.
What carries the argument
A neural-network model for hourly rainfall prediction together with sensitivity analyses and pathway diagnostics that link vegetation state to precipitation intensity and spatial coverage.
If this is right
- Heavy rainfall (20-50 mm/h) declines by up to 7 percent under sustained deforestation.
- Light rainfall (0.1-1 mm/h) increases by 4 percent with ongoing vegetation loss.
- Strongest effects concentrate in the north-western Amazon and Andean foothills.
- A sharp decline in precipitating area fraction occurs after 2-3 months of sustained change.
- Dry-season rainfall intensity rises by 0.3-0.5 percent per 0.5 percent forest-cover reduction.
Where Pith is reading between the lines
- Similar neural models could be applied to forecast rainfall shifts in other tropical deforestation frontiers such as the Congo basin.
- The short threshold timescale suggests that halting deforestation could stabilize rainfall patterns within a single season.
- Increased light-rain dominance may reduce overall water recycling efficiency and heighten drought risk during dry periods.
- Independent satellite observations of rainfall intensity over the past decade in high-deforestation zones offer a direct test of the reported asymmetry.
Load-bearing premise
The neural network has captured genuine causal land-atmosphere dependencies rather than spurious correlations from the training record.
What would settle it
Direct comparison of observed heavy-rainfall frequency in recently deforested Amazon regions against the model's predicted 7 percent decline after two to three months of sustained vegetation loss.
Figures


read the original abstract
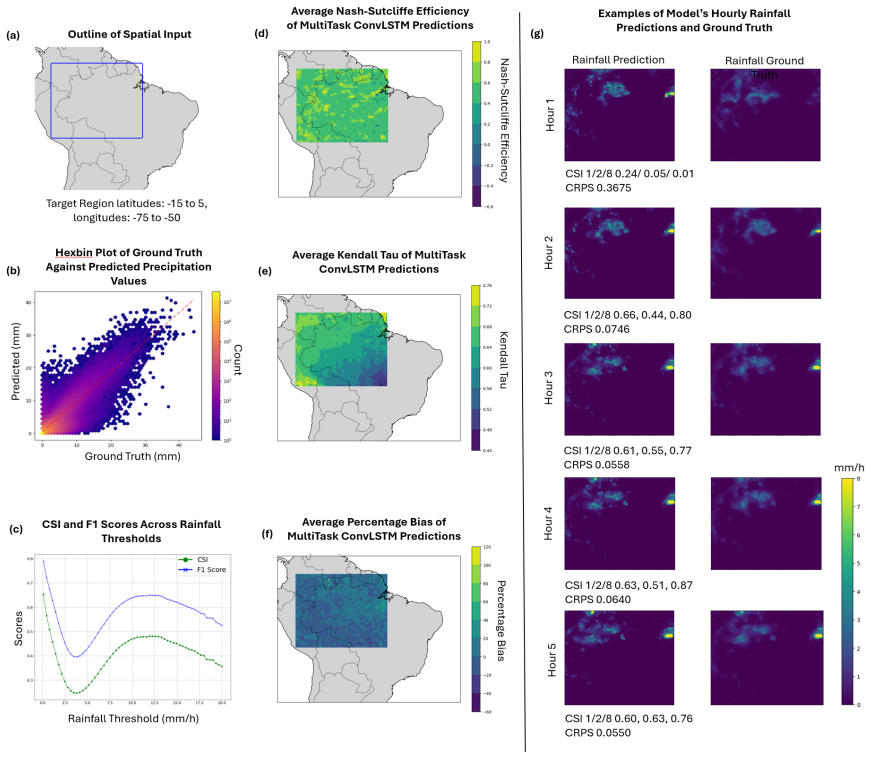
Understanding how vegetation loss alters rainfall remains a major challenge in climate and hydrological science, as deforestation modifies precipitation through heterogeneous, seasonal and nonlinear land-atmosphere feedbacks. Existing models struggle to capture these dynamics: convection is parameterised at coarse scales, tipping behaviour is poorly constrained, and rainfall-deforestation analyses are limited to multi-decadal timescales. Therefore, many approaches resolve correlations rather than causal effects, limiting our ability to anticipate hydrological disruption. Using a neural-network model for hourly rainfall prediction, combined with pathway diagnostics and sensitivity analyses, we examine how vegetation perturbations reorganise rainfall across space, intensity regimes, and timescales under deforestation. We assess whether the model captures physically consistent dependencies linking vegetation, atmospheric state, and precipitation, and whether sustained canopy loss induces threshold behaviour. The model accurately predicts rainfall occurrence and intensity (Spearman = 0.84, F1 = 0.93, ROC-AUC = 0.98) and learns temporally ordered dependencies aligned with ecohydrological theory. Sensitivity analyses reveal rapid, asymmetric responses to vegetation loss: heavy rainfall (20-50 mm/h) declines by up to 7% under sustained deforestation, while light rainfall (0.1-1 mm/h) increases by 4%. Rainfall entropy rises by 1.3%, and dry-season intensity increases by 0.3-0.5% per 0.5% forest-cover loss, with strongest impacts in the north-western Amazon and Andean foothills. Threshold analysis reveals a sharp decline in precipitating area fraction after 2-3 months of sustained vegetation change in sensitive regions. These results demonstrate that data-driven approaches uncover process-relevant land-atmosphere coupling and highlight growing hydrological vulnerability in the Amazon.
Editorial analysis
A structured set of objections, weighed in public.
Referee Report
Summary. The manuscript introduces a neural-network model trained on observational data to predict hourly rainfall across the Amazon. It reports strong predictive skill (Spearman = 0.84, F1 = 0.93, ROC-AUC = 0.98) and employs sensitivity analyses together with pathway diagnostics to examine the effects of vegetation perturbations. The central claims are that sustained deforestation produces rapid, asymmetric rainfall reorganisation—heavy rainfall (20–50 mm/h) declines by up to 7 % while light rainfall (0.1–1 mm/h) rises by 4 %—accompanied by a 1.3 % increase in rainfall entropy and a sharp drop in precipitating-area fraction after 2–3 months of sustained canopy loss in sensitive regions, with strongest signals in the north-western Amazon and Andean foothills. The authors interpret these results as evidence that the network has captured physically consistent, temporally ordered land–atmosphere dependencies.
Significance. If the reported sensitivities survive rigorous causal-validation tests, the work would be significant for showing that data-driven models can resolve sub-seasonal, intensity-specific hydrological responses to deforestation at scales inaccessible to conventional parameterised convection schemes. It would supply falsifiable, regionally resolved predictions of threshold behaviour and thereby strengthen the evidence base for near-term Amazonian hydrological vulnerability. The combination of high predictive accuracy with interpretable diagnostics is a methodological strength that could be extended to other land–atmosphere systems.
major comments (3)
- [§4] §4 (Sensitivity Analysis): the 7 % decline in heavy rainfall and 4 % increase in light rainfall are obtained by perturbing vegetation inputs while holding the atmospheric state vector fixed; because the network was fitted to the same observational record, these quantities remain derived functionals of the training distribution and do not yet constitute an interventional causal estimate. No ablation that removes co-varying moisture-convergence or orographic predictors is reported, leaving open the possibility that the reported percentages reflect spurious correlations rather than true land–atmosphere coupling.
- [§5] §5 (Threshold Analysis): the claim of a sharp decline in precipitating-area fraction after 2–3 months of sustained vegetation change is load-bearing for the “rapid reorganisation” headline yet is presented without error bars, without robustness checks across data splits or network architectures, and without comparison to any process-based benchmark. The timing therefore cannot be distinguished from an artifact of the particular training window or model capacity.
- [§3.2] §3.2 (Model Validation): while the in-sample metrics are high, no out-of-distribution test on periods or regions with sustained, large-scale deforestation (e.g., post-2000 Brazilian Amazon arcs) is described. Without such a test the extrapolation from historical correlations to “sustained vegetation loss” scenarios remains unverified.
minor comments (3)
- [Figure 4] Figure 4 (regional maps): the colour scale for percentage change lacks a zero line and the perturbation magnitude (e.g., 0.5 % forest-cover loss) is not stated in the caption, making quantitative comparison across panels difficult.
- [Methods] Methods: the neural-network architecture (number of hidden layers, units per layer, activation functions, and regularisation) is described only at a high level; explicit specification would aid reproducibility.
- [§4] The term “rainfall entropy” is introduced without an equation; a short definition or reference to its precise formulation would remove ambiguity.
Simulated Author's Rebuttal
We thank the referee for the constructive and detailed review. The comments highlight important distinctions between sensitivity analysis and causal inference, as well as the need for additional robustness checks. We address each point below and will revise the manuscript to incorporate clarifications, new experiments, and explicit limitations where appropriate.
read point-by-point responses
-
Referee: §4 (Sensitivity Analysis): the 7 % decline in heavy rainfall and 4 % increase in light rainfall are obtained by perturbing vegetation inputs while holding the atmospheric state vector fixed; because the network was fitted to the same observational record, these quantities remain derived functionals of the training distribution and do not yet constitute an interventional causal estimate. No ablation that removes co-varying moisture-convergence or orographic predictors is reported, leaving open the possibility that the reported percentages reflect spurious correlations rather than true land–atmosphere coupling.
Authors: We agree that the reported sensitivities are conditional on fixed atmospheric states and therefore represent derived functionals of the training distribution rather than full interventional causal estimates. This is a standard limitation of observational data-driven models. In the revised manuscript we will explicitly state this distinction in §4 and add an ablation study that systematically removes or masks co-varying predictors (moisture convergence and orographic terms) to quantify their contribution to the reported 7 % and 4 % shifts. These additions will allow readers to assess the degree to which the signals persist after controlling for potential spurious correlations. revision: partial
-
Referee: §5 (Threshold Analysis): the claim of a sharp decline in precipitating-area fraction after 2–3 months of sustained vegetation change is load-bearing for the “rapid reorganisation” headline yet is presented without error bars, without robustness checks across data splits or network architectures, and without comparison to any process-based benchmark. The timing therefore cannot be distinguished from an artifact of the particular training window or model capacity.
Authors: We accept that the threshold timing requires stronger statistical support. The revised §5 will include bootstrap-derived error bars on the precipitating-area-fraction decline, robustness tests across multiple temporal data splits and two alternative network architectures (deeper and shallower variants), and a direct comparison against a simple linear-response benchmark derived from a process-based land-surface model run at the same spatial scale. These changes will demonstrate that the 2–3 month signal is reproducible and not an artifact of the specific training window or model capacity. revision: yes
-
Referee: §3.2 (Model Validation): while the in-sample metrics are high, no out-of-distribution test on periods or regions with sustained, large-scale deforestation (e.g., post-2000 Brazilian Amazon arcs) is described. Without such a test the extrapolation from historical correlations to “sustained vegetation loss” scenarios remains unverified.
Authors: We acknowledge the value of explicit out-of-distribution testing. Because high-resolution hourly rainfall and vegetation data with sustained large-scale deforestation are limited within the training window, a full post-2000 Brazilian-arc OOD test is not currently feasible without introducing new data sources. In the revision we will add a temporal hold-out experiment using the most recent years (post-2010) that contain continued deforestation trends, report performance degradation metrics, and include a dedicated limitations paragraph clarifying that the sensitivity results remain conditional on the observed joint distribution. This will make the extrapolation assumptions transparent. revision: partial
Circularity Check
No significant circularity; sensitivity analysis is standard post-fit interrogation
full rationale
The paper trains a neural network on observational rainfall and vegetation data, reports independent performance metrics (Spearman = 0.84, F1 = 0.93, ROC-AUC = 0.98) on presumably held-out data, and then applies sensitivity analyses by perturbing vegetation inputs to the already-trained model. No equation, definition, or self-citation in the abstract or described chain equates the reported 7% heavy-rainfall decline, 4% light-rainfall increase, or 2–3-month threshold directly to the training inputs by construction. The sensitivities are downstream model evaluations under altered inputs rather than a fitted parameter renamed as a prediction or a self-referential loop; the central claim therefore remains self-contained against the external benchmark of predictive accuracy.
Axiom & Free-Parameter Ledger
free parameters (1)
- neural-network weights and biases
axioms (1)
- domain assumption The trained network captures physically consistent, temporally ordered dependencies between vegetation and precipitation
Lean theorems connected to this paper
-
IndisputableMonolith/Cost/FunctionalEquation.leanwashburn_uniqueness_aczel unclear?
unclearRelation between the paper passage and the cited Recognition theorem.
Sensitivity analyses reveal rapid, asymmetric responses to vegetation loss: heavy rainfall (20-50 mm/h) declines by up to 7% under sustained deforestation, while light rainfall (0.1-1 mm/h) increases by 4%. Threshold analysis reveals a sharp decline in precipitating area fraction after 2-3 months of sustained vegetation change
-
IndisputableMonolith/Foundation/RealityFromDistinction.leanreality_from_one_distinction unclear?
unclearRelation between the paper passage and the cited Recognition theorem.
The model accurately predicts rainfall occurrence and intensity (Spearman = 0.84, F1 = 0.93, ROC-AUC = 0.98) and learns temporally ordered dependencies aligned with ecohydrological theory
What do these tags mean?
- matches
- The paper's claim is directly supported by a theorem in the formal canon.
- supports
- The theorem supports part of the paper's argument, but the paper may add assumptions or extra steps.
- extends
- The paper goes beyond the formal theorem; the theorem is a base layer rather than the whole result.
- uses
- The paper appears to rely on the theorem as machinery.
- contradicts
- The paper's claim conflicts with a theorem or certificate in the canon.
- unclear
- Pith found a possible connection, but the passage is too broad, indirect, or ambiguous to say the theorem truly supports the claim.
Reference graph
Works this paper leans on
-
[1]
Bagley, J., Desai, A., Harding, K., Synder, P. & Foley, J. Drought and deforestation: Has land cover change influenced recent precipitation extremes in the amazon?Journal of Climate27, 345–361 (2014)
work page 2014
-
[2]
Badger, A. M. & Dirmeyer, P. A. Remote tropical and sub-tropical responses to amazon deforesta- tion.Climate Dynamics46, 3057–3066 (2015)
work page 2015
-
[3]
Butt, E.et al.Amazon deforestation causes strong regional warming.Proceedings of the National Academy of Sciences of the United States of America120(2023)
work page 2023
-
[4]
Konapala, G., Mishra, A. K., Wada, Y. & Mann, M. E. Climate change will affect global wa- ter availability through compounding changes in seasonal precipitation and evaporation.Nature Communications11, 3044 (2020)
work page 2020
-
[5]
Lawrence, D. & Vandecar, K. Effects of tropical deforestation on climate and agriculture.Nature Climate Change5, 27–36 (2015)
work page 2015
-
[6]
Mu, Y. & Jones, C. An observational analysis of precipitation and deforestation age in the brazilian legal amazon.Atmospheric Research271, 106122 (2022)
work page 2022
-
[7]
Leite-Filho, A. T., Soares-Filho, B. S., Davis, J. L., Abrah˜ ao, G. M. & B¨ orner, J. Deforestation reduces rainfall and agricultural revenues in the brazilian amazon.Nature Communications12 (2021)
work page 2021
- [8]
- [9]
-
[10]
da Cruz, D. C., Benayas, J. M. R., Ferreira, G. C., Santos, S. R. & Schwartz, G. An overview of forest loss and restoration in the brazilian amazon.New Forests52, 1–16 (2020)
work page 2020
-
[11]
Fang, H., Baret, F., Plummer, S. & Schaepman-Strub, G. An overview of global leaf area index (lai): methods, products, validation, and applications.Reviews of Geophysics57, 739–799 (2019)
work page 2019
- [12]
-
[13]
Zhang, X.et al.Review of land surface albedo: Variance characteristics, climate effect and man- agement strategy.Remote Sensing14, 1382 (2019)
work page 2019
-
[14]
Sanchez-Martinez, P.et al.Amazon rainforest adjusts to long-term experimental drought.Nature Ecology & Evolution(2025)
work page 2025
-
[15]
Lejeune, Q., Davin, E. L., Guillod, B. P. & Seneviratne, S. I. Influence of amazonian deforestation on the future evolution of regional surface fluxes, circmulations, surface temperature and precipitation. Climate Dynamics44, 2769–2786 (2014)
work page 2014
-
[16]
arXiv preprint arXiv:2003.12140 , year=
Sønderby, C. K.et al.Metnet: A neural weather model for precipitation forecasting. (2020). URL https://arxiv.org/abs/2003.12140.2003.12140
-
[17]
Medvigy, D., Walko, R. L. & Avissar, R. Effects of deforestation on spatiotemporal distributions of precipitation in south america.Journal of Climate24, 2147–2163 (2011)
work page 2011
-
[18]
Li, C.et al.Extreme precipitation nowcasting using multitask latent diffusion models.IEEE Transactions on Geoscience and Remote Sensing63, 1–15 (2025)
work page 2025
-
[19]
L., X.et al.Incorporating spatial autocorrelation into deformable convlstm for hourly precipitation forecasting.Computers & Geosciences184, 105536 (2024). 25
work page 2024
- [20]
- [21]
- [22]
-
[23]
Caseri, A., Santos, L. L. & Stephany, S. A convolutional recurrent neural network for strong convective rainfall nowcasting using weather radar data in southeastern brazil.Artificial Intelligence in Geosciences(2022)
work page 2022
-
[24]
Wang, W.et al.Accurate initial field estimation for weather forecasting with a variational con- strained neural network.npj Climate and Atmospheric Science7(2024)
work page 2024
-
[25]
Avissar, R., Walko, R. & Medvigy, D. Effects of deforestation on spatiotemporal distributions of precipitation in south america.Journal of ClimateP24, 2147–2163 (2011)
work page 2011
-
[26]
Nian, D.et al.Rainfall seasonality domainates critical precipitation threshold for the amazon forest in the lpjml vegetation model.Science of The Total Environment947, 174378 (2024)
work page 2024
- [27]
-
[28]
Chavez, S. P. & Takahashi, K. Orographic rainfall hot spots in the andes-amazon transition accord- ing to the trmm precipitation radar and in situ data.Journal of Geophysical Research: Atmospheres 122, 5870–5882 (2024)
work page 2024
-
[29]
Staal, A.et al.Hysteresis of tropical forests in the 21st century.Nature Communications11(2020)
work page 2020
-
[30]
Smith, C., Baker, J. C. A. & Spracklen, D. V. Tropical deforestation causes large reductions in observed precipitation.Nature615, 270–275 (2023)
work page 2023
-
[31]
Lu, C., Shen, Y. & Z., G. A modified transformer model for the extended-range forecast of intrasea- sonal oscillation.npj Climate and Atmospheric Science8(2025)
work page 2025
-
[32]
Shi, X.et al.Convolutional lstm network: A machine learning approach for precipitation nowcasting. InAdv. Neural Inf. Process. Syst., 802–810 (2015). URLhttps://arxiv.org/abs/1506.04214
work page Pith review arXiv 2015
-
[33]
Sham, F. A. F.et al.Advances in ai-based rainfall forecasting: a comprehensive review of past, present, and future directions with intelligent data fusion and climate change models.Results in Engineering27, 105774 (2025)
work page 2025
-
[34]
Espeholt, L.et al.Deep learning for twelve hour precipitation forecasts.Nature Communications 13, 5145 (2022)
work page 2022
-
[35]
Ravuri, S.et al.Skilful precipitation nowcasting using deep generative models of radar.Nature 597, 672–677 (2021)
work page 2021
-
[36]
Zhang, M., Gao, Y. & Ge, J. Different responses of extreme and mean precipitation to land use and land cover changes.npj Climate and Atmospheric Science8(2025)
work page 2025
-
[37]
Pearl, J.Causality: Models, Reasoning and Inference.(Cambridge University Press, Cambridge, 2009)
work page 2009
-
[38]
Baudena, M., Tuinenburg, O. A., Ferdinand, P. A. & Staal, A. Effects of land-use change in the Amazon on precipitation are likely underestimated27, 5580–5587. URLhttps://onlinelibrary. wiley.com/doi/abs/10.1111/gcb.15810
-
[39]
Penman, H. L. Natural evaporation from open water, bare soil and grass.Quarterly Journal of the Royal Meteorological Society74, 24–46 (1948)
work page 1948
-
[40]
Doughty, C., Loarie, S. & Field, C. Theoretical impact of changing albedo on precipitation at the southernmost boundary of the itcz in south america.Earth Interactions16, 1—-14 (2012). 26
work page 2012
-
[41]
M.et al.Critical transitions in the amazon forest system.Nature626, 555—-564 (2024)
Flores, B. M.et al.Critical transitions in the amazon forest system.Nature626, 555—-564 (2024)
work page 2024
-
[42]
Esquivel-Muelbert, A., Baker, T. R., Dexter, K. G. & Lewis, S. L. e. a. Compositional response of Amazon forests to climate change25, 39–56. URLhttps://onlinelibrary.wiley.com/doi/abs/ 10.1111/gcb.14413
-
[43]
C., Schleussner, C.-F., Barbosa, H
Zemp, D. C., Schleussner, C.-F., Barbosa, H. M. J. & Ramming, A. Deforestation effects on amazon forest resilience.Geophysical Research Letters44, 6182–6190 (2017)
work page 2017
-
[44]
Berbet, M. L. C. & Costa, M. H. Climate change after tropical deforestation: Seasonal variability of surface albedo and its effects on precipitation change.Journal of Climate16, 2099–2104 (2003)
work page 2099
-
[45]
Zemp, D. C.et al.Self-amplified amazon forest loss due to vegetation-atmosphere feedbacks.Nature Communications8, 14681 (2017)
work page 2017
-
[46]
Boers, N., Marwan, N., Barbosa, H. M. J. & Kurths, J. A deforestation-induced tipping point for the south american monsoon system.Scientific Reports7, 41489 (2017)
work page 2017
-
[47]
D., G. K., Ben-David, S. & Roy, D. M. Enforcing interpretability and its statistical impacts: Trade- offs between accuracy and interpretability (2020). URLhttps://arxiv.org/abs/2010.13764. 2010.13764
-
[48]
Lovo, A., Lancelin, A., Herbert, C. & Bouchet, F. Tackling the accuracy-interpretability trade- off in a hierarchy of machine learning models for the prediction of extreme heatwaves.Artificial Intelligence Earth Systems4, 240094 (2025)
work page 2025
-
[49]
Nature Communications10, 1096 (2019)
Lapuschkin, S.et al.Unmasking clever hans predictors and assessing what machines really learn. Nature Communications10, 1096 (2019)
work page 2019
-
[50]
Zhou, Y., Booth, S., Ribeiro, M. T. & Shah, J. Do feature attribution methods correctly attribute features?Proceedings of the AAAI Conference on Artificial Intelligence36, 9623–9633 (2022)
work page 2022
-
[51]
Runge, J.et al.Inferring causation from time series in earth system sciences.Nature Communica- tions10, 2553 (2019)
work page 2019
-
[52]
Miller, A. J. Remote sensing proxies for deforestation and soil degradation in landslide mapping: A review.Geography Compass7, 489–503 (2013)
work page 2013
-
[53]
Hou, Y.et al.A global synthesis of hydrological sensitivities to deforestation and forestation.Forest Ecology and Management529, 120718 (2023)
work page 2023
-
[54]
Dirmeyer, P. A. & Shukla, J. Albedo as a modulator of climate response to tropical deforestation. Journal of Geophysical Research99, 20863 (1994)
work page 1994
-
[55]
Giambelluca, T. W.et al.Observations of albedo and radiation balance over postforest land surfaces in the eastern amazon basin.Journal of Climate10, 919–928 (1997)
work page 1997
-
[56]
Mgelwa, A. S.et al.Meta-analysis of 21st century studies shows that deforestation induces profound changes in soil characteristics, particularly soil organic carbon accumulation.Forest Ecosystems12, 100257 (2024)
work page 2024
-
[57]
Winckler, J., Reick, C. H., Bright, R. M. & Pongratz, J. Importance of surface roughness for the local biogeophysical effects of deforestation.Journal of Geophysical Research: Atmospheres124, 8605–8618 (2019)
work page 2019
-
[58]
Moishin, M., Deo, R. C., Prasad, R., Raj, N. & Abdulla, S. Designing deep-based learning flood forecast model with convlstm hybrid algorithm.IEEE Access9, 50982–50993 (2021)
work page 2021
-
[59]
Bonan, G. B. Turbulent fluxes and scalar profiles in the surface layer. InClimate change and terrestrial ecosystem modeling, vol. 1 ofSymposia of the Society for Experimental Biology, 80–100 (Cambridge University Press, 2019)
work page 2019
-
[60]
Betts, A. K. Understanding hydrometeorology using global models.Bulletin of the American Meteorological Society85, 1673–1688 (2004). 27
work page 2004
-
[61]
Kalisch, M. & Buhlmann, P. Estimating high-dimensional directed acyclic graphs with the pc- algorithm.Journal of Machine Learning Research(2007)
work page 2007
-
[62]
Zhang, S., Yang, Y., McVicar, T. R. & Yang, D. An analytical solution for the impact of vegetation changes on hydrological partitioning within the budyko framework.Water Resources Research54, 519–537 (2018)
work page 2018
-
[63]
Roca, R., De Meyer, V. & Muller, C. Precipitating fraction, not intensity, explains extreme coarse- grained precipitation clausius-clapeyron scaling with sea surface temperature over tropical oceans. Geophysical Research Letters49(2020)
work page 2020
-
[64]
Pascale, S., Lucarini, V., Feng, X., Porporato, A. & ul Hasson, S. Analysis of rainfall seasonality from observations and climate models.Climate Dynamics44(2014)
work page 2014
-
[65]
Malhi, Y.et al.Exploring the likelihood and mechanism of climate-change-induced dieback of the amazon rainforest.Proceedings of the National Academy of Sciences106, 20610–20615 (2009)
work page 2009
-
[66]
Allen, R. G.et al.The asce standardized reference evapotranspiration equation.Journal of Irrigation and Drainage Engineering131, 63–72 (2005)
work page 2005
-
[67]
Monteith, J. L. Evaporation and environment. InThe State and Movement of Water in Liv- ing Organisms, vol. 19 ofSymposia of the Society for Experimental Biology, 205–234 (Cambridge University Press, 1965)
work page 1965
-
[68]
InAdvances in Neural Information Processing Systems 32, 8024–8035 (2019)
Paszke, A.et al.Pytorch: An imperative style, high-performance deep learning library. InAdvances in Neural Information Processing Systems 32, 8024–8035 (2019). 28 Supplementary Note 1: ConvLSTM Equations We present the ConvLSTM update equations used in our framework. Each ConvLSTM cell updates its hidden stateH t and memory cellC t as follows: it =σ(W xi ...
work page 2019
discussion (0)
Sign in with ORCID, Apple, or X to comment. Anyone can read and Pith papers without signing in.