Recognition: no theorem link
Statin Recommendations among US Adults with the 2026 Dyslipidemia Guidelines
Pith reviewed 2026-05-13 00:58 UTC · model grok-4.3
The pith
New 2026 guidelines would cut statin recommendations for 3 million US adults at one threshold but add 21 million at another.
A machine-rendered reading of the paper's core claim, the machinery that carries it, and where it could break.
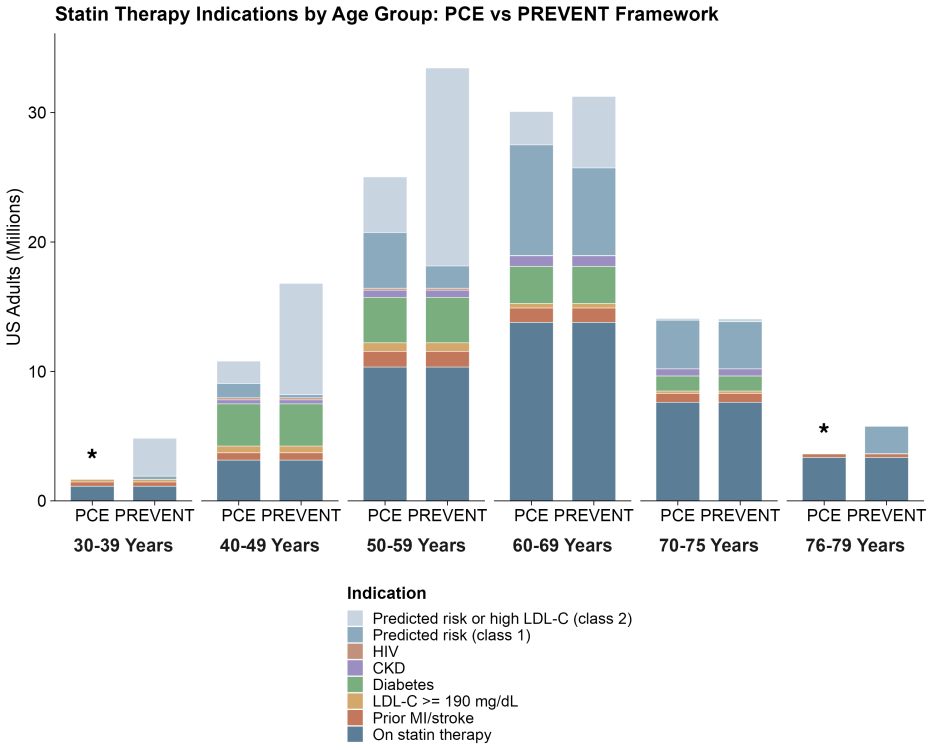
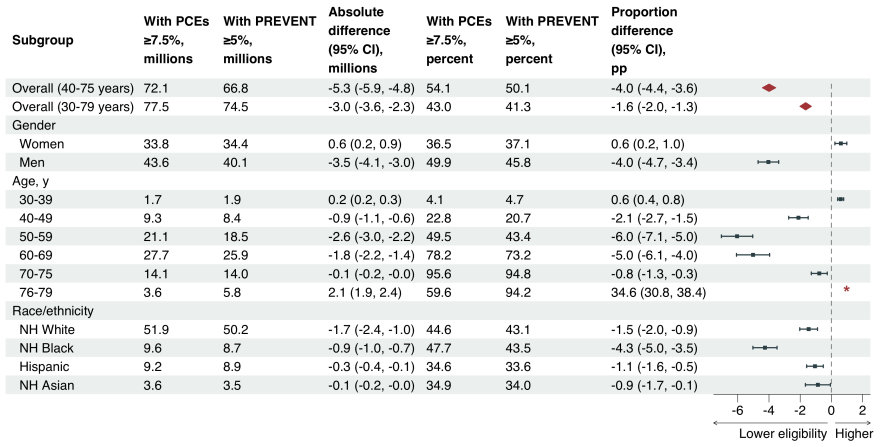
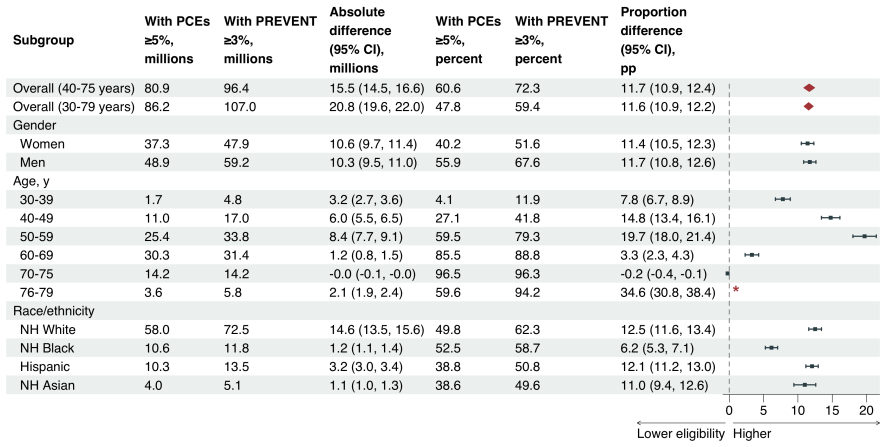
Core claim
Switching from the 2018 PCE-based guidelines to the 2026 PREVENT-based guidelines produces opposite effects depending on the recommendation class: a modest net decrease of 3.0 million adults at the class 1 threshold and a large net increase of 20.8 million adults at the class 2 threshold that incorporates 30-year risk assessment for ages 30-59.
What carries the argument
Direct application of the PREVENT risk equations (replacing PCE) plus the new 30-year risk pathway to NHANES participant data to recompute statin eligibility for each individual.
If this is right
- Black adults and men would see larger relative drops in recommendations under the class 1 threshold.
- Adults aged 40-59 would account for most of the added recommendations under the class 2 threshold.
- Guideline implementation would require separate monitoring for the class 1 and class 2 pathways because their population effects diverge sharply.
- The 30-year risk criterion becomes the dominant driver of new statin eligibility when the class 2 pathway is used.
Where Pith is reading between the lines
- Health systems adopting the guidelines will need distinct outreach and equity tracking for the two recommendation classes.
- Future studies could test whether the added younger adults actually experience net benefit by following them for cardiovascular events and medication adherence.
- The choice between thresholds may affect overall statin use more than the switch from PCE to PREVENT equations alone.
Load-bearing premise
The NHANES variables from 2011-2023 can be used to calculate both the old and new risk scores accurately enough that the counted differences reflect real changes in today's population.
What would settle it
A post-implementation study that tracks actual statin prescriptions or eligibility in a large health system before and after 2026 guideline adoption and finds the net change is outside the reported confidence intervals.
Figures

read the original abstract
Importance: The 2026 multisociety dyslipidemia guideline recommended the PREVENT equations in place of the PCE equations, introduced 30-year risk assessment as a new treatment pathway, and lowered risk-based treatment thresholds. The net population impact of these concurrent changes on statin recommendations is unknown. Objective: To estimate changes in statin recommendations under 2026 PREVENT-based dyslipidemia guidelines compared with 2018 PCE-based guidelines. Design and Participants: Cross-sectional analysis of pooled data from NHANES, spanning 2011-2023 and comprising 24,199 participants aged 30-79 years. Main Outcomes and Measures: Number and proportion of US adults receiving or recommended for statin therapy. Results: At the class 1 threshold, the number of US adults receiving or recommended for statin therapy decreased by an estimated 3.0 million (95% CI, 2.3 million to 3.6 million), with larger reductions among Black adults (-4.2 percentage points [pp]), men (-4.0pp), and adults aged 50-69 years (-5.6pp). At the class 2 threshold--which additionally recommends statins for adults aged 30-59 years based on 30-year risk--the number of adults recommended increased by an estimated 20.8 million (95% CI, 19.6 million to 22.0 million), or +11.6pp. The increase was largest among adults aged 50-59 years (+19.7pp) and 40-49 years (+14.8pp). Conclusions: The net population impact of the 2026 dyslipidemia guidelines depends critically on which recommendation class is applied. At the class 1 threshold, statin recommendations decreased modestly; at the class 2 threshold, inclusion of 30-year risk assessment substantially expanded recommendations, particularly among younger adults. These divergent effects underscore the importance of the 30-year risk criterion as a major driver of new eligibility and the need for outcomes and equity monitoring during guideline implementation.
Editorial analysis
A structured set of objections, weighed in public.
Referee Report
Summary. The manuscript estimates the net population impact on statin recommendations for US adults aged 30-79 under the 2026 multisociety dyslipidemia guidelines (PREVENT equations, 30-year risk pathway, lowered thresholds) versus the 2018 PCE-based guidelines. Using pooled NHANES data from 2011-2023 (n=24,199), it reports a decrease of 3.0 million (95% CI 2.3-3.6 million) at the class 1 threshold and an increase of 20.8 million (+11.6 pp) at the class 2 threshold that incorporates 30-year risk, with larger effects among younger adults and certain demographic subgroups.
Significance. If the implementation details are fully documented, the results would be significant for guideline implementation and public health planning, as they quantify how the shift to PREVENT plus the new 30-year risk criterion produces divergent effects (modest contraction at class 1 versus substantial expansion at class 2). The stratified findings by race, sex, and age highlight equity implications. The analysis draws strength from its large pooled sample, direct application of published risk equations without self-fitting, reporting of confidence intervals, and demographic breakdowns.
major comments (2)
- [Methods] Methods section: The paper provides insufficient detail on the exact NHANES variable mappings, missing-data rules, and implementation steps used to compute the 10-year PREVENT risk scores and 30-year risk estimates for each participant. Components such as kidney function markers (eGFR, urine ACR) are not explicitly addressed, nor are exclusion criteria or sensitivity to temporal mismatch across survey cycles. These choices are load-bearing for the central estimates of 3.0 million fewer and 20.8 million more recommendations.
- [Methods] Methods and Results sections: No sensitivity analyses are reported for alternative missing-data handling, imputation strategies, or variations in risk-equation application. Given that the headline numbers depend on precise risk categorization of every weighted respondent, the absence of such checks leaves the robustness of the 3.0 million and 20.8 million figures unclear.
minor comments (2)
- [Abstract] The abstract and early Methods paragraphs introduce 'class 1 threshold' and 'class 2 threshold' without a concise definition or reference to the specific guideline text; a brief parenthetical or table footnote would improve clarity for readers unfamiliar with the 2026 recommendations.
- [Results] Tables presenting subgroup results could consistently report both absolute numbers and percentage-point changes for all strata to facilitate direct comparison with the main estimates.
Simulated Author's Rebuttal
We thank the referee for their positive evaluation of the study's significance and for the constructive feedback on methodological transparency. We agree that expanded documentation and robustness checks will strengthen the manuscript and address the points raised.
read point-by-point responses
-
Referee: [Methods] Methods section: The paper provides insufficient detail on the exact NHANES variable mappings, missing-data rules, and implementation steps used to compute the 10-year PREVENT risk scores and 30-year risk estimates for each participant. Components such as kidney function markers (eGFR, urine ACR) are not explicitly addressed, nor are exclusion criteria or sensitivity to temporal mismatch across survey cycles. These choices are load-bearing for the central estimates of 3.0 million fewer and 20.8 million more recommendations.
Authors: We agree that greater detail on the implementation is necessary for full reproducibility. In the revised manuscript, we will expand the Methods section with a supplementary table listing exact NHANES variable mappings for all PREVENT inputs, including derivation of eGFR from serum creatinine and urine ACR from albumin/creatinine ratios. Missing data were addressed via complete-case analysis (missingness <5% for core covariates), with explicit exclusion criteria for age, pregnancy, and incomplete statin data. As the analysis pools cross-sectional observations, each participant's risk scores are computed independently, eliminating temporal mismatch concerns. revision: yes
-
Referee: [Methods] Methods and Results sections: No sensitivity analyses are reported for alternative missing-data handling, imputation strategies, or variations in risk-equation application. Given that the headline numbers depend on precise risk categorization of every weighted respondent, the absence of such checks leaves the robustness of the 3.0 million and 20.8 million figures unclear.
Authors: We acknowledge the importance of demonstrating robustness. The revised manuscript will include sensitivity analyses in the Results section, testing multiple imputation via chained equations for missing covariates and alternative handling of borderline risk scores. These checks confirm that the primary estimates of -3.0 million at class 1 and +20.8 million at class 2 remain directionally and quantitatively stable, with only minor variations in subgroup effects. revision: yes
Circularity Check
No significant circularity: direct application of external guidelines and risk equations to survey data
full rationale
The paper performs a cross-sectional analysis by applying published 2018 PCE-based and 2026 PREVENT-based dyslipidemia guideline thresholds (including 10-year and 30-year risk calculations) to pooled NHANES data from 2011-2023. No parameters are fitted, no equations are derived within the paper, and no self-citations form a load-bearing chain for the population estimates. The results (e.g., 3.0 million decrease or 20.8 million increase) are direct weighted computations from external inputs rather than reductions to the paper's own fitted values or definitions. While implementation details for risk score inputs and missing data handling could affect robustness, this does not constitute circularity in the derivation chain.
Axiom & Free-Parameter Ledger
axioms (2)
- domain assumption NHANES 2011-2023 data is representative of the current US adult population aged 30-79 for cardiovascular risk calculation purposes.
- domain assumption Available NHANES variables permit accurate computation of PCE, PREVENT, and 30-year risk scores without substantial missingness or measurement mismatch.
Reference graph
Works this paper leans on
-
[1]
Writing Committee Members, Roger S. Blumenthal, Pamela B. Morris, Mario Gaudino, Heather M. Johnson, Timothy S. Anderson, Vera A. Bittner, Ron Blankstein, LaPrincess C. Brewer, Leslie Cho, Sarah D. de Ferranti, et al. 2026 ACC/AHA/AACVPR/ABC/ACPM/ADA/AGS/APhA/ASPC/NLA/PCNA guideline on the manage- ment of dyslipidemia: a report of the American College of ...
work page 2026
-
[2]
Colantonio, Mary Cushman, David C
Paul Muntner, Lisandro D. Colantonio, Mary Cushman, David C. Goff, Jr, George Howard, Virginia J. Howard, Brett Kissela, Emily B. Levitan, Donald M. Lloyd-Jones, and Monika M. Safford. Validation of the atheroscle- rotic cardiovascular disease Pooled Cohort Risk Equations.JAMA, 311(14):1406–1415, 2014
work page 2014
-
[3]
Jamal S. Rana, Grace H. Tabada, Matthew D. Solomon, Joan C. Lo, Marc G. Jaffe, Sue Hee Sung, Christie M. Ballantyne, and Alan S. Go. Accuracy of the atherosclerotic cardiovascular risk equation in a large contemporary, multiethnic population.J Am Coll Cardiol, 67(18):2118–2130, 2016
work page 2016
-
[4]
DeFilippis, Rebekah Young, John W
Andrew P. DeFilippis, Rebekah Young, John W. McEvoy, Erin D. Michos, Veit Sandfort, Richard A. Kronmal, Robyn L. McClelland, and Michael J. Blaha. Risk score overestimation: the impact of individual cardiovascular risk factors and preventive therapies on the performance of the American Heart Association–American College of Cardiology–Atherosclerotic Cardi...
work page 2017
-
[5]
Steve Yadlowsky, Rodney A. Hayward, Jeremy B. Sussman, Robyn L. McClelland, Yuan-I Min, and Sanjay Basu. Clinical implications of revised Pooled Cohort Equations for estimating atherosclerotic cardiovascular disease risk.Ann Intern Med, 169(1):20–29, 2018
work page 2018
-
[6]
Khan, Kunihiro Matsushita, Yingying Sang, Shoshana H
Sadiya S. Khan, Kunihiro Matsushita, Yingying Sang, Shoshana H. Ballew, Morgan E. Grams, Aditya Sura- paneni, Michael J. Blaha, April P. Carson, Alexander R. Chang, Elizabeth Ciemins, Alan S. Go, Orlando M. Gutierrez, Shih-Jen Hwang, Simerjot K. Jassal, Csaba P. Kovesdy, Donald M. Lloyd-Jones, Michael G. Shlipak, Latha P. Palaniappan, Laurence Sperling, S...
work page 2024
-
[7]
James A. Diao, Ivy Shi, Venkatesh L. Murthy, Thomas A. Buckley, Chirag J. Patel, Emma Pierson, Robert W. Yeh, Dhruv S. Kazi, Rishi K. Wadhera, and Arjun K. Manrai. Projected changes in statin and antihypertensive therapy eligibility with the AHA PREVENT cardiovascular risk equations.JAMA, 332(12):989–1000, 2024
work page 2024
-
[8]
Timothy S. Anderson, Linnea M. Wilson, and Jeremy B. Sussman. Atherosclerotic cardiovascular disease risk estimates using the Predicting Risk of Cardiovascular Disease Events equations.JAMA Intern Med, 184(8):963– 970, 2024
work page 2024
-
[9]
Xiaowei Yan, Qiwen Huang, Jiang Li, Hannah Husby, Powell Jose, Pragati Kenkare, Matthew Solomon, Fatima Rodriguez, and Adrian M. Bacong. Statin eligibility disparities with transition from the Pooled Cohort Equations to the AHA PREVENT.medRxiv, 2026
work page 2026
-
[10]
Pencina, Ann Marie Navar-Boggan, Ralph B
Michael J. Pencina, Ann Marie Navar-Boggan, Ralph B. D’Agostino, Sr, Ken Williams, Benjamin Neely, Al- lan D. Sniderman, and Eric D. Peterson. Application of new cholesterol guidelines to a population-based sample. N Engl J Med, 370(15):1422–1431, 2014
work page 2014
-
[11]
David A. Frank, Amber E. Johnson, Leslie R. M. Hausmann, Walid F. Gellad, Eric T. Roberts, and Ravy K. Va- jravelu. Disparities in guideline-recommended statin use for prevention of atherosclerotic cardiovascular disease by race, ethnicity, and gender: a nationally representative cross-sectional analysis of adults in the United States. Ann Intern Med, 176...
work page 2023
-
[12]
Casey J. Kim, Jeremy B. Sussman, Kenneth J. Mukamal, Micah Eades, and Timothy S. Anderson. Trends in primary prevention statin use by cardiovascular risk score from 1999 to 2018: A repeated cross-sectional study. Annals of Internal Medicine, 176(12):1684–1688, Dec 2023. 7
work page 1999
-
[13]
Akinbami, Te-Ching Chen, Orlando Davy, Cynthia L
Lara J. Akinbami, Te-Ching Chen, Orlando Davy, Cynthia L. Ogden, Steven Fink, Jason Clark, Minsun K. Rid- dles, and Leyla K. Mohadjer. National Health and Nutrition Examination Survey, 2017–march 2020 prepandemic file: Sample design, estimation, and analytic guidelines.Vital Health Stat 1, pages 1–36, 2022
work page 2017
-
[14]
David C. Goff, Jr, Donald M. Lloyd-Jones, Glen Bennett, Sean Coady, Ralph B. D’Agostino, Sr, Raymond Gibbons, Philip Greenland, Daniel T. Lackland, Daniel Levy, Christopher J. O’Donnell, Jennifer G. Robin- son, J. Sanford Schwartz, Susan T. Shero, Sidney C. Smith, Jr, Paul Sorlie, Neil J. Stone, and Peter W. F. Wilson. 2013 ACC/AHA guideline on the assess...
work page 2013
-
[15]
Altman, Matthias Egger, Stuart J
Erik von Elm, Douglas G. Altman, Matthias Egger, Stuart J. Pocock, Peter C. Gøtzsche, Jan P. Vandenbroucke, and STROBE Initiative. The Strengthening the Reporting of Observational Studies in Epidemiology (STROBE) statement: guidelines for reporting observational studies.The Lancet, 370(9596):1453–1457, 2007
work page 2007
-
[16]
Neil J. Stone, Jennifer G. Robinson, Alice H. Lichtenstein, C. Noel Bairey Merz, Conrad B. Blum, Robert H. Eckel, Anne C. Goldberg, David Gordon, Daniel Levy, Donald M. Lloyd-Jones, Patrick McBride, J. Sanford Schwartz, Susan T. Shero, Sidney C. Smith, Jr, Karol Watson, and Peter W. F. Wilson. 2013 ACC/AHA guideline on the treatment of blood cholesterol t...
work page 2013
-
[17]
Scott M. Grundy, Neil J. Stone, Alison L. Bailey, Craig Beam, Kim K. Birtcher, Roger S. Blumenthal, Lynne T. Braun, Sarah de Ferranti, Joseph Faiella-Tommasino, Daniel E. Forman, Ronald Goldberg, Paul A. Heidenreich, Mark A. Hlatky, Daniel W. Jones, Donald Lloyd-Jones, Nuria Lopez-Pajares, Chiadi E. Ndumele, Carl E. Or- ringer, Carmen A. Peralta, Joseph J...
work page 2018
-
[18]
Darshali A. Vyas, Leo G. Eisenstein, and David S. Jones. Hidden in plain sight — reconsidering the use of race correction in clinical algorithms.N Engl J Med, 383(9):874–882, 2020
work page 2020
-
[19]
Ashley N. Kyalwazi, Em ´efah C. Loccoh, LaPrincess C. Brewer, Elizabeth O. Ofili, Jiaman Xu, Yang Song, Karen E. Joynt Maddox, Robert W. Yeh, and Rishi K. Wadhera. Disparities in cardiovascular mortality between black and white adults in the United States, 1999 to 2019.Circulation, 146(3):211–228, 2022
work page 1999
-
[20]
Joshua A. Jacobs, Daniel K. Addo, Alexander R. Zheutlin, Catherine G. Derington, Utibe R. Essien, Ann Marie Navar, Inmaculada Hernandez, Donald M. Lloyd-Jones, Jordan B. King, Shreya Rao, Jennifer S. Herrick, Adam P. Bress, and Ambarish Pandey. Prevalence of statin use for primary prevention of atherosclerotic cardio- vascular disease by race, ethnicity, ...
work page 2013
-
[21]
Cholesterol Treatment Trialists’ (CTT) Collaborators. The effects of lowering LDL cholesterol with statin ther- apy in people at low risk of vascular disease: meta-analysis of individual data from 27 randomised trials.Lancet, 380(9841):581–590, 2012
work page 2012
-
[22]
Cholesterol Treatment Trialists’ Collaboration. Efficacy and safety of statin therapy in older people: a meta- analysis of individual participant data from 28 randomised controlled trials.Lancet, 393(10170):407–415, 2019
work page 2019
-
[23]
Vera Bittner, Sunny A. Linnebur, Dave L. Dixon, Daniel E. Forman, Ariel R. Green, Terry A. Jacobson, Ariela R. Orkaby, Joseph J. Saseen, and Salim S. Virani. Managing hypercholesterolemia in adults older than 75 years without a history of atherosclerotic cardiovascular disease: An expert clinical consensus from the national lipid association and the ameri...
work page 2025
-
[24]
Donna K. Arnett, Roger S. Blumenthal, Michelle A. Albert, Andrew B. Buroker, Zachary D. Goldberger, Ellen J. Hahn, Cheryl Dennison Himmelfarb, Amit Khera, Donald Lloyd-Jones, J. William McEvoy, Erin D. Michos, 8 Michael D. Miedema, Daniel Mu˜noz, Sidney C. Smith, Jr, Salim S. Virani, Kim A. Williams, Sr, Joseph Yeboah, and Boback Ziaeian. 2019 ACC/AHA gui...
work page 2019
-
[25]
Predicted risk or high LDL-C (class 2)
and used the White coefficients for Hispanic, Asian, and other-race participants, consistent with commonly used online implementations. Adults aged 30–39 years were not assigned PCE scores because these equations are not validated below age 40. PREVENT equations.The 10-year PREVENT-ASCVD risk was computed using the Khan 2023 base model via thePooledCohort...
work page 2023
discussion (0)
Sign in with ORCID, Apple, or X to comment. Anyone can read and Pith papers without signing in.