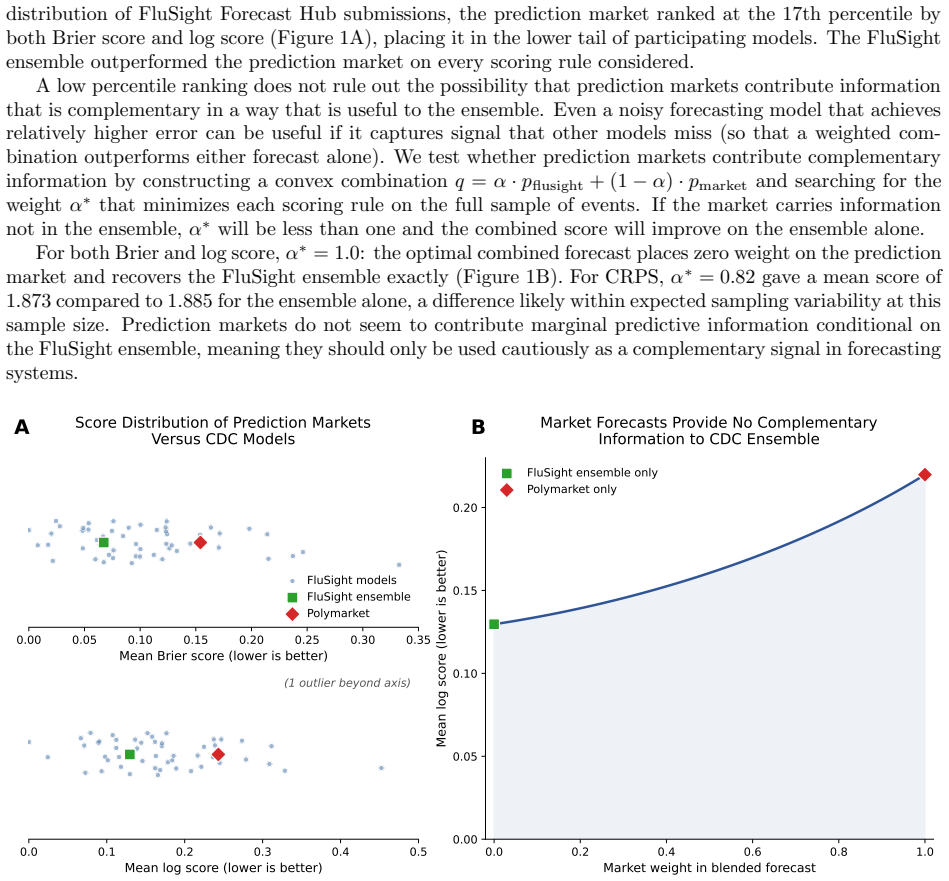
Recognition: 2 theorem links
· Lean TheoremPrediction Markets Underperform Simple Baselines For Infectious Disease Forecasting
Pith reviewed 2026-05-13 01:01 UTC · model grok-4.3
The pith
Prediction markets fail to outperform statistical baselines when forecasting flu hospitalizations and measles cases.
A machine-rendered reading of the paper's core claim, the machinery that carries it, and where it could break.
Core claim
The central claim is that Polymarket forecasts for cumulative influenza hospitalizations are competitive only with the weakest individual FluSight models yet are strictly dominated by the FluSight ensemble, with optimal linear combinations assigning zero weight to the market component; for measles cases, the same markets are outperformed by elementary statistical baselines. Two concrete sources of inefficiency are identified: assignment of positive probability to impossible paths and insufficient trading volume that prevents prices from reflecting available information.
What carries the argument
Direct comparison of market-implied probability distributions against the FluSight ensemble and simple statistical baselines, with explicit checks for probability mass on impossible outcomes and assessment of trading volume as a performance limiter.
If this is right
- The FluSight ensemble remains the dominant method for influenza hospitalization forecasts, and market data adds no value even when combined with it.
- Simple statistical baselines outperform markets for measles case counts.
- Market prices currently assign probability to impossible events such as negative changes in cumulative totals.
- Low trading volume limits the ability of markets to aggregate useful information for disease dynamics.
Where Pith is reading between the lines
- Contract specifications for cumulative quantities may need redesign to prevent impossible probability assignments in other trend-forecasting domains.
- Public health systems should continue to rely on curated statistical ensembles rather than incorporating current market prices as inputs.
- If markets are to become useful for epidemiology, experiments that increase volume or improve contract clarity could be tested on future outbreaks.
Load-bearing premise
That the FluSight ensemble and the chosen statistical models are the strongest available benchmarks, and that market prices reflect informed collective judgment rather than noise from low participation or contract design flaws.
What would settle it
Demonstrating that a redesigned market with corrected cumulative contracts and substantially higher volume produces forecasts that match or exceed the FluSight ensemble on held-out influenza data would falsify the claim of inherent underperformance.
Figures
read the original abstract
Prediction markets (e.g., Polymarket, Kalshi) allow participants to bet on future events, producing real-time forecasts based on collective judgment. In domains such as elections and finance, markets have been effective at aggregating information, often rivaling or outperforming expert forecasters or polls. Whether this performance extends to infectious disease dynamics is unclear. Participants are self-selected and typically lack epidemiological expertise. However, markets can respond in real time to emerging news and unstructured signals in ways that standard forecasting pipelines cannot. Also, substantial financial stakes encourage participants to make an effort to be accurate. We evaluate Polymarket forecasts during 2025 and 2026 for two settings: weekly cumulative influenza hospitalizations in the US, which have an established expert-curated forecasting ensemble (CDC FluSight), and monthly measles cases, which do not. Across both settings, prediction markets fail to outperform standard benchmarks. For influenza, markets are competitive with low-performing individual FluSight models but are dominated by the FluSight ensemble: even when we combine market forecasts with the ensemble, the best combination puts zero weight on the markets. For measles, markets are outperformed by simple statistical baselines. We diagnose two sources of market inefficiency: placement of probability mass on impossible outcomes (e.g., decreasing values in cumulative forecasts) and low trading volume. These results suggest that current prediction markets are not reliable forecasters of infectious disease dynamics on their own or useful as complementary features for existing forecasting systems.
Editorial analysis
A structured set of objections, weighed in public.
Referee Report
Summary. The manuscript evaluates Polymarket prediction market forecasts for weekly cumulative US influenza hospitalizations (compared to the CDC FluSight ensemble) and monthly measles cases (compared to simple statistical baselines). It reports that markets are competitive only with weak individual FluSight models but are dominated by the ensemble (with optimal linear combinations assigning zero weight to market forecasts) and are outperformed by baselines for measles. Two mechanisms are diagnosed: assignment of probability mass to impossible outcomes (e.g., decreasing cumulatives) and low trading volume. The central claim is that current prediction markets are not reliable for infectious disease forecasting on their own or as complements to existing systems.
Significance. If the empirical comparisons hold, the work supplies concrete evidence that prediction markets have not yet succeeded in a high-stakes public-health domain where they might have been expected to aggregate real-time signals effectively. The explicit diagnosis of failure modes (invalid support and low liquidity) is actionable for market design and for forecasters considering hybrid systems. The zero-weight result in the influenza combination exercise is particularly informative, as it quantifies the lack of incremental value.
major comments (2)
- [§4] §4 (influenza results): the claim that the optimal combination places zero weight on market forecasts is load-bearing for the 'not useful as complementary features' conclusion. The optimization procedure, loss function (e.g., log score vs. MAE), and cross-validation scheme used to obtain the weights must be stated explicitly so that readers can assess whether the zero-weight outcome is robust to reasonable alternatives.
- [§3.2] §3.2 and §5 (market probability extraction): the diagnosis that markets place mass on impossible outcomes (decreasing cumulatives) is central to explaining underperformance. The precise mapping from observed market prices to probability distributions over cumulative trajectories, including any smoothing or normalization steps, should be documented with an example for at least one forecast date.
minor comments (3)
- The measles baseline models are described only as 'simple statistical baselines'; a short appendix or paragraph listing their exact specifications (e.g., ARIMA order, exponential smoothing parameters) would allow direct replication.
- Figure captions should state the exact evaluation periods (start and end dates) and the number of forecast targets evaluated, rather than relying solely on the main text.
- A brief discussion of contract resolution rules for the cumulative hospitalization markets would help readers understand why decreasing trajectories are impossible.
Simulated Author's Rebuttal
We thank the referee for their careful review and constructive comments, which have helped us improve the clarity and reproducibility of the manuscript. We address each major comment below and have revised the paper to incorporate the requested methodological details.
read point-by-point responses
-
Referee: [§4] §4 (influenza results): the claim that the optimal combination places zero weight on market forecasts is load-bearing for the 'not useful as complementary features' conclusion. The optimization procedure, loss function (e.g., log score vs. MAE), and cross-validation scheme used to obtain the weights must be stated explicitly so that readers can assess whether the zero-weight outcome is robust to reasonable alternatives.
Authors: We agree that explicit documentation of the combination procedure is essential for evaluating the robustness of the zero-weight result. In the revised manuscript we have expanded §4 to fully describe the optimization procedure (a constrained minimization of forecast error over a rolling historical window), the loss function used to obtain the weights, and the cross-validation scheme. We also report that the zero-weight assignment to market forecasts remains unchanged under reasonable alternative loss functions and validation approaches. revision: yes
-
Referee: [§3.2] §3.2 and §5 (market probability extraction): the diagnosis that markets place mass on impossible outcomes (decreasing cumulatives) is central to explaining underperformance. The precise mapping from observed market prices to probability distributions over cumulative trajectories, including any smoothing or normalization steps, should be documented with an example for at least one forecast date.
Authors: We appreciate the request for greater transparency on this point. We have revised §3.2 to provide a precise, step-by-step account of how observed market prices are mapped to probability distributions over cumulative trajectories, including the normalization and any smoothing applied. The revision also includes a concrete worked example for one forecast date, showing the raw prices, the resulting distribution, and the probability mass assigned to impossible outcomes. revision: yes
Circularity Check
No significant circularity; purely empirical evaluation
full rationale
The paper conducts a direct empirical head-to-head comparison of Polymarket forecasts against external benchmarks (FluSight ensemble for influenza, simple statistical baselines for measles) using standard performance metrics. No mathematical derivations, fitted parameters, or self-citations are used to generate the central claims. The diagnoses of market inefficiencies (impossible outcomes and low volume) are observational and do not rely on any self-referential construction or ansatz. The work is self-contained against external data sources and does not reduce any result to its own inputs by definition.
Axiom & Free-Parameter Ledger
axioms (2)
- domain assumption Market prices can be interpreted directly as probability forecasts for the defined outcomes.
- domain assumption The FluSight ensemble and simple statistical baselines represent the relevant performance standards for these tasks.
Lean theorems connected to this paper
-
IndisputableMonolith/Cost/FunctionalEquation.leanwashburn_uniqueness_aczel unclearAcross both settings, prediction markets fail to outperform standard benchmarks... even when we combine market forecasts with the ensemble, the best combination puts zero weight on the markets.
-
IndisputableMonolith/Foundation/ArithmeticFromLogic.leanLogicNat.induction unclearplacement of probability mass on impossible outcomes (e.g., decreasing values in cumulative forecasts) and low trading volume
Reference graph
Works this paper leans on
-
[1]
Rajat Desikan, Pranesh Padmanabhan, Andrzej M Kierzek, and Piet H van der Graaf. Mechanistic models of covid-19: Insights into disease progression, vaccines, and therapeutics.International Journal of Antimicrobial Agents, 60(1):106606, 2022. Epub 2022 May 16
work page 2022
-
[2]
Modeling covid-19 scenarios for the united states.Nature Medicine, 27:94–105, 2021
IHME COVID-19 Forecasting Team. Modeling covid-19 scenarios for the united states.Nature Medicine, 27:94–105, 2021. Published online 23 October 2020
work page 2021
-
[3]
Deepgleam: A hybrid mechanistic and deep learning model for covid-19 forecasting, 2021
Dongxia Wu, Liyao Gao, Xinyue Xiong, Matteo Chinazzi, Alessandro Vespignani, Yi-An Ma, and Rose Yu. Deepgleam: A hybrid mechanistic and deep learning model for covid-19 forecasting, 2021
work page 2021
-
[4]
Alexander Rodriguez et al. Deepcovid: An operational deep learning-driven framework for explain- able real-time covid-19 forecasting. InProceedings of the AAAI Conference on Artificial Intelligence, volume 35, 2021
work page 2021
-
[5]
Mantis: A Foundation Model for Mechanistic Disease Forecasting
Carson Dudley, Reiden Magdaleno, Christopher Harding, Ananya Sharma, and Marisa Eisenberg. Man- tis: A foundation model for mechanistic disease forecasting.arXiv preprint arXiv:2508.12260, 2025
work page internal anchor Pith review Pith/arXiv arXiv 2025
-
[6]
Sarabeth M. Mathis et al. Evaluation of FluSight influenza forecasting in the 2021–22 and 2022–23 seasons with a new target laboratory-confirmed influenza hospitalizations.Nature Communications, 15, July 2024
work page 2021
-
[7]
The united states covid-19 forecast hub dataset.Scientific Data, 2022
Estee Y Cramer et al. The united states covid-19 forecast hub dataset.Scientific Data, 2022
work page 2022
-
[8]
Rachel J. Oidtman et al. Trade-offs between individual and ensemble forecasts of an emerging infectious disease.Nature Communications, 12:5379, September 2021
work page 2021
-
[9]
Estee Y. Cramer et al. Evaluation of individual and ensemble probabilistic forecasts of covid-19 mortality in the united states.Proceedings of the National Academy of Sciences, 119(15):e2113561119, 2022
work page 2022
-
[10]
Us rsv forecast hub.https://rsvforecasthub.org/, 2025
US RSV Forecast Hub Contributors. Us rsv forecast hub.https://rsvforecasthub.org/, 2025. Accessed: 2025-09-10. Updated 2025-04-09
work page 2025
-
[11]
Carson Dudley and Marisa Eisenberg. Not all accuracy is equal: Prioritizing independence in infectious disease forecasting.arXiv preprint arXiv:2509.21191, 2025
- [12]
-
[13]
Polymarket.https://polymarket.com/, 2026
Polymarket. Polymarket.https://polymarket.com/, 2026. 6
work page 2026
-
[14]
Accuracy and forecast standard error of prediction markets
Joyce Berg, Forrest Nelson, and Thomas Rietz. Accuracy and forecast standard error of prediction markets. Working draft, Henry B. Tippie College of Business Administration, University of Iowa, July 2003
work page 2003
-
[15]
Prediction markets for economic forecasting
Erik Snowberg, Justin Wolfers, and Eric Zitzewitz. Prediction markets for economic forecasting. Work- ing paper, Brookings Institution, June 2012. Prepared for The Handbook of Economic Forecasting, Volume 2
work page 2012
-
[16]
Joyce E. Berg, Forrest D. Nelson, and Thomas A. Rietz. Prediction market accuracy in the long run. International Journal of Forecasting, 24(2):285–300, 2008
work page 2008
-
[17]
Alissa O’Halloran et al. Influenza-associated hospitalizations during a high severity season — influenza hospitalization surveillance network, united states, 2024–25 influenza season.Morbidity and Mortality Weekly Report (MMWR), 74(34):529–537, September 2025
work page 2024
-
[18]
Measles cases and outbreaks.https://www.cdc.gov/ measles/data-research/index.html, 2026
Centers for Disease Control and Prevention. Measles cases and outbreaks.https://www.cdc.gov/ measles/data-research/index.html, 2026
work page 2026
-
[19]
Ray, Tilmann Gneiting, and Nicholas G
Johannes Bracher, Evan L. Ray, Tilmann Gneiting, and Nicholas G. Reich. Evaluating epidemic forecasts in an interval format.PLOS Computational Biology, 17(2):e1008618, 2021
work page 2021
-
[20]
H. Akaike. A new look at the statistical model identification.IEEE Transactions on Automatic Control, 19(6):716–723, 1974
work page 1974
-
[21]
Prediction markets as a public health threat.Science, 392(6795), 2026
Nizan Geslevich Packin and Sharon Rabinovitz. Prediction markets as a public health threat.Science, 392(6795), 2026. 7
work page 2026
discussion (0)
Sign in with ORCID, Apple, or X to comment. Anyone can read and Pith papers without signing in.