Recognition: 1 theorem link
· Lean TheoremEvidence for Multiple Orbiting Hotspots in the 340 GHz Variability of Sgr A*
Pith reviewed 2026-05-13 05:42 UTC · model grok-4.3
The pith
Sgr A* 340 GHz variability matches a model of multiple orbiting hotspots with decaying emission.
A machine-rendered reading of the paper's core claim, the machinery that carries it, and where it could break.
Core claim
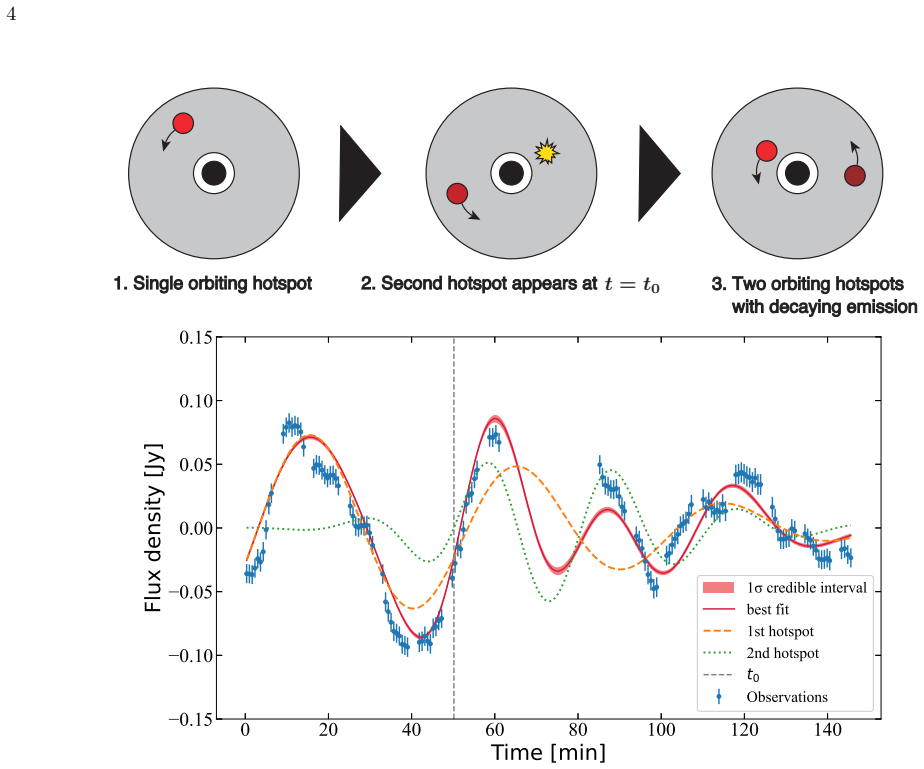
We find that the variability is well described by a model involving multiple orbiting hotspots with decaying emission. This interpretation suggests that both periodic and non-periodic variability in Sgr A* may arise from a common physical origin in orbiting structures within the accretion flow, providing a unified framework for its millimeter variability.
What carries the argument
A model of multiple orbiting hotspots with decaying emission that reproduces the observed light-curve structure, amplitude evolution, and timescales near the orbital period at the ISCO.
Load-bearing premise
The light-curve structure and amplitude evolution are produced by orbital motion of hotspots with decaying emission rather than by other variability processes in the accretion flow.
What would settle it
A new epoch showing similar short-timescale variability that lacks the expected phase-dependent structure and progressive amplitude decay, or that is better fit by a non-orbital red-noise model, would undermine the hotspot interpretation.
Figures

read the original abstract
We analyzed 11 epochs of archival Atacama Large Millimeter/submillimeter Array (ALMA) data to investigate flux density variability of Sgr A* at 340 GHz. In one epoch, the light curve exhibits two short-timescale components with characteristic periods of ~30 min and ~50 min. While the corresponding peaks in the periodogram are highly significant under a white-noise assumption, their significance decreases below 3 \sigma when red-noise variability is taken into account, and we therefore do not regard them as statistically significant periodic detections. Nevertheless, the observed timescales are comparable to the orbital period near the innermost stable circular orbit of Sgr A*, and the light curve shows phase-dependent structure and amplitude evolution consistent with orbital modulation. We find that the variability is well described by a model involving multiple orbiting hotspots with decaying emission. This interpretation suggests that both periodic and non-periodic variability in Sgr A* may arise from a common physical origin in orbiting structures within the accretion flow, providing a unified framework for its millimeter variability.
Editorial analysis
A structured set of objections, weighed in public.
Referee Report
Summary. The manuscript analyzes 11 epochs of archival ALMA 340 GHz observations of Sgr A* flux density variability. In one epoch the light curve exhibits two short-timescale components with periods of ~30 min and ~50 min. The corresponding periodogram peaks are highly significant under white-noise assumptions but fall below 3σ once red noise is modeled, so the authors do not claim statistically significant periodic detections. Nevertheless, they argue that the observed timescales, phase-dependent structure, and amplitude evolution are consistent with orbital motion near the ISCO and present a descriptive model of multiple orbiting hotspots with decaying emission that they state 'well describes' the variability, thereby suggesting a common physical origin for both periodic and non-periodic variability in orbiting accretion-flow structures.
Significance. The authors are appropriately cautious in declining to claim statistical significance for the periods under red-noise assumptions. If the hotspot model were shown via quantitative comparison to outperform red-noise alternatives in describing the light-curve morphology and evolution, the work would supply a physically motivated unified framework linking different variability regimes in Sgr A* at millimeter wavelengths to orbital dynamics near the ISCO.
major comments (2)
- [Abstract] Abstract: the central claim that the variability 'is well described by a model involving multiple orbiting hotspots with decaying emission' is presented without any quantitative goodness-of-fit metric, parameter uncertainties, or formal model-comparison statistic (e.g., likelihood-ratio test, AIC, or BIC) against a red-noise null hypothesis such as a broken power-law PSD or damped random walk.
- [Results] Results section on light-curve modeling: the hotspot parameters (periods, amplitudes, decay rates) are adjusted to match the observed light curve, yet no demonstration is given that this parametrization is preferred over simpler non-stationary red-noise processes that can also produce phase-dependent structure and amplitude evolution; the unified-origin interpretation therefore rests on a post-hoc descriptive fit rather than a statistically supported preference.
minor comments (1)
- [Abstract] Abstract: the specific epoch exhibiting the ~30 min and ~50 min features is not identified, nor are the criteria used to select the 11 epochs or the data-reduction steps that could affect the light-curve structure.
Simulated Author's Rebuttal
We thank the referee for their careful and constructive review. We address each major comment below and have revised the manuscript to clarify the descriptive character of the hotspot model and to moderate the strength of our interpretive claims.
read point-by-point responses
-
Referee: [Abstract] Abstract: the central claim that the variability 'is well described by a model involving multiple orbiting hotspots with decaying emission' is presented without any quantitative goodness-of-fit metric, parameter uncertainties, or formal model-comparison statistic (e.g., likelihood-ratio test, AIC, or BIC) against a red-noise null hypothesis such as a broken power-law PSD or damped random walk.
Authors: We agree that the original abstract phrasing implied a stronger endorsement of the model than the analysis supports. The hotspot model was constructed by eye to reproduce the prominent morphological features and amplitude evolution rather than through a formal optimization or comparison procedure. In the revised manuscript we have changed the abstract to state that the variability 'can be described by a model involving multiple orbiting hotspots with decaying emission' and have added an explicit statement that this remains a qualitative illustration without quantitative goodness-of-fit metrics or model-comparison statistics against red-noise alternatives. revision: yes
-
Referee: [Results] Results section on light-curve modeling: the hotspot parameters (periods, amplitudes, decay rates) are adjusted to match the observed light curve, yet no demonstration is given that this parametrization is preferred over simpler non-stationary red-noise processes that can also produce phase-dependent structure and amplitude evolution; the unified-origin interpretation therefore rests on a post-hoc descriptive fit rather than a statistically supported preference.
Authors: The referee correctly notes that no statistical preference for the hotspot parametrization over red-noise models has been demonstrated. The periods, amplitudes, and decay rates were chosen to match the observed light-curve morphology and to illustrate consistency with orbital timescales near the ISCO; they were not obtained from a likelihood fit or subjected to information-criterion comparison. We have revised the results and discussion sections to state explicitly that the model is descriptive, that it reproduces the phase-dependent structure and amplitude evolution by construction, and that we do not claim statistical superiority over non-stationary red-noise processes. The suggestion of a common physical origin is now presented as an interpretive possibility motivated by the data rather than as a statistically supported conclusion. revision: yes
Circularity Check
Fitted multi-hotspot model called 'well described' without independent test or alternative comparison
specific steps
-
fitted input called prediction
[Abstract]
"We find that the variability is well described by a model involving multiple orbiting hotspots with decaying emission. This interpretation suggests that both periodic and non-periodic variability in Sgr A* may arise from a common physical origin in orbiting structures within the accretion flow."
The model parameters are adjusted to reproduce the light-curve structure and amplitude evolution; declaring the data 'well described by' the model is therefore equivalent to the fit succeeding by construction, with no out-of-sample prediction or quantitative rejection of red-noise alternatives shown.
full rationale
The central claim reduces to fitting periods (~30 min, ~50 min), amplitudes, and decay rates to the observed ALMA light curve and then stating that the variability 'is well described by' that construction. The paper itself notes the periodogram peaks fall below 3σ under red-noise modeling, yet offers no likelihood ratio, AIC, or evidence comparison against a pure red-noise process. This makes the unified-origin interpretation a post-hoc parametrization rather than a prediction tested against held-out data or alternatives.
Axiom & Free-Parameter Ledger
free parameters (2)
- orbital periods
- hotspot decay timescale
axioms (2)
- domain assumption Sgr A* possesses an innermost stable circular orbit whose orbital period sets the shortest variability timescale
- domain assumption Flux variability at 340 GHz is produced by orbiting structures in the accretion flow
Lean theorems connected to this paper
-
IndisputableMonolith/Foundation/AlexanderDuality.lean (D=3 from circle linking), IndisputableMonolith/Cost/FunctionalEquation.lean (J(x) uniqueness)reality_from_one_distinction; washburn_uniqueness_aczel unclear?
unclearRelation between the paper passage and the cited Recognition theorem.
We find that the variability is well described by a model involving multiple orbiting hotspots with decaying emission... Fobs(t) = A1(t) sin(2π/T1 t − ϕ) + U(t−t0) A2(t−t0) sin(2π/T2 (t−t0)) with Ai(t) = Ai0 exp(−t²/2σi²)
What do these tags mean?
- matches
- The paper's claim is directly supported by a theorem in the formal canon.
- supports
- The theorem supports part of the paper's argument, but the paper may add assumptions or extra steps.
- extends
- The paper goes beyond the formal theorem; the theorem is a base layer rather than the whole result.
- uses
- The paper appears to rely on the theorem as machinery.
- contradicts
- The paper's claim conflicts with a theorem or certificate in the canon.
- unclear
- Pith found a possible connection, but the passage is too broad, indirect, or ambiguous to say the theorem truly supports the claim.
Reference graph
Works this paper leans on
-
[1]
Abd El Dayem, K., Abuter, R., Aimar, N., et al. 2024, A&A, 692, A242
work page 2024
-
[2]
Abuter, R., Amorim, A., Baub¨ ock, M., et al. 2018, A&A, 618, L10
work page 2018
- [3]
-
[4]
Aschenbach, B., Grosso, N., Porquet, D., & Predehl, P. 2004, A&A, 417, 71
work page 2004
-
[5]
K., Maeda, Y., Morris, M., et al
Baganoff, F. K., Maeda, Y., Morris, M., et al. 2003, ApJ, 591, 891
work page 2003
-
[6]
Belanger, G., Terrier, R., De Jager, O. C., Goldwurm, A., & Melia, F. 2006, 54, 420
work page 2006
- [7]
- [8]
-
[9]
Brown, R. L., & Lo, K. 1982, ApJ, Part 1, vol. 253, Feb. 1, 1982, p. 108-114. NSF-supported research., 253, 108 CASA Team et al. 2022, Publications of the Astronomical Society of the Pacific, 134, 114501
work page 1982
-
[10]
Chatterjee, K., Markoff, S., Neilsen, J., et al. 2021, MNRAS, 507, 5281
work page 2021
- [11]
-
[12]
Dodds-Eden, K., Porquet, D., Trap, G., et al. 2009, ApJ, 698, 676
work page 2009
-
[13]
Dodds-Eden, K., Gillessen, S., Fritz, T., et al. 2011, ApJ, 728, 37
work page 2011
- [14]
-
[15]
Eckart, A., Baganoff, F., Sch¨ odel, R., et al. 2006, A&A, 450, 535
work page 2006
- [16]
- [17]
-
[18]
Genzel, R., Sch¨ odel, R., Ott, T., et al. 2003, Nature, 425, 934
work page 2003
-
[19]
Hamaus, N., Paumard, T., M¨ uller, T., et al. 2009, ApJ, 692, 902
work page 2009
- [20]
-
[21]
2020, ApJL, 892, L30 Jim´ enez-Rosales, A., Dexter, J., Widmann, F., et al
Iwata, Y., Oka, T., Tsuboi, M., Miyoshi, M., & Takekawa, S. 2020, ApJL, 892, L30 Jim´ enez-Rosales, A., Dexter, J., Widmann, F., et al. 2020, Astronomy & Astrophysics, 643, A56
work page 2020
-
[22]
2007, in Astronomical data analysis software and systems XVI, Vol
Golap, K. 2007, in Astronomical data analysis software and systems XVI, Vol. 376, 127
work page 2007
- [23]
-
[24]
M., Wardle, M., Yusef-Zadeh, F., & Kunneriath, D
Michail, J. M., Wardle, M., Yusef-Zadeh, F., & Kunneriath, D. 2021, ApJ, 923, 54
work page 2021
-
[25]
M., Yusef-Zadeh, F., Wardle, M., et al
Michail, J. M., Yusef-Zadeh, F., Wardle, M., et al. 2024, ApJ, 971, 52
work page 2024
-
[26]
2011, Publications of the Astronomical Society of Japan, 63, 1093
Kato, Y. 2011, Publications of the Astronomical Society of Japan, 63, 1093
work page 2011
-
[27]
Mossoux, E., Finociety, B., Beckers, J.-M., & Vincent, F. 2020, A&A, 636, A25
work page 2020
- [28]
-
[29]
Rasmussen, C. E., & Williams, C. K. I. 2006, Gaussian Processes for Machine Learning (Cambridge, MA: MIT Press)
work page 2006
-
[30]
Subroweit, M., Garc´ ıa-Mar´ ın, M., Eckart, A., et al. 2017, A&A, 601, A80
work page 2017
- [31]
-
[32]
2007, MNRAS, 375, 764 von Fellenberg, S
Trippe, S., Paumard, T., Ott, T., et al. 2007, MNRAS, 375, 764 von Fellenberg, S. D., Witzel, G., Baub¨ ock, M., et al. 2023, A&A, 669, L17 von Fellenberg, S. D., Roychowdhury, T., Michail, J. M., et al. 2025, ApJL, 979, L20
work page 2007
- [33]
- [34]
- [35]
- [36]
- [37]
discussion (0)
Sign in with ORCID, Apple, or X to comment. Anyone can read and Pith papers without signing in.